Brittle and Non-Brittle Events in a Continuum-Granular Earthquake Experiment
Abstract
We report moment distribution results from a laboratory earthquake fault experiment consisting of sheared elastic plates separated by a narrow gap filled with a two dimensional granular medium. Local measurement of strain displacements of the plates at over 800 spatial points located adjacent to the gap allows direct determination of the moments and their spatial and temporal distributions. We show that events consist of localized, larger brittle motions and spatially-extended, smaller non-brittle events. The non-brittle events have a probability distribution of event moment consistent with an power law scaling. Brittle events have a broad, peaked moment distribution and a mean repetition time. As the applied normal force increases, there are more brittle events, and the brittle moment distribution broadens. Our results are consistent with mean field descriptions of statistical models of earthquakes and avalanches.
pacs:
45.70.Ht,46.50.+a,91.30.Px,91.45.cnEarthquakes involve complex stick-slip motion, heterogeneous material properties, and a large range of length scales from less than a meter to many hundreds of kilometers Ben-Zion (2008). One feature of earthquakes is a power law probability distribution of earthquake magnitude known as the Gutenberg-Richter (GR) law. In terms of the moment released and for globally averaged strike-slip faults (surfaces moving past each other horizontally) the GR distribution is consistent with with Frohlich and Davis (1993). On individual earthquake faults there are examples of both GR distributions and ones where there is a deficit of smaller events and an excess of larger events Stirling et al. (1996). Because physical measurements that capture the complexity of real earthquake faults are difficult, theoretical models, laboratory experiments and numerical simulations have been developed to provide insight into earthquake physics. The simplest ingredients of a strike-slip fault model Carlson et al. (1994); Ben-Zion (2008); Kawamura et al. (2012) are continuum elastic plates representing the differential motion of large-scale tectonic plates with coupling between the plates determined by frictional interactions. An apparent feature of mature faults is that there is fault gouge - ground up granular matter - at the interface of the plate surfaces Chester and Chester (1998). This feature has prompted consideration of the role of idealized granular media subject to compaction and shear in producing stick-slip fluctuations similar in nature to earthquake events Howell et al. (1999); Bocquet et al. (2001); Fenistein and van Hecke (2003); Majmudar and Behringer (2005); Daniels and Hayman (2008); Hayman et al. (2011). Another class of laboratory experiments has focused on effective friction behavior in seismically relevant materials Marone (1998) or in block-on-block frictional dynamics Ben-David et al. (2010).
Theoretical models incorporate various ingredients from continuum properties Ben-Zion (2008) to statistical physics approaches Carlson et al. (1994); Kawamura et al. (2012) that include discrete granular interactions. These models are usually studied using numerical simulations Ben-Zion (2008); Carlson et al. (1994); Rundle et al. (2003); Kawamura et al. (2012); Ciamarra et al. (2010) but some models are amenable to theoretical analysis and predict universal scaling behavior in the limit of long-range forces, i.e., in the mean field limit Fisher et al. (1997); Dahmen et al. (2011). Universal models are compelling in that they do not rely on detailed modeling of all the relevant physics of earthquakes and other stick-slip systems. The major predictions for mean field theory models Fisher et al. (1997); Dahmen et al. (2009, 2011) concern the slip moment which is the sum of the individual local displacements induced in an event. These local displacements are spatially distributed along the slip plane as in real earthquakes. The probability distribution is expected to scale as for small whereas there may be enhanced probability for large moment events if there is “weakening” in the effective friction (lower effective friction after an event).
We have developed a laboratory analog of a single strike-slip fault with continuum plates and granular fault gouge. We measure the local slip and the total slip moment associated with stick-slip events that occur as the system is slowly sheared. The spatial structure of the slip events along this fault is directly obtained in contrast to other experiments of this class Marone (1998); Hayman et al. (2011). The experiment has two soft plates, one fixed and the other sheared at fixed velocity, and the forces between the plates are coupled across a narrow gap by a confined quasi two-dimensional granular material. We find that the total probability distribution of is consistent with the mean-field prediction Fisher et al. (1997); Dahmen et al. (2011) of for small but shows a crossover to a surplus of large moment events as the applied normal force is increased. When the events are divided into “brittle” (B), large-scale, localized ones and smaller, less localized, “non-brittle” (NB) events (defined in detail below), the NB probability distribution is well described by a distribution over about two decades in , consistent with predictions of mean field theory Fisher et al. (1997); Dahmen et al. (2009). The probability distribution of B events is a broad peaked distribution whose peak shifts towards higher moment and broadens with increasing normal force. Our measurements lend strong support to the applicability of mean field models to complex stick-slip motion associated with natural earthquake behavior.
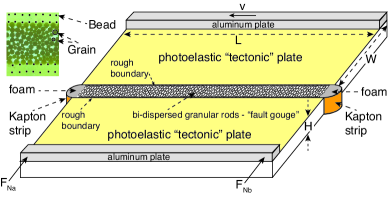
Our experimental apparatus, shown in Fig. 1, consists of two plates formed from photo-elastic material (Vishay PS-4) with dimensions cm, cm, and cm. The plate material has an elastic modulus MPa and a Poisson ratio of 0.50. Aluminum supports on the outer edges provide structural support for the flexible plates and are respectively sheared at one boundary using a linear screw driven by a stepper motor and compressed by a normal force in the range N applied to the fixed boundary ( at opposite ends of the fixed boundary using micrometers and force sensors) at the start of the run. The plates are spaced cm apart and the gap is filled with a bi-dispersed set of 3000 nylon rods with height H and diameters 0.119 and 0.159 cm. The elastic modulus of the granular rods is GPa, 1000 times stiffer than the plate material. At both ends of the gap, a flexible strip of Kapton sheet confines the granular material and a piece of compressible foam keeps the force more or less constant as the plates translate. The total physical displacement in an experiment is cm corresponding to total strain of about 0.04 (), and the shearing velocity m/s corresponds to a strain rate /s (or more traditionally based on : /s). The strain rate gives a natural time scale . The boundary conditions between the elastic plates and the granular material are set by a regularly spaced array of 202 large diameter pins glued into each of the elastic plates at the edge of the fault. Additionally, 812 (4 rows of = 203) ball bearings of 300 m diameter are arranged in two rows on each plate near the inner edge with nominal 0.22 cm separation, as can be seen in the detailed view in the upper left hand corner of Fig. 1. Photographic digital images (Olympus E-620: 3024 4032 pixels) of the ball bearings are taken every 2.5 sec (500 motor steps) and provide individual locations with relative error of m (0.2 pixels) where labels the distance along the gap, is the time index in units of , and indicates the row. As the plates are sheared, the bead arrays deform to follow the elastic response of the plates. The differential motion between successive time steps of bead is defined as with values less than the average noise threshold of 0.3 pixels set to zero. The spatially-integrated moment at time step is . We then convert this to a dimensional moment by multiplying by the area of an event which is the spacing between beads times the plate height . Finally, we obtain a dimensionless moment for event of where cm/pixel.
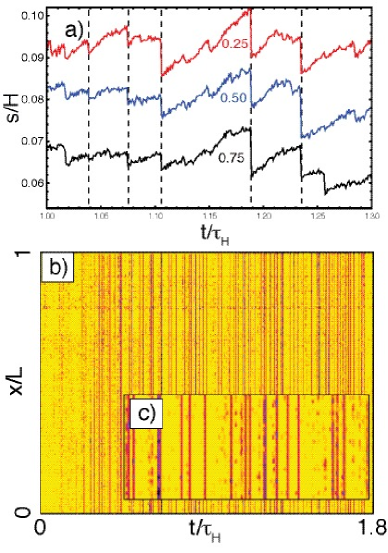
A critical aspect of our experiments is the ability to determine the spatial distribution of stick-slip events. In Fig. 2 (a), we show a typical set of displacements versus normalized time for lateral positions = 1/4, 1/2, and 3/4. Large displacements indicated by dashed lines occur over the whole fault length whereas the spatial coherence of smaller events varies. A more indicative representation of spatial coherence can be seen in a space-time plot of the magnitude of the differential displacements in Fig. 2(b). Large, fault-spanning events (solid vertical lines spanning most of in Figs. 2(b),(c)) occur frequently for these conditions (the frequency increases and the events become more nearly periodic at higher normal load). A close-up view of the motions near the center of the fault in Fig. 2(c), shows detail of smaller events in which only a few locations or clusters of beads slip in a given time interval. In addition to global events and spatially extended ones, there are localized events that have length less than . This variation arises from the heterogeneous force distribution in the granular material set up by stress chains. To extract more detailed spatial information, the center for an event at time is defined by the displacement-weighted bead position , where is the nominal initial position of the bead . The degree of spatial localization of an event at time is then defined by the radius of gyration, . We also compute a normalized quantity that reflects the spatial extent of an event: where is the number of non-zero values of (the numerical factor gives for a spatially uniform event of any size with constant amplitude).
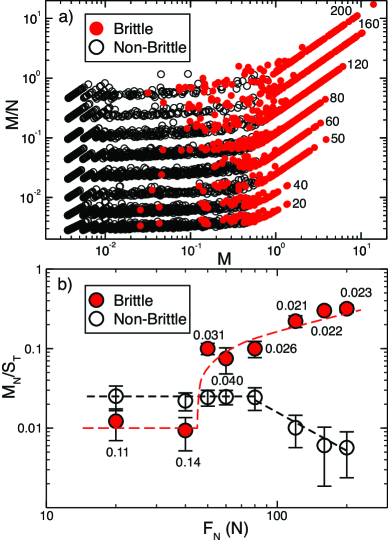
For events that involve motion at only a small number of locations, the average motion per bead, in the event is nearly constant as a function of , as seen in Fig. 3(a). The average motion typically spans a small range, so that events differ in moment owing to the number of beads involved rather than the distance that they move because an isolated site can only move so far before the elastic reaction from its nearest neighbors significantly increases. For high moments, is linear in because the number of beads participating in a slip event is limited by the size of our experiment, i.e., so that can only grow in proportion to the average bead displacement (a similar trend is seen for very small ). These events may achieve much higher average displacements per bead than the localized events because there are no locations remaining pinned by force chains across the gouge and therefore no elastic reaction. This behavior is similar to brittle fracture in solids Alava et al. (2006) and to the “characteristic” events seen in mean field models Fisher et al. (1997); Dahmen et al. (2009), and it suggests that events should be divided into B and NB populations. One way to divide these events is to define B as system spanning events and NB as smaller events (see also Hayman et al. (2011)). We refine this division by including as brittle events localized ones with and where (twice our noise threshold). Our results do not depend sensitively on either cutoff. Both types of events are indicated in Fig. 3(a).
In any particular shear experiment, the system reaches a steady state, i.e., the plastic yield limit, in which the fixed plate no longer has a time-averaged motion accumulating elastic energy. The shear imparted by the moving plate must be released over time, and we can get a sense of the fluid/solid character of the granular medium, i.e., sliding versus stick-slip motion, by comparing the total event moment per site , i.e., with the total displacement of the moving plate ( is the total time of run in which events are recorded). Figure 3(b) shows that the of all B and NB events recorded for the fixed plate captures less than 30% of the continual motion of the driven plate over the full range of normal loading studied. The contribution of the B events increases dramatically in the range N consistent with (long dashed curve in Fig. 3(b) for N), perhaps indicative of a bifurcation, and the contribution of these events is larger than that for NB events except at very low . The NB events account for a constant fraction of the motion up to about 80 N, above which their contribution declines rapidly. The remaining () fraction of the available motion results from steady sliding (contributions from small events below our noise threshold are estimated to be small). In MF models of stick-slip behavior Fisher et al. (1997); LeBlanc et al. (2013), sliding does not affect the expected scalings.
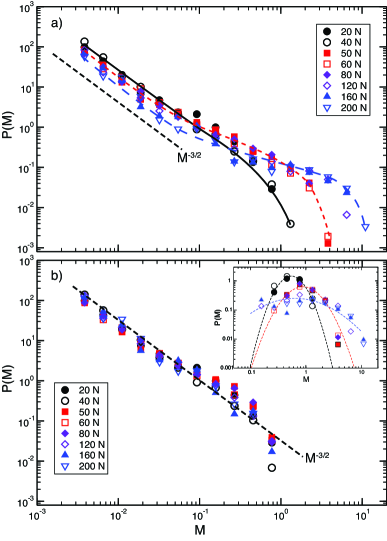
The probability distribution of all recorded event moments for different N is shown in Fig. 4(a). As increases, the probability of NB events decreases, consistent with trends in models Dahmen et al. (2011) that include the effects of packing fraction ( increases with increasing ). The large B events become more probable, growing at the expense of the non-brittle events, and have higher mean for larger . Using our decomposition in B and NB events, we can represent their individual contributions to the overall probability distribution . In Fig. 4 (b), we show the NB distribution (normalized to the number of NB events) and in the inset Fig. 4 (b) we show the B distribution and its variation with . This decomposition demonstrates cleanly that NB events are distributed as a power law over about 2 decades in M consistent with (the remaining depletion/enhancement of may be a finite size effect). On the other hand, the B events are concentrated at large with broader distribution and higher mean as increases. (The weakening parameter for our system Dahmen et al. (2011) is of order 0.07 as indicated by the average fractional shear stress drop for the largest B events.)
In addition to the emergence of excess large-event probability at higher , the B events develop a dominant mean repetition time for large , see Fig. 2(b),(c). The distributions for low are consistent with an exponential distribution in which is representative of a random Poisson process. For , the mean repetition time is with small overall variation with (values labeled for data points in Fig. 3(b)). Many laboratory based experiments and model simulations show the emergence of a mean repetition time associated with large brittle events Ben-Zion (2008); Fisher et al. (1997); Dahmen et al. (2011).
The moment distribution scaling for NB events with the emergence of B events combined with the concurrent development of a mean recurrence time and the demonstrated spatial coherence of B events with increasing gives a cohesive picture of system behavior. At small normal force, spatial and temporal correlations are weak giving rise to random spatially extended events and power law scaling corresponding to the “fluid” like phase in mean field theory Dahmen et al. (2011). As increases, the granular media compacts owing to compressive stresses and more effectively couples motion on either side of the gap. This coupling leads to a larger fractional moment slipped, a mean recurrence time between events, and many more spatially compact events with . Our results are consistent with a system with frictional weakening with weakening parameter . The full physical picture of the phenomena we report is complex involving the jamming properties, i.e., rheology, of the sheared granular medium. Many other features of the experimental data are possible including a “microscopic” elucidation of the individual motions of the grains and their individual or collective motion in events Daniels and Hayman (2008).
We acknowledge conversations with Karen Daniels and Jonathan Uhl. Work at Los Alamos National Laboratory was funded by the National Nuclear Security Administration of the U.S. Department of Energy under Contract No. DE-AC52-06NA25396. K.D. acknowledges support from grants NSF DMR 1005209 and NSF DMS 1069224.
References
- Ben-Zion (2008) Y. Ben-Zion, Rev. Geophys. 46, 1 (2008).
- Frohlich and Davis (1993) C. Frohlich and S. Davis, J. Geophys. Res. 98, 631 (1993).
- Stirling et al. (1996) M. W. Stirling, S. G. Wesnouskey, and K. Shimazaki, Geophys. J. International 124 (1996).
- Carlson et al. (1994) J. M. Carlson, J. S. Langer, and B. E. Shaw, Rev. Mod. Phys. 66, 657 (1994).
- Kawamura et al. (2012) H. Kawamura, T. Hatano, N. Kato, S. Biswas, and B. K. Chakrabarti, Rev. Mod. Phys. 84, 839 (2012).
- Chester and Chester (1998) F. Chester and J. Chester, Tectnophysics 295, 199 (1998).
- Howell et al. (1999) D. Howell, R. P. Behringer, and C. Veje, Phys. Rev. Lett. 82, 5241 (1999).
- Bocquet et al. (2001) L. Bocquet, W. Losert, D. Schalk, T. C. Lubensky, and J. P. Gollub, Phys. Rev. E, 65, 011307 (2001).
- Fenistein and van Hecke (2003) D. Fenistein and M. van Hecke, Nature 425, 256 (2003).
- Majmudar and Behringer (2005) T. S. Majmudar and R. P. Behringer, Nature 435, 1079 (2005).
- Daniels and Hayman (2008) K. E. Daniels and N. W. Hayman, J. Geophys. Res.-Solid Earth 113, B11411 (2008).
- Hayman et al. (2011) N. W. Hayman, L. Ducloué, K. L. Foco, and K. E. Daniels, Pure Appl. Geophys. 168 (2011).
- Marone (1998) C. Marone, Annu. Rev. Earth Planetary Sci. 26, 643 (1998).
- Ben-David et al. (2010) O. Ben-David, G. Cohen, and J. Fineberg, Science 330, 211 (2010).
- Rundle et al. (2003) J. B. Rundle, D. L. Turcotte, R. Shcherbakov, W. Klein, and C. Sammis, Rev. Geophys. 41, 1019 (2003).
- Ciamarra et al. (2010) M. Pica Ciamarra, E. Lippiello, C. Godano, and L. de Arcangelis, Phys. Rev. Lett. 104, 238001 (2010).
- Fisher et al. (1997) D. S. Fisher, K. Dahmen, S. Ramanathan, and Y. Ben-Zion, Phys. Rev. Lett. 78, 4885 (1997).
- Dahmen et al. (2011) K. A. Dahmen, Y. Ben-Zion, and J. T. Uhl, Nature Phys. 7, 554 (2011).
- Dahmen et al. (2009) K. A. Dahmen, Y. Ben-Zion, and J. T. Uhl, Phys. Rev. Lett. 102, 175501 (2009).
- Alava et al. (2006) M. J. Alava, P. K. V. V. Nukala, and S. Zapperi, Adv. Phys. 55, 349 (2006).
- LeBlanc et al. (2013) M. LeBlanc, L. Angheluta, K. Dahmen, and N. Goldenfeld, Phys. Rev. E 87, 022126 (2013).