Discovery of Time Variation of the Intensity of Molecular Lines in IRC+10216 in The Submillimeter and Far Infrared Domains
Abstract
We report on the discovery of strong intensity variations in the high rotational lines of abundant molecular species towards the archetypical circumstellar envelope of IRC+10216. The observations have been carried out with the HIFI instrument on board Herschel††thanks: Herschel is an ESA space observatory with science instruments provided by European-led Principal Investigator consortia and with important participation from NASA and with the IRAM††thanks: This work was based on observations carried out with the IRAM 30-meter telescope. IRAM is supported by INSU/CNRS (France), MPG (Germany) and IGN (Spain) 30-m telescope. They cover several observing periods spreading over 3 years. The line intensity variations for molecules produced in the external layers of the envelope most probably result from time variations in the infrared pumping rates. We analyze the main implications this discovery has on the interpretation of molecular line emission in the envelopes of Mira-type stars. Radiative transfer calculations have to take into account both the time variability of infrared pumping and the possible variation of the dust and gas temperatures with stellar phase in order to reproduce the observation of molecular lines at different epochs. The effect of gas temperature variations with stellar phase could be particularly important for lines produced in the innermost regions of the envelope. Each layer of the circumstellar envelope sees the stellar light radiation with a different lag time (phase). Our results show that this effect must be included in the models. The sub-mm and FIR lines of AGB stars cannot anymore be considered as safe intensity calibrators.
To appear in the Astrophysical Journal Letters
1 Introduction
Half of the known interstellar molecular species are detected in IRC+10216, the envelope of the AGB star CW Leo and one of the brightest infrared sources in the sky. CW Leo, at a estimated distance of 130 pc from the Sun, is a Mira variable star with a period of 630-670 days and an amplitude of 1 mag in the band (Menten et al., 2012, and references therein).
Due to its proximity, its large mass loss rate and wealth of molecules, IRC+10216 attracted much studies and is considered as the archetype of high-mass loss AGB stars. Yet, the formation of the dust and of molecules, some of which are fairly complex, and their dependance on the stellar state of evolution, from AGB to pre-PN, are key issues not yet fully understood. The Herschel satellite (Pilbratt et al., 2010) recently allowed much progress in this domain. The stellar atmosphere and the dust condensation zone are best probed by ro-vibrational lines and by high- pure rotational lines pertaining to the ground and vibrationally excited states. Those lines lie in the infrared and far infrared (FIR) for the most abundant species, such as CO, HCN and SiS (Fonfría et al., 2008; Cernicharo et al., 1996, 2010a; Decin et al., 2010). In contrast, the outer cold layers of the envelope are best probed by low- rotational lines at mm and sub-mm wavelengths.
The determination of the physical conditions througout the envelope can be performed by combining a large set of FIR, mm, and sub-mm data. However, and despite the fact that IR pumping is recognized to play a role in the excitation of molecular lines in evolved stars (Agúndez & Cernicharo (2006) for H2O; Deguchi & Uyemura (1984) for HC5N); Daniel et al. (2012) for HNC; de Beck et al. (2012) for CCH), most studies carried out so far assumed steady state, i.e., that the known periodic variations of the stellar IR flux do not modulate molecular line emission. This was partly justified by lack of evidence of line intensity variations, outside a few cases of strong maser emission in O-rich AGBs for which maser line and IR continuum intensities are clearly correlated (Pardo et al., 2004; Nakashima & Deguchi, 2007). Cernicharo et al. (2000), for example, unsuccessfully searched for line intensity variations in their 2-mm spectral survey of IR+10216, which combines observations scattered over 12 years and mostly detects low- transitions from fairly abundant species and their isotopologues.
We present the results of a time monitoring of molecular line thermal emission in IRC +10216 taken between 480 and 1907 GHz with the Herschel/HIFI instrument over 3 years, a time interval longer than the light period of IRC+10216 and with the IRAM 30-m telescope in a selected sample of frequencies between 85 and 350 GHz.
We focus in this Letter on the study of CCH (=1-0, 3-2, 4-3, 6-5, 7-6, 8-7) and HNC (=1-0, 3-2, 6-5, 7-6, 8-7). We present the first evidence for strong time variation of the intensity of those lines, as well as of high excitation lines of several other molecular species.
2 Observations and Results
A line survey of IRC+10216 was carried out on May 11-15 2010 with HIFI (de Graauw et al., 2010) using all HIFI bands between 480 and 1907 GHz. These data have been previously presented by Cernicharo et al. (2010b).
A second set of data was taken during November 2010 to search for light hydrides in this source (HCl, HF, PH3, Cernicharo et al., 2010c; Agúndez et al., 2011, 2014). A total of 66 frequency settings with 4+4 GHz bandwidth (USB and LSB) were acquired covering a large number of lines observed in both periods. Some frequency settings for that proposal were taken in May 2011. Both data sets have an rms noise of 7-12 mK in 3 km s-1-wide spectral channels.
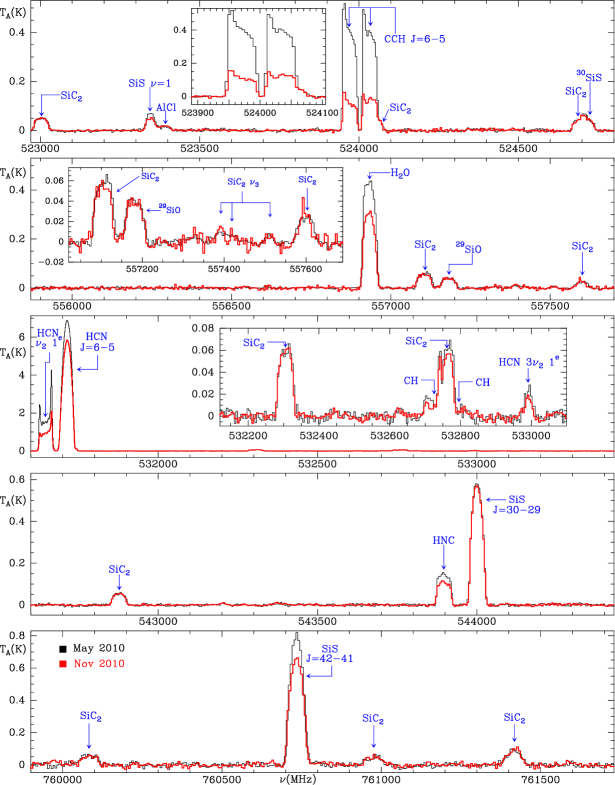
The comparison of the lines taken at six month interval revealed surprisingly large intensity variations, as illustrated on Figure 1. These variations, which, reach a factor of 3 in some cases, are well above any possible instrumental effect: pointing errors, gain calibration, sideband imbalance, baseline ripples, spurious ghost lines, etc. We found, in particular, that:
1) More than 95% of the lines of SiC2 observed in both periods have exactly the same intensity.
2) Spectra with lines exhibiting an intensity variation also contain many other lines, detected with very good signal to noise ratio (10), that do not show any intensity fluctuation.
3) CS, SiO and SiS show a differential effect. Low transitions have low line intensity changes. However, this variation is larger with large reaching a value 25% for the three species (see last two panels of Figure 1 for SiS).
4) The above variations are not directly related to the source extent, as they are observed both for SiS, which is spatially constrained near the star, and to CCH, which is only observed in the outer envelope. The CCH through lines show a factor of 3 of change in intensity, whereas two SiC2 lines, parly blended with the high CCH fine structure component remain constant.
5) Water vapor shows a variation of 50%. Following the models of Agúndez & Cernicharo (2006), which include infrared pumping of H2O, this result could had been expected.
6) HNC shows a systematic change of 20-50% in the integrated intensity of all its lines observed with HIFI.
7) The CO lines observed at both epochs have low- and show no significant intensity variation. However, the line of 13CO, the only13CO line observed in both periods, appears to vary in intensity by 20%.
8) HCN lines below have strong changes, ranging from 20-50%. HCN is a peculiar case, with several regimes in the excitation of its ro-vibrational levels. This makes the excitation diagram quite complex: for example, in the inner shells, the bending state has a population reaching as much as 30% of that of the ground state (Cernicharo et al., 1996, 2010a). The modelling of the observed HCN emission requires the inclusion of vibrational levels up to 12000 K (Cernicharo et al., 1996, 2010a, 2013).
Prompted by these unexpected results, we succeeded in extending by 3 more years our IRC+10216 study with Herschel. In total, 7 observing runs extending from May 2010 to May 2013 were made with HIFI, using the same observing procedure in all runs. In addition, complementary lower frequency observations were carried out with the IRAM 30-m telescope between 2012 and 2013. Note that the observing periods were similar, but not identical on both instruments due to scheduling and weather constraints (we only kept data taken when the precipitable water atmospheric content was between 1 and 10 mm). The system temperatures werethen in the range 80–300 K and the pointing errors below 3′′.
In this work we will focus on the lines of CCH and HNC throughout 2010-2013. The May 2010 data, taken during the first HIFI line survey, have already been analysed for CCH, HNC, CO and SiC2 and published (Cernicharo et al., 2010b, c; Müller et al., 2012; de Beck et al., 2012; Daniel et al., 2012). Full results for all detected molecular species, including data from other instruments will be published in a forthcoming paper.
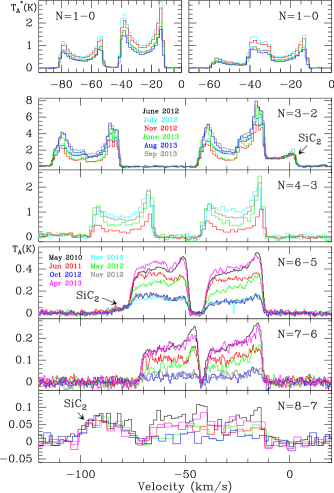
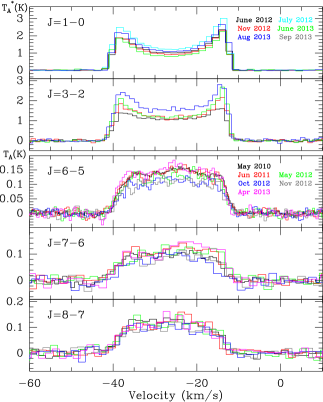
Figure 2 shows the CCH line profiles (composed of several hyperfine components --) observed at different epochs and Figure 3 shows those of HNC. For both molecules, even the lowest rotational transitions exhibit time variations in intensity and shape. The amplitude of the CCH line intensity variations changes with the rotational quantum number , the higher-, the larger the amplitude (a factor of 3 for and about 7 for ). This is consistent with the expectation that collisional excitation is less efficient for the higher rotational levels of CCH, a molecule only present in the outer envelope, making infrared pumping relatively more efficient. It is worth noting that the strongest component of CCH (Figure 2 second panel from top) is partially blended with a line of SiC2 () which shows little or no intensity variation. The IRAM 30-m telescope observations show many other molecular lines with no significant intensity changes. Hence, the observed time fluctuations of the lines of CCH and of HNC are not produced by calibration or pointing errors.
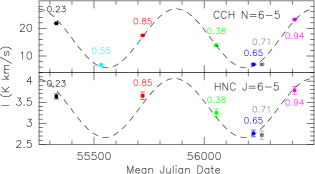
Besides being definitively real, the CCH and HNC line intensity variations correlate well with the periodic stellar light variations. Figure 4 shows the observed line intensities, as derived from Figures 2&3, atop the predicted stellar IR intensity (derived from Menten et al. (2012) for a period of 630 days) after applying shifts of respectively 51 days and 59 days for HNC and CCH. This shift is similar to that observed by Groenewegen et al. (2012) for the FIR dust continuum emission. Infrared light variations, by modulation of radiative pumping of the molecular levels, and, possibly in the innermost layers of the CSE by modulating the dust grain and gas temperatures, clearly appear as the cause of the observed molecular line intensity variations. These effect must definitively be included in radiative transfer () models.
3 Discussion
The results described above require a detailed and careful revision of the interpretation and modelling performed up to now. Most of the models were aimed at deriving the population of the molecular energy levels of the abundant species, such as CO, HCN, SiO, SiS, CS, OH and H2O. All these molecules are characterized by thermal emission in their ground vibrational state. Nevertheless, some of them also show strong maser emission and these maser transitions can be used only to derive some estimates of the physical parameters of the envelope.
The modelling of the emission of thermal lines relies on assuming values, or taking them from observations when possible, for the temperatures and sizes for the central star and the dust formation zone (the latter may extend up to 20 R∗ (Fonfría et al., 2008)), as well as the temperature and density profiles for the gas and the dust throughout the envelope. One generally assumes that the gas volume density varies as ) and that the geometry is spherically symmetric. One must also adopt an abundance profile for the key molecular species. The terminal expansion velocity in the envelope and the velocity field within the dust formation zone can then be derived from observations (see, e.g., Fonfría et al. (2008), Cernicharo et al. (2010a)).
From the observation of a large number of molecular lines of a given molecule with widely different energy levels several of these parameters can be constrained in steady state. However, when the central star and dust formation zone show significant flux intensity variations, i.e. when the steady state does not hold anymore, the problem becomes much more complex. The phase of the radiation field, seen at a given time by each point of the envelope, depends on the distance to the central radiation. Moreover, the temperature of the local gas, hence the collisional excitation rates, may also be modulated with different phase lags, since the gas heating and cooling are dominated in the inner regions by IR transitions that have large Einstein coefficients. The equilibrium times for the gas with the stellar and dust fluxes could there be fairly short. Statistical equilibrium equations assume that dni/dt=0, where ni represents the population of level . However, now the source function, which describes the radiation field reaching a point of the envelope, depends on time in a complex way. Not only the radiation directly incoming from the star and its surrounding hot dust shell, comes at a given point P of the envelope with a time lag, as described above, but each envelope point radiatively connected to P sees this stellar radiation with a different phase, because it lies at different distance from the star and is distant from P. The magnitude of this effect on the depends on the period of the star, the size of the envelope, the molecular abundance profile, the local density and the radiative transitions considered. Hence, solving the problem requires to couple statistical equilibrium equations with the stellar light flux and the molecular emission arising from all points of the envelope, each point seeing the stellar radiation with a different phase.
The role of infrared pumping of rotational lines has been discussed many times in the literature. Agúndez & Cernicharo (2006) have shown that including it for H2O decreases the abundance of this molecule in IRC+10216 by a factor 10 as compared to a case in which only collisional excitation is considered. In triatomic molecules such as CCH and HNC infrared pumping has been considered by de Beck et al. (2012) and Daniel et al. (2012). CCH has a peculiarity when compared with HNC. The and vibronic modes of CCH are strongly coupled to the two lower A’ components of the first electronic excited state. The two A” upper components of this state are strongly coupled to the ground vibrational levels and . Hence, CCH has a complex infrared spectrum below 12000 cm-1 (see, e.g., Carrick et al., 1983; Curl et al., 1985; Sharp-Williams et al., 2011) which is difficult to model as 17 vibronic states are coupled at some level producing strong transitions to overtones and combination bands through infrared pumping (Tarroni & Carter, 2003, 2004). Daniel et al. (2012) have considered the effect of including or not the different vibrational modes of HNC in the radiative transfer modelling. The bending mode, , at 21 m could be mainly populated from photons arising in the dust formation zone while the stretching modes and their combination bands with the bending mode will be populated through dust and stellar photons between 2 and 5 m.
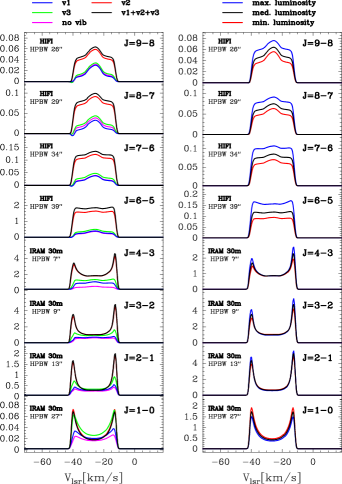
In order to quantify the role of stellar light variations we have developed a model for HNC (Daniel et al., 2012) with the abundance profile for this molecule in IRC+19216 derived recently from ALMA data by Cernicharo et al. (2013). The results are shown on Figure 5. The left pannel show the relative influence of each vibrationnal mode on the emerging line intensities and profiles for stellar phase =0.3. The bending mode at 21 m clearly dominates in all observed rotational lines. For a molecule having a large abundance in the innermost region of the CSE, which is not the case for HNC, pumping through the stretching modes will be also very important (HCN for example). The right pannel show the intensities and profiles for different IR flux levels (i.e. stellar phases). The predicted low- lines show little change with the stellar phase, whereas high- lines show a strong intensity modulation. In spite of the simplicity of our model, which does not include time lags across the CSE (which could be important for large CSEs and for short period stars), the predicted line profiles and intensities reproduce well the observations shown in Figures 2&3. We also see that all lines behave differently: the =1-0 line on Fig. 5 (right) is brighter at minimum IR intensity, whereas the lines with high are dimmer. Indeed, IR pumping tends to populate the high energy levels at the expense of the lowest =0, 1 and 2 levels. This is actually observed for both CCH =1-0 and HNC on Figures 2&3, which show that the light blue profile, corresponding to the minimum of IR flux (July 2012, see Figure 4), is brighter than all other stellar phases.
The question of different time lags between radiatively connected points of the envelope can partly be overcome when the velocity gardient is large with respect to turbulent velocity, which is the case for radii larger than 20R∗. A Large Velocity Gradient (LVG) decouples radiatively all, but the closest points in the envelope, drastically reducing the complexity of the models. As molecular radiation plays in this case only a local role we can solve those equations independently at every radius . The stellar radiation field will be seen at distance from the star with a time lag . The effect on the emerging line profiles will depend strongly on the molecular line opacities. Optically thick lines arising from the whole envelope as the low- lines of CO, HCN, SiC2, will be less sensitive to IR pumping and show little fluctuation. However, the emerging high- lines, which are very sensitive to IR pumping and arise from smaller size regions, will also show a modulation with the stellar phase.
Finally, the blue and red horns of the cusped lines, that respectively arise from the front and rear caps of the expanding envelope, should exhibit a differential phase delay in their intensity variations, upon reaching the observer, that depends on the size of the envelope. This delay may be used to constrain the distance of CW Leo, which is still poorly known (Menten et al., 2012). In the cases of CCH and HNC, which are mainly constrained within a couple of thin spherical shells of radius 14′′-20′′ (corresponding to 3-51016 cm if the actual distance is 130 pc), a delay of 20-30 days could be expected. Unfortunately, although several attempts were done with the IRAM 30-m telescope, at one week intervals, to observe the lowest variable line of CCH, , poor weather prevented us to obtain reliable data.
In conclusion, the derivation of the physical parameters of variable star envelopes, from their sub-mm and far-IR molecular emissions, is not as straightforward as previously assumed. The intensities of sub-mm molecular lines of AGB star envelopes cannot be considered as reliable flux calibrators. Even the far-IR continuum emission from those envelopes may change significantly with the stellar phase (Groenewegen et al., 2012). Nevertheless, the low- lines of CO, which have been used to derive the mass loss rate of AGB stars, are not significantlly affected by their periodical luminosity variations. The interpretation of sub-mm and far-IR line observations of CSEs requires to elaborate models that include the IR flux variations and IR pumping throughout the envelope. Resulting changes in the dust and gas temperatures in the innermost layers of the CSE have also to be implemented. Each molecule in this game has its own peculiarities (abundance profile, frequency and intensities of the vibrational modes). The spatial extent will also affect the balance between collisional and IR pumping. Moreover, these effects could be different for each isotopologue of a given molecule due to the different opacities of their rotational and ro-vibrational lines.
References
- Agúndez & Cernicharo (2006) Agúndez, M., & Cernicharo, J., 2006, ApJ, 650, 374
- Agúndez et al. (2011) Agúndez, M., & Cernicharo, J., Waters, L.B.F.M., et al. 2011, A&A, 533, L6
- Agúndez et al. (2014) Agúndez, M., & Cernicharo, J., Decin, L., et al. 2014, ApJ, 790, L27
- Carrick et al. (1983) Carrick, P.G., Merer, A.J., and Curl, R.F. Jr., 1983, J. Chem Phys. 78, 3652
- Cernicharo et al. (1996) Cernicharo, J., Barlow, M., González, E., et al., 1996, A&A, 315, L201
- Cernicharo et al. (2000) Cernicharo, J., Guélin, M., & Kahane, C. 2000, A&AS, 142, 181
- Cernicharo et al. (2010a) Cernicharo, J., Agúndez, M., Kahane, C., et al., C. 2010a, ApJ, in press
- Cernicharo et al. (2010b) Cernicharo, J., Waters, L.B.F.M., Decin, L., et al., 2010b, A&A, 521, L8
- Cernicharo et al. (2010c) Cernicharo, J., Decin, L., Barlow, M., et al., 2010c, A&A, 518, L136
- Cernicharo et al. (2013) Cernicharo, J., Daniel, F., Castro-Carrizo, A., et al., ApJ, 778, L25
- Curl et al. (1985) Curl, R.F. Jr., Carrick, P.G., and Merer, A.J., 1985, J. Chem Phys. 82, 3479
- de Beck et al. (2012) de Beck, E., Lombaert, R., Agúndez, M., et al., 2012, A&A, 539, A108
- de Graauw et al. (2010) de Graauw T. et al. 2010, 518, L6
- Daniel et al. (2012) Daniel, F., Agúndez, M., Cernicharo, J., et al., 2012, A&A, 542, A37
- Decin et al. (2010) Decin, L., Cernicharo, J., Barlow, M., et al., 2010, A&A, 518, L143
- Deguchi & Uyemura (1984) Deguchi, S., Uyemura, M., 1984, ApJ, 285, 153
- Fonfría et al. (2008) Fonfría, J.P., Cernicharo, J., Richter, M.J., Lacy, J.H., 2008, ApJ, 673, 445
- Groenewegen et al. (2012) Groenewegen, M.A.T., Barlow, M., Blommaert, J.A.D.L., et al., 2012, A&A, 543, L8
- Menten et al. (2012) Menten, K.M., Reid, M.J., Kaminski, T., Claussen, M.J., 2012, A&A, 543, A73 Nature Communications, 5, 3054, DOI:10.1038/ncomms4054
- Müller et al. (2012) Müller, H.S.P., Cernicharo, J., Agúndez, M., et al., 2012, J. Mol. Spectrosc., 271, 50
- Nakashima & Deguchi (2007) Nakashima, J., Deguchi, S., 2007, ApJ, 669, 556
- Pardo et al. (2004) Pardo, J.R. Alcolea, J., Bujarrabal, V., et al., 2004, A&A, 424, 145
- Pardo & Cernicharo (2007) Pardo, J.R. & Cernicharo, J., 2007, ApJ, 654, 978
- Pilbratt et al. (2010) Pilbratt et al., 2010, A&A, 518, L1
- Sharp-Williams et al. (2011) Sharp-Williams, E.N., Roberts, M.A., and Nesbitt, D.J., 2011, J. Chem. Phys. 134, 064314
- Tarroni & Carter (2003) Tarroni, R., Carter, S., 2003, J. Chem. Phys., 119, 12878
- Tarroni & Carter (2004) Tarroni, R., Carter, S., 2004, Mol. Phys., 102, 35