The origin of the atomic and molecular gas contents of early-type galaxies. II. Misaligned gas accretion
Abstract
We study the origin of the wide distribution of angles between the angular momenta of the stellar and gas components, , in early-type galaxies (ETGs). We use the GALFORM model of galaxy formation, set in the cold dark matter framework, and coupled it with a Monte-Carlo simulation to follow the angular momenta flips driven by matter accretion onto haloes and galaxies. We consider a gas disk to be misaligned with respect to the stellar body if degrees. By assuming that the only sources of misaligments in galaxies are galaxy mergers, we place a lower limit of per cent on the fraction of ETGs with misaligned gas/stellar components. These low fractions are inconsistent with the observed value of per cent in ATLAS3D. In the more general case, in which smooth gas accretion in addition to galaxy mergers can drive misalignments, our calculation predicts that per cent of ETGs have degrees. In this calculation, we find correlations between and stellar mass, cold gas fraction and star formation rate, such that ETGs with high masses, low cold gas fractions and low star formation rates are more likely to display aligned cold gas and stellar components. We confirm these trends observationally for the first time using ATLAS3D data. We argue that the high fraction of misaligned gas discs observed in ETGs is mostly due to smooth gas accretion (e.g. cooling from the hot halo of galaxies) which takes place after most of the stellar mass of the galaxy is in place and comes misaligned with respect to the stellar component. Galaxies that have accreted most of their cold gas content prior to the time where most of the stellar mass was in place show aligned components.
keywords:
galaxies: formation - galaxies : evolution - galaxies: ISM - galaxies: elliptical and lenticular, cD - galaxies: kinematics and dynamics1 Introduction
Contrary to naive expectations, early-type galaxies (ETGs; ellipticals and lenticulars), host significant quantities of cold gas in the form of atomic hydrogen (HI) and molecular hydrogen (H2), although the gas fractions in ETGs are on average lower than in late-type galaxies (e.g. Gallagher et al. 1975; Wardle & Knapp 1986; Wiklind & Henkel 1989; Morganti et al. 2006; Oosterloo et al. 2007; Welch et al. 2010; Young et al. 2011; Serra et al. 2012). Serra et al. (2012) found that per cent of ETGs in the ATLAS3D have HI masses , while Young et al. (2011) show that per cent of ETGs have in the same survey. Most ETGs with detected HI and/or H2 show settled configurations, with the cold gas being in a disk or a ring (Serra et al. 2012; Davis et al. 2013). Only per cent of ETGs with detected HI show unsettled configurations. This has been interpreted as being due to interactions with the group environments or a recent minor galaxy merger (Serra et al., 2012). This percentage decreases when focusing on H2 only (Davis et al. 2013; Alatalo et al. 2013).
Lagos et al. (2014b) (hereafter Paper I) explored the origin of the HI and H2 gas contents of ETGs using a semi-analytic model of galaxy formation and showed that the observed gas fractions in ETGs arise in the model due to inefficient replenishment of the gas in ETGs as a result of both ram pressure stripping of the hot gas and heating by active galactic nuclei (AGN), which prevents gas cooling from the hot halo. Model ETGs with high HI and H2 gas contents were shown to be hosted by low mass haloes, and have, on average, ‘younger morphologies’ (i.e. smaller look-back times to the last time these ETGs showed late-type morphologies). These ETGs were shown in Paper I to be more isolated, which agrees with observational inferences of lower density environments for the gas-rich ETGs (Young et al., 2013).
An important finding in the exhaustive observations of the kinematics of the different mass components of ETGs was presented in Davis et al. (2011), where it was convincingly shown that per cent of ETGs have ionised gas misaligned with the stellar kinematics (i.e. the angle between the angular momenta of the stars and the gas is degrees). The way the angle between the different galaxy components is measured in the observations is using high signal-to-noise ( ; Emsellem et al. 2004) integral field spectroscopy and millimeter wave interferometry, from which one can construct two-dimensional kinematic maps. Davis et al. (2011) calculated position angles from the 2D kinematic maps of the stellar and gas components in a way that they trace the bulk of the components rather than substructures. From the position angles, the projected misalignments, rather than the three-dimensional misalignments, were measured. Typical uncertainties in the measured position angles in ATLAS3D are of degrees. Davis et al. (2011) also show that the molecular and ionised gas components are aligned with each other, suggesting a common origin.
The high fraction of stellar/gas misalignments reported by Davis et al. (2011) led to speculation that the origin of this gas is external, pointing to minor mergers as the dominant source of the gas in ETGs that show misaligned gas disks (e.g. Davis et al. 2011; Serra et al. 2012). This intriguing inference has been explored in simulations of galaxy formation very recently, with small samples of simulated galaxies. For example, Serra et al. (2014) show that although simulations can reproduce the nature of slow and fast rotators of the early-type population (see also Naab et al. 2013), the HI contents predicted by these simulations are too low, while also being almost always kinematically aligned with the stellar component. The main disadvantage of the work of Serra et al. is that only simulated galaxies were analysed and therefore strong conclusions regarding the consistency of the simulations with observations cannot be reached.
An important caveat in the interpretation presented by Davis et al. (2011) and Serra et al. (2012), in which only minor galaxy mergers account for the misaligned gas disks observed in ETGs, is that it ignores the stochastic nature of matter accretion from sources (other than mergers) predicted in a cold dark matter (CDM) universe (e.g. Dekel et al. 2009; Johansson et al. 2012). It implies that gas accretion from sources other than galaxy mergers, such as cooling from the hot halo and collimated inflows of gas from filaments, is always aligned with the stellar component. Sales et al. (2012), Sharma et al. (2012), Bett & Frenk (2012), Aumer et al. (2013) and Padilla et al. (2014) show strong evidence from simulations that in a CDM universe the angular momentum of galaxies is not necessarily aligned with that of their host haloes, as accretion from either the cosmic web or mergers can be stochastic. Bett & Frenk (2012) go a step further and show that the inner parts of haloes, where galaxies live, can suffer much more frequent flips of their angular momentum vector than the halo as a whole (see also Sharma et al. 2012).
Bett et al. (2010) show that the median angle between the inner () and total () angular momentum vectors is degrees. Bett et al. also show that the inclusion of baryons drives even larger misalignments, with half of the galaxies having their spin axis misaligned by more than degrees from the host halo spin (see also Bryan et al. 2013 and Tenneti et al. 2014). There is also evidence from hydro-dynamical simulations that the angular momentum of galaxies is affected by the large scale structure; i.e. filamentary structure can fuel gas into galaxies changing its angular momentum direction (e.g. Danovich et al. 2014; Dubois et al. 2014). The result of such accretion process can be alignment with respect to large structures, outside haloes, particularly in the low mass regime (Dubois et al. 2014).
Our motivation is therefore to investigate the alignments between the galaxy components, stars and cold gas (atomic and molecular gas), and the dark matter halo by following the flips in the angular momentum of ETGs throughout their growth history. By flips we mean any change in the direction of the angular momentum vector. This allows us to statistically assess the probability of having a present day ETG with a gas disk that is misaligned with respect to the stellar component. For consistency with the measured projected misalignment angle between different galaxy components in the observations, we show throughout the paper predictions of projected misalignments. The study of angular momentum in galaxies is particularly relevant as ongoing and future surveys, such as Mapping Nearby Galaxies at APO (MaNGA111https://www.sdss3.org/future/manga.php), Calar Alto Legacy Integral Field spectroscopy Area survey (CALIFA222http://califa.caha.es/ (Husemann et al., 2013).), the Sydney-Australian-Astronomical-Observatory Multi-object Integral-Field Spectrograph (SAMI333http://sami-survey.org/ (Croom et al., 2012).), and ultimately the Square Kilometer Array (SKA444https://www.skatelescope.org/), promise to transform our understanding of angular momentum in galaxies in their different components. An example of this is the mass-spin-morphology relation presented by Obreschkow & Glazebrook (2014).
For this study we use the semi-analytical model GALFORM in a CDM cosmology (Cole et al. 2000) presented by Lacey et al. (2014, in prep.). This model includes the improved treatment of star formation (SF) implemented by Lagos et al. (2011b, a). This extension explicitly splits the hydrogen content of the ISM of galaxies into HI and H2. In Paper I we show that the Lacey et al. model provides a very good representation of the gas contents of ETGs (in the form of HI and H2) in the local Universe, particularly when gradual ram pressure stripping of the hot gas is included (see Lagos et al. 2014a for predictions of the gas content of galaxies in the Lacey et al. model at high-redshifts).
This paper is organised as follows. In we summarise the main aspects of the GALFORM model and the flavour presented by Lacey et al. (2014). In we summarise the method for following the flips in the angular momenta of the different component of galaxies (stars, cold gas and dark matter halo), originally introduced by Padilla et al. (2014). In , we present the growth history of ETGs and analyse the transient nature of galaxy morphologies. In , we describe how we calculate the angular momentum flips throughout the history of ETGs and present the expectation for the number of misaligned gas disks and compare with observations. We also introduce a new scenario that can lead to gas disks becoming misaligned in addition to galaxy mergers. In we discuss limitations of the model presented here, also showing predictions for late-type galaxies, and give our conclusions in .
2 Modelling the morphological evolution, neutral gas content and star formation in galaxies
In paper I, we provided a detailed description of all the relevant physical mechanisms which affect the history of ETGs, such as disk formation, bulge formation, ram pressure stripping of the hot gas, star formation and recycling of mass and metals in stars. Here we outline the processes that are modelled in GALFORM and give a brief overview of the model we adopt as a standard in this paper to study the alignment between cold gas and stars in galaxies, which is a variant of the model of Lacey et al. (2014).
GALFORM accounts for the main physical processes that shape the formation and evolution of galaxies. These are: (i) the collapse and merging of dark matter (DM) haloes, (ii) the shock-heating and radiative cooling of gas inside DM haloes, leading to the formation of galactic disks, (iii) star formation in galaxy disks (quiescent mode), (iv) feedback from supernovae (SNe), from heating by active galactic nuclei (AGN) and from photo-ionization of the inter-galactic medium (IGM), (v) chemical enrichment of stars and gas, (vi) galaxy mergers driven by dynamical friction within common DM haloes which can trigger bursts of star formation, and lead to the formation of spheroids, (vii) global disk instabilities, which also lead to the formation of spheroids, and (viii) gradual ram pressure stripping of the hot gas. Galaxy luminosities are computed from the predicted star formation and chemical enrichment histories using a stellar population synthesis model (see Gonzalez-Perez et al. 2014). Note that in the literature ‘quiescent’ is generally used to refer to passive galaxies and/or to those with low star formation rates (SFRs) compared to the median at a given stellar mass, but here we use it to distinguish star formation taking place in the disk of galaxies from the starburst mode, which takes place exclusively in the central spheroid of the galaxy and at efficiencies that are generally higher.
Here we focus on the variant of GALFORM presented in Lacey et al. (2014; hereafter Lacey14) which includes all the processes listed above. One important feature of the Lacey14 model is that it adopts a non-universal stellar initial mass function (IMF). The IMF describing SF in disks (i.e. the quiescent mode) is the Kennicutt (1983) IMF555The distribution of the masses of stars produced follows , where is the number of stars of mass formed, and is the IMF slope. For a Kennicutt (1983) IMF, for masses in the range and for ., while a more top-heavy IMF is adopted in starbursts (i.e. with an IMF slope ). This is inspired by Baugh et al. (2005), who used a top-heavy IMF to reconcile the model predictions with observations of the number counts and redshift distribution of submillimeter galaxies. We note, however, that Baugh et al. adopted a more top-heavy IMF for starbursts, with , than is used for Lacey14.
We now give some details of each of the processes above as included in Lacey14:
- •
-
•
Gas cooling is calculated assuming that gas in haloes follows a profile (Cavaliere & Fusco-Femiano, 1976). The amount of cooling then depends on the gas density and its metallicity following the tabulated cooling function of Sutherland & Dopita (1993). The amount of gas that is added to the disk depends on the cooling time and the free-fall time (see Cole et al. 2000 and Benson & Bower 2010). Given the time elapsed since the formation of the DM halo (i.e. the last mass doubling), the free-fall radius, , is the maximum radius in the hot halo from which material could have moved to the disk; the cooling radius, , encloses the radius within which gas has had time to cool. The mass accreted onto the disk simply corresponds to the hot gas mass enclosed within .
-
•
Lacey14 adopts two different SF laws, one for quiescent SF (i.e. taking place in the disk) and another for starbursts (driven by galaxy mergers and disk instabilities). In the case of quiescent SF, Lacey14 adopts the SF law introduced by Blitz & Rosolowsky (2006), where stars form from the molecular gas in the disk, and the partition of atomic and molecular gas depends on the hydrostatic pressure in the midplane of the disk (see Lagos et al. 2011b for details). For starbursts, the SFR is calculated from the available cold gas mass (HI plus H2), regulated by a SF timescale, , which depends on the dynamical timescale of the bulge, , . The proportionality is a free parameter, and is a minimum starburst duration, which is set to .
-
•
The mass entrainment of supernovae driven winds, , in GALFORM is parametrised by the circular velocity of the galaxy, taken to be a proxy for the gravitational potential well. In Lacey14, . Detailed calculations of SNe feedback suggest the power-law index of this parametrisation should be in the range to (Murray et al. 2005; Creasey et al. 2013; Lagos et al. 2013). The power-law index of in Lacey14 comes from the Monte-Carlo exploration of parameters originally done in Bower et al. (2006), which pointed to that value as the best parameter to recover a flat faint-end in the -band luminosity function. However, since this value is in tension with the more recent studies above, we are currently exploring the effect of including more physical parametrisations (Mitchell et al. 2014; Mitchell et al. in prep.). However, we expect the effect of these new parametrisations on the conclusions presented in this paper to be secondary. This is because the selected model ETGs for the study here are relatively massive , and more affected by AGN feedback (see Paper I for details).
-
•
In GALFORM AGN feedback is assumed to act in haloes where the cooling time is longer than the free fall time at the cooling radius (‘hot accretion’ mode; Fanidakis et al. 2012). In such a halo, the AGN power is computed and if it is greater than the cooling luminosity, the cooling flow is switched off (see Bower et al. 2006).
-
•
For photoionisation feedback, it is assumed that no gas is allowed to cool in haloes with a circular velocity below at redshifts below (Benson et al., 2002). Taking into account simulations by Okamoto et al. (2008) and observational constraints on the reionisation redshift (Komatsu et al., 2011), Lacey14 adopt and .
-
•
For chemical enrichment, we adopt the instantaneous mixing approximation for metals in the ISM, and change the amount of metals recycled depending on the IMF adopted. The stellar evolution models of Marigo (2001) and Portinari et al. (1998) are adopted to calculate the ejected mass and metals from intermediate and massive stars, respectively.
-
•
Lacey14 adopt the updated dynamical friction timescale of Jiang et al. (2008) to estimate the timescale for the orbital decay of satellite galaxies towards the centre. This decay is due to energy and angular momentum losses driven by dynamical friction with the DM halo material. Once the galaxy merger takes place, a starburst takes place in the centre, where the SFR is taken to be proportional to the amount of cold gas (HI plus H2) in the system, regulated by a SF timescale. This SF timescale is calculated as described above. Note that the Jiang et al. (2008) formula is an update of the widely used Lacey & Cole (1993) dynamical friction timescale, using recent -body simulations.
-
•
Global disk instabilities in galaxies occur if the disk becomes sufficiently massive that its self-gravity is dominant over the pressure produced by rotation. In this case, the disk becomes unstable to small perturbations caused by minor satellites or DM substructures. The criterion for instability was described by Efstathiou et al. (1982), Mo et al. (1998) and Cole et al. (2000). SF in the case of instabilities proceeds as in starbursts driven by galaxy mergers. It is important to remark here that the way disk instabilities are treated in GALFORM are a simplification of what detailed simulations show. For example Ceverino et al. (2010), Bournaud et al. (2011) and Bournaud et al. (2014) show that when disks are globally unstable, large clumps of gas are formed that can be long lived due to the large accretion rates that counteract the mass loss due to outflows and stripping. These long live clumps can migrate to the central parts of the galaxy and build a large bulge in less than Gyr. This is captured in our simplified model through the triggering of a starburst in the central bulge of galaxies. However, contrary to our assumption here, simulations show that the disk is not fully destroyed in the process of disk instability. We plan to investigate the effect this has on the history of ETGs in a future paper.
-
•
The standard treatment of the hot gas in the subhaloes around satellite galaxies is usually referred to as ‘strangulation’ of the hot gas, which means that once a galaxy becomes a satellite (when it crosses the virial radius of the larger halo), its hot gas is removed instantaneously and is transferred to the hot gas reservoir of the main halo. This is the model adopted in the default Lacey14 model. However, in Paper I we show that this treatment is too extreme and leads to ETGs having too low HI and H2 gas fractions compared to observations. In Paper I we argue that gradual ram pressure stripping of the hot gas is needed in order to bring gas fractions into agreement with observations. The latter is calculated by considering the ram pressure of the hot gas in the main halo acting against the hot gas of the satellite galaxy as it moves through the halo, and the gravity of the satellite retaining part of the hot halo (see McCarthy et al. 2008; Font et al. 2008). The Lacey14 model including this scheme of gradual ram pressure stripping of the hot gas is referred to as Lacey14+GRP. The latter is our standard model for the rest of the paper, which we show in Paper I to provide HI and H2 gas fractions and mass functions in very good agreement with the observations of the ATLAS3D and HIPASS surveys. Note that we do not include ram-pressure stripping of the cold gas disk of galaxies. Although this process has been shown to be important in cluster environments (e.g. Cortese et al. 2011; Boselli et al. 2014), most ETGs in the model and in ATLAS3D reside in environments other than galaxy clusters, and therefore we do not expect this process to change the conclusions we present in this paper (see paper I for more details).
-
•
To calculate the circular velocity and size of the galaxy disk in GALFORM it is assumed that there is conservation of angular momentum and centrifugal equilibrium in the process of gas cooling, while for the size of bulges, energy conservation and virial equilibrium are assumed during galaxy mergers or disk instabilities. In addition, the mass distribution in the halo and the lengthscales of the disk and the bulge adjust adiabatically in response to their mutual gravity.
3 Following flips in the angular momentum of the gas, stars and dark matter halo


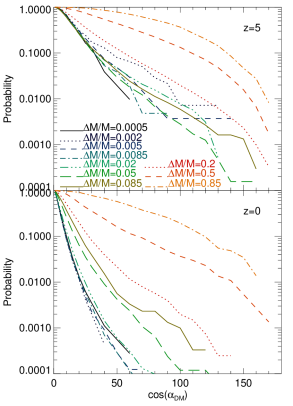
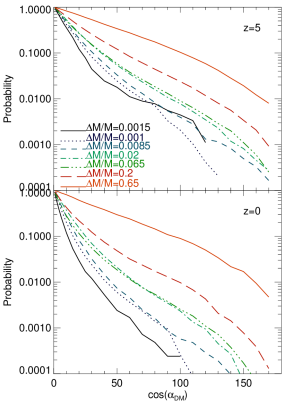
We use the Monte-Carlo based method developed by Padilla et al. (2014) to follow the flips in the angular momenta of the cold gas (atomic plus molecular) and stars in galaxies, and the DM halo. Padilla et al. based their study on the Millennium-II simulation (Boylan-Kolchin et al., 2009), which has a resolution that is times better than the Millennium simulation described in 2. This allowed Padilla et al. to accurately calculate the angular momentum, , in all DM haloes and subhaloes with masses , based on at least particles666Note that in Millennium-I a halo of mass is resolved with particles only, which makes the measurements of angular momentum very noisy. Thus, the direction of can be accurately traced before and after accretion of matter and merger events. Padilla et al. built a probability distribution function (PDF) for the angle between before and after the accretion, , which depends on the relative change in mass. There are also variations with redshift, due to the expansion of the universe and the relative angular momentum brought by the material as time passes. Thus, we build the PDFs for different redshifts and relative mass changes. In addition, smooth accretion of matter (which is from the cosmic web and it is not resolved in individual haloes) and halo mergers drive different magnitudes of angular momentum flips even though they may cause a similar change in mass, with halo mergers tending to drive higher than accretion onto haloes (see Appendix A for the PDFs produced by Padilla et al.).
The strongest assumption Padilla et al. make to apply this methodology to galaxies is that accretion onto galaxies produces flips in the angular momenta, , of the same order as in the haloes (namely, it will depend on the relative change in mass, on the nature of the accretion, i.e. whether it is from smooth accretion or mergers, and on time), . In other words, Padilla et al. sample the PDFs created from the Millennium-II simulation to find by how much the angular momentum of a galaxy flips due to accretion. This can be done for the different galaxy components.
Padilla et al. (2014) implemented the method above in the semi-analytic model SAG (Lagos et al., 2008; Jiménez et al., 2011), modifying the specific angular momentum of galaxies in the model. This also affects the sizes of galaxies and therefore star formation and the strength of feedback. Padilla et al. did not change any model parameters and show the effect of this new physical model on galaxy properties. Ruiz et al. (2013) presented the recalibration of the Padilla et al. (2014) model and the fits to the stellar mass function.
Here, we apply the Padilla et al. (2014) model as post-processing to GALFORM to calculate the flips in the direction of the angular momentum of ETGs due to their growth history, but we do not modify the sizes of galaxies or any other property as a result. For this reason, there is no need for changing any parameter in the model. By post-processing GALFORM using the Padilla et al. Monte-Carlo method, we can accumulate the flips of the angular momentum vector of the gas disk and, based on the assumption that new stars form perfectly aligned with the gas disk at the time they form, we can calculate the angle between the angular momenta of the gas disk and the stellar body at each timestep in the evolution of galaxies. Although these changes are expected in such a model, Padilla et al. (2014) show that the changes are not major except in the fraction of massive galaxies that are ETGs, in a way that the model including the change in the specific angular momentum due to flips in the direction of the angular momentum vector produces a higher fraction of ETGs than the previous model. We therefore do not expect a self-consistent calculation to strongly change the conclusions we present in this paper.
We can take the predicted history of each ETG in our simulation (based on the Lacey14+GRP model) and calculate the angle between the gas and stars in galaxies and the DM halo. The history of ETGs is fully characterised by minor and major merger events, disk instabilities, accretion of gas from the halo, outflow gas to the halo by recent star formation (SNe feedback), mass loss from intermediate and low-mass stars to the ISM, and heating of the halo gas due to the energy injected there by the AGN (AGN feedback). All these events will change the gas and stellar contents of ETGs.
The way we apply the Padilla et al. methodology to our galaxies is as follows:
-
•
In an individual halo, the angular momenta of the hot gas and dark matter are perfectly aligned before the first galaxy forms.
-
•
When the first galaxy forms, the gas cools down preserving the specific angular momentum of the hot gas and its direction, leading to a gas disk that is perfectly aligned with the hot halo (see panel (i) in Fig. 1). Since stars form from this gas disk, they will also be aligned with the gas and hot halo components.
-
•
When a DM halo of mass accretes matter, , at a time , it flips its angular momentum direction by an angle . This change is instantly propagated to the angular momentum of the hot gas (see panel (ii) in Fig. 1). As a result, there will be some level of misalignment between the gas in the disk that cooled from the hot gas before it flipped and the dark matter halo. Note that the instantaneous reaction of the hot halo assumed here is for simplicity. In reality, there is a torque timescale associated with this process, although this should act on a relatively short timescale of the order of the dynamical timescale of the halo. The stars remain fully aligned with the cold gas disk.
-
•
When new gas cools down from the flipped hot gas halo, it comes misaligned with the existing gas and stellar disk (see panel (ii) in Fig. 1). The timescale for this gas to cool down and be accreted onto the galaxy disk is calculated as described in 2 (second bullet point). The cooled gas will change the direction of the angular momentum vector of the cold gas disk towards that of the hot halo (see panel (iii) in Fig. 1). The resulting cold gas disk will form stars, and will also change the direction of the angular momentum vector of the stellar disk towards that of the cold gas disk (as in panel (iv) in Fig. 2). Depending on the cooled mass and the mass of the newly formed stars relative to the existing disk, there will be a remaining angle between the angular momenta of the cold gas and stellar disks (panel (v) in Fig. 2). The resulting flip in the angular momentum direction of the cold gas and stellar components are calculated as a mass-weighted angle. From this it is implicit that the stars will have an angular momentum direction set mainly by the angular momentum direction of stars at the time of the peak of the star formation activity.
-
•
When there is a process such as disk instabilities or galaxy mergers that drive the formation of galaxy bulges from a preexisting stellar disk, we assume that the newly formed bulge preserves the direction of the angular momentum the stellar disk had. Any further star formation episode will affect the direction of the angular momentum of the bulge as a result. This means that when we talk about stellar component we mean bulge plus disk, and assume these are always aligned with each other. This is supported by theoretical work that shows how the components slew to each other to align their angular momenta (Binney & May, 1986).
-
•
During disk instabilities, the cold gas is consumed in a starburst and therefore loses its memory of the flips it had accumulated over time, while stars preserve this memory. In a subsequent gas accretion episode the gas will come with the angular momentum direction of the current hot halo, and may form stars. We calculate the change these newly born stars produce in the angular momentum vector of the stellar body as we explained above (see panel (vi) in Fig. 2).
-
•
In the case there is a galaxy merger, we take the PDFs corresponding to the galaxy merger case (see Appendix A), and then we apply the same methodology as above to get the new angle between the angular momenta of the cold gas and stellar body. For the same fractional change in mass, galaxy mergers tend to produce larger flips in the angular momentum direction than results from gas accretion.
Since the growth history is recorded for each ETGs at the output times of the simulation, we perform the above calculations at every time step, producing a history for the angle between the angular momenta of the different components of ETGs. An important assumption in this model is that consequent flips in the angular momenta of the galaxy components are not correlated. This means that flips can change the angular momenta in random directions, and are not necessarily correlated with the direction at previous times. We test this assumption in 6.
Note that in this model we do not take into account any relaxation of the gas disk towards the stellar component due to torques. In the case of the dark matter component this is implicitly included, as the distributions of flips was obtained by Padilla et al. (2014) using a -body simulation, which includes the gravitational interactions. If the gas is faster in its relaxation than the DM components, then the calculation here would represent upper limits for the angle between the gas and the stellar components of ETGs. An important consideration is that this is done for individual galaxies in their sub-haloes. This prevents central galaxies from changing their angular momentum direction due to substructures in the halo. In other words, central galaxies are not affected by changes in the angular momenta of their satellite galaxies (unless they merge).
In observations the measured position angle of the gas is measured in ionised and molecular gas, which are aligned, suggesting a common origin (Davis et al., 2011). However, in our model we treat the cold gas, which includes atomic and molecular gas, as a single component, and therefore we do not distinguish possible misalignments between HI and H2. In observations, HI is not always aligned with H2, and indeed a per cent of ETGs show unsettle HI morphologies (Serra et al., 2012), while this percentage in the case of H2 is much lower. We simplified the problem by considering the bulk neutral gas and in our model this approximation might not be so critical as the neutral gas that is subject to environmental interactions is the lower density gas which does not contributes so significantly to the total neutral gas mass.
4 The history and morphological development of ETGs
Morphology is a transient property of galaxies that is tightly connected to their growth history. This is because it depends on the ability of galaxies to grow galaxy disks after events which lead to spheroid formation, such as disk instabilities or galaxy mergers. Throughout the paper we consider ETGs at in the Lacey14+GRP model, which we selected to have , and , where is the -band luminosity, is the mass of HI plus H2, is the stellar mass in the bulge and is the total stellar mass of the galaxy. These selection criteria are adopted to mimic the selection criteria of ATLAS3D (see Paper I for details).
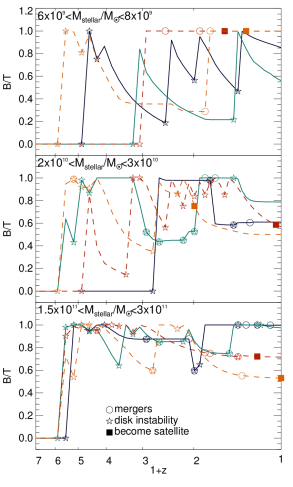
In order to help visualise the transient nature of morphology, we show in Fig. 3 the bulge-to-total stellar mass ratio, , of randomly selected ETGs in different present-day stellar mass bins, separating central galaxies (solid lines) from satellites (dashed lines). The first interesting feature is that massive galaxies tend to have had an early-type morphology (i.e. ) for a longer period than lower mass galaxies. This is seen in the example cases of Fig. 3, and also applies to the general ETG population. The cause of this difference between massive and lower mass ETGs is that low mass galaxies tend to regrow their disk more efficiently than more massive galaxies. In the case of the most massive galaxies, this is typically due to AGN feedback preventing the formation of a new disk. This was discussed in detail in Paper I. The more efficient regrowth of galaxy disks in the lower mass ETGs is due to the continuous accretion of newly cooled gas. The reason why gas accretion continues even at later times (see, for example, the central galaxy in the top panel of Fig. 3 that has a at ) is that these ETGs are hosted by lower mass haloes () and have no AGN to heat cooling flows. Central galaxies in the middle and bottom panels of Fig. 3 are hosted by higher mass haloes, . We also show in Fig. 3 the times when galaxies underwent galaxy mergers and disk instabilities, and in the case of satellite galaxies, we show when they were accreted onto their current halo.
Note that every time a galaxy in the model displays a rapid growth in its ratio, this is due to a galaxy merger or disk instability, as can be seen in the example galaxies in Fig. 3. Also note that not all galaxy mergers lead to higher , but in some cases there is an associated growth of the disk (see for example one of the central galaxies in the bottom panel of Fig. 3 that had a galaxy merger at ). This can happen during minor mergers with very small satellite-to-central galaxy mass ratios. In the case of model satellite galaxies, there can be disk regrowth once they become satellites in the case of gradual ram-pressure stripping (which is implemented in the Lacey14+GRP model we use here). An example of this are the satellite galaxies in the middle panel of Fig. 3, which continue their disk regrowth, compared to a satellite galaxy in the bottom panel, which stops growing its ratio. The satellite galaxies in the middle panel of Fig. 3 show regrow of their disks as a consequence of the gradual ram pressure stripping mechanism included in the Lacey14+GRP model, as opposed to the strangulation scenario that results in no further gas cooling. The satellite galaxy of the bottom panel of Fig. 3 that became a satellite at does not show any disk regrowth (i.e. its does not significantly change in the time the galaxy has been satellite). The reason for this is that the halo mass of the latter galaxy is higher than those of the satellite galaxies in the middle panel of Fig. 3. This translates into ram pressure stripping being more efficient in the former case.
Very different stellar mass assembly histories can lead to galaxies having an early-type morphology, as the example galaxies of Fig. 3 show. The specific history of each ETG is expected to have a strong effect on the alignment of their stellar, gas and dark matter components. In the model of Padilla et al. (2014), every galaxy merger, disk instability and smooth accretion event is considered when following the angular momenta flips. We use the individual gas accretion history of every ETG to estimate their angular momenta alignments in the next section.
5 The origin of misaligned gas disks in early-type galaxies
In this section we discuss the expected frequency of ETGs that have gas disks misaligned with their stellar component in the Lacey14+GRP model. We compare extensively with the observations of the ATLAS3D, which are discussed in detail in Davis et al. (2011). We find that the percentage of misaligned gas disks and stellar components in the ETGs of ATLAS3D is per cent777The error in this percentage correspond to a Poisson error..
5.1 Lower limits on the number of misaligned gas disks in ETGs
In order to show how much misalignment is expected from mergers alone we post-process the ETGs selected from the Lacey14+GRP model using the Padilla et al. (2014) scheme, but we do not apply any misalignment due to gas accretion from the hot halo. The results of this exercise are shown in Fig. 4. If we only allow mergers to drive misalignments, the model fails to reproduce the observed tail of ETGs that have angles between the angular momenta of the stars and the cold disk, degrees. We find per cent of ETGs with degrees. This percentage increases to per cent in the case we adopt the Lacey & Cole 1993 dynamical friction timescale. This indicates that other sources of misaligned gas are important if the model is to agree with the observations.
The fractions calculated above represent lower limits as it is assumed that gas accretion onto galaxies from processes other than galaxy mergers come in perfectly aligned with the stellar body. In Paper I, we show that the vast majority of recent galaxy mergers (i.e. those that took place in the last Gyr) correspond to minor mergers that drive starbursts only in per cent of cases. The remaining per cent correspond to the accretion of small galaxies onto the larger ETGs. Of all ETGs with cold gas masses , the percentage that have their current cold gas content supplied mainly by galaxy mergers ranges from per cent to per cent. The main driver of the variation in this percentage is the adopted dynamical friction timescale. Adopting the Jiang et al. (2008) dynamical friction timescale, as in Lacey14, leads to earlier minor mergers and consequently a lower merger rate at , leading to the per cent figure referred to above. On the other hand, adopting the Lacey & Cole (1993) dynamical friction timescale, as in the models of Lagos et al. (2012) and Gonzalez-Perez et al. (2014), leads to a higher rate of minor mergers at , corresponding to the per cent value referred to above. However, these mergers do not necessarily cause a notable change in the angular momentum of the stellar and/or cold gas bodies. In fact the calculation of Padilla et al. (2014) shows that galaxy mergers produce larger angular momentum flips than other forms of accretion but the angle between the angular momentum of the haloes before and after the merger is likely to be small (see Appendix A). This angle also depends on the mass ratio between the two galaxies. This is the reason why a relatively high fraction of ETGs have their current gas content supplied mainly by galaxy mergers, but do not show significant misalignments.
5.2 The distribution of misaligned gas disks in ETGs due to the history of angular momenta flips
We now apply the full scheme introduced by Padilla et al. (2014) to GALFORM galaxies as a more complete calculation than that in 5.1. We remind the reader that we take the mass growth history of ETGs from the Lacey14+GRP model and post-process it to follow the flips of the angular momenta. The full calculation of Padilla et al. (2014) includes changes in the direction of the angular momenta of galaxy components due to both galaxy mergers and the accretion of cooled gas from the hot halo.
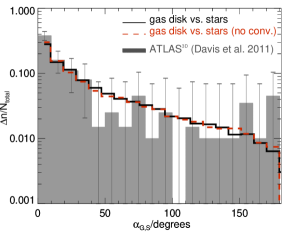
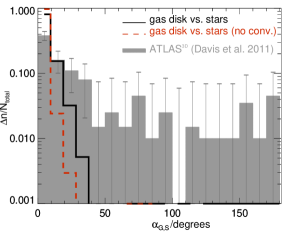
Fig. 5 shows the predicted distribution function of the angle between the cold gas (HI+H2) and the stellar component of ETGs, . We also show these distributions after convolving with a Gaussian distribution with its centre at zero degrees and a standard deviation of degrees, which corresponds to the expected scatter in the observations of (Davis et al., 2011). Observations of the ATLAS3D reported by Davis et al. (2011) are shown by the solid histogram with the error bars corresponding to Poission errors. The application of the angular momentum flips model described in 3 leads to per cent of ETGs having degrees and a distribution of that agrees with the observed distribution of ETGs within the error bars (in 6 we quantify the agreement between the model predictions and observations using the Kolmogorov-Smirnov test). This is interpreted as misalignment arising not only from recent mergers, as was assumed in 5.1, but also from the accretion history of ETGs, which can slew the angular momentum of the stellar component over time with respect to the DM halo and also the gas.


We find that the angle of each galaxy is strongly affected by recent accretion onto the galaxy compared to the time when the galaxy assembled its stellar mass888We define this as the time the galaxy had assembled per cent of its stellar mass.. We find that if galaxies assembled per cent of their stellar mass before the last episode of cold gas accretion (either from gas cooling from the hot halo or galaxy mergers), they are more likely to show misalignments between the angular momenta of the cold gas and the stellar component. Indeed, we find that ETGs that have degrees at assembled per cent of their stellar mass by , while their last important gas accretion episode took place later at , on average. On the other hand, in the sample of ETGs with degrees at , we find that per cent of their stellar mass was assembled by , while their last important gas accretion episode took place at around the same time, on average. This happens because the new gas accretion episodes do not contribute strongly to the stellar mass, and so they hardly change the direction of the angular momentum of stars, while the cold gas can be greatly affected if the change in cold gas mass is important.
This result is shown in the top panel of Fig. 6, where we show the redshift of the last cold gas accretion episode of ETGs (either due to gas cooling from the hot halo or a galaxy merger), , as a function of . This cold gas accretion episode can have any mass, but it is on average quite significant; the median cold mass accreted in this last accretion episode is for ETGs with and for ETGs with . We also show the median for bins in and vice-versa to show the dominant trends. Recent accretion can lead either to aligned or misaligned cold gas/stellar components, which can be seen from the higher density of galaxies at low regardless of the value of . All ETGs with earlier last cold gas accretion episodes have more aligned stellar and gas components. This is clear from the median degrees of galaxies that have . Similarly, the median value of for galaxies with is higher than for galaxies with higher values of . Note that the median increases for decreasing .
Another important property that is strongly correlated with the formation time and accretion history of galaxies, and therefore with , is the mass of the sub-halo that hosts an ETG. The bottom panel of Fig. 6 shows that misalignment happens in our model only in intermediate ranges of sub-halo masses, . The main halo is the largest gravitationally bound structure, which are identify in the -body simulation using the friends-of-friends algorithm Davis et al. (1985). Halos can contain substructures that are self-gravitating, which are call sub-haloes and are identify using sub-finder algorithms (Knebe et al., 2013) (see Jiang et al. 2014 for a recent description on how haloes and sub-haloes are identified and followed in the -body simulations used by GALFORM). The most massive sub-halo within haloes generally hosts the central galaxy, while lower mass sub-haloes contain satellite galaxies. Not all satellites retain information about their sub-halo given that the dark matter halo can get heavily stripped so that is not considered a substructure within the main halo anymore. In these cases the sub-halo mass corresponds to the mass of the sub-halo the last time it was identified in the simulation. In the case of ETGs living in massive sub-haloes, , most of the gas accretion took place at higher redshifts, where most of the star formation happened. This leads to alignment between the angular momenta of the stars and the gas; for , the median degrees, while for a halo mass of the median degrees. Similarly, the median halo mass of low is higher than for higher values of . Large misalignments, for example degrees, are exclusive of ETGs hosted by haloes .
In the case of the lowest mass sub-haloes, galaxies have undergone a quieter history, with fewer interactions relative to ETGs hosted by larger mass haloes. This leads the ETG population hosted by low mass sub-haloes to having fewer ETGs with degrees than is the case of ETGs hosted by higher mass sub-haloes.
5.2.1 Variance from field to field


An important question that arises from a sample such as ATLAS3D, which is complete up to a distance of Mpc, is what is the effect of the large scale structure on the statistical analysis we have performed in 5.2 (i.e. cosmic variance)? In other words, if we were to observe different volumes of (which corresponds to a cube of side Mpc), how much variance would we observe in the distribution of ? In this section we investigate the variance of the distribution of .
We make a random selection of sub-volumes within the MS-W7 simulation, with each having a volume of . The resulting distribution of this experiment and the fraction of ETGs with degrees that result are shown in Fig. 7. We find that the percentage of ETGs that have degrees can vary from per cent, with a median of per cent. This translates into a variance of per cent in the volume probed by ATLAS3D. This number agrees very well with the variance as a function of probed volume reported by Driver & Robotham (2010).
We also find that the number of ETGs selected to have and a mass of HI plus H2 is on average in each sub-volume of . This number is very close to the number of ETGs in the ATLAS3D. These variations are quite large and we find that the observed sample of ETGs would need to be extended up to Mpc to reduce the variance in the fraction of ETGs with degrees to a few percent.
5.2.2 Dependence on galaxy properties
In this section we focus on the galaxy properties we find are correlated with and analyse the physical drivers of such correlations. These properties are -band Luminosity and stellar mass, cold gas fraction, satellite/central dichotomy and the SFR. We find no strong dependence of the distribution of on other galaxy properties, such as bulge-to-total stellar mass ratio or total neutral gas mass (HI plus H2).
-band Luminosity and Stellar mass. We find that -band luminosity (often used as a proxy for stellar mass) is anti-correlated with the angle between the angular momenta of the cold gas and the stellar component, . The top-panel of Fig. 8 shows the -band luminosity as a function of . Overlaid are observations of individual galaxies from the ATLAS3D survey (Davis et al., 2011).


The distribution of seen in the ATLAS3D observations is very similar to the predictions of the model: there is a higher number density of galaxies at degrees, with the density of galaxies decreasing towards degrees, but with galaxies covering the full range of at . At higher -band luminosities, the model predicts that ETGs show aligned gas and stellar components, with the largest angles being degrees, in agreement with the observations. These galaxies reside in the highest mass haloes, with a median sub-halo mass of (shown in Fig. 6), which explains why the model predicts a correlation between -band luminosity and . For instance, ETGs with , have on average its last cold gas accretion episode at , while per cent of the stellar mass of these ETGs was in place at . In contrast, ETGs with had the last cold gas accretion episode on average at , while per cent of the stellar mass of these ETGs was in place only by 999Note that the timescale we discuss here for the stellar mass build-up is an assembly age rather than a stellar age. This is because the stellar ages of these galaxies are much higher than the assembly age (see for example Kauffmann 1996 and Baugh et al. 1996).. The latter is due to AGN feedback acting on the most massive galaxies from early-on. We have repeated this experiment with stellar mass rather than -band luminosity and find the same trends.
In order to quantify the agreement with the observations, we calculate the fraction of ETGs in the model and the observations that have degrees in bins of -band luminosity. The results of this experiment are shown in the bottom panel of Fig. 8. For the observations, we calculate Poisson error bars, which are shown by the hatched region, while for the simulations we calculate an errorbar associated with the variance expected from field-to-field, which we discuss in 5.2.1. There is good agreement between the observations and the model. Previous calculations by Dubois et al. (2014) point to stellar mass being strongly correlated with the spin of galaxies and hence is a good indicator of whether the angular momentum of the galaxy is aligned with the halo. However, Dubois et al. do not analyse the alignments between the different galaxy components.


Gas Fraction. We find that the cold gas fraction, expressed as the ratio between the HI+H2 mass and the -band luminosity, is correlated with the level of misalignment between the angular momenta of the cold gas disk and the stellar component such that galaxies with low cold gas fractions tend to be more aligned than galaxies that are gas-rich. This is shown in the top panel of Fig. 9. Galaxies with high cold gas fractions typically have had recent cold gas accretion, which have changed the cold gas content considerably, while their stellar mass has not changed significantly over the same timescale. The effect of this is that the angular momentum of the stellar body is only mildly modified by the newly formed stars, while the angular momentum of the cold gas changes considerably. The gas fraction here is correlated with the recent gas accretion history. We find that this relation holds even when we look at galaxies in a narrow range of stellar masses, pointing to this correlation being independent of stellar mass.
Serra et al. (2014) show that there is a trend of galaxies with low HI fractions to show alignments between the stellar and HI components, while misalignments are more likely in ETGs with higher HI gas fractions. This trend agrees qualitatively with our predictions. We quantify this trend by calculating the fraction of ETGs that have degrees as a function of cold gas fraction, (HI+H2)/, for ETGs in both simulations and observations. In the case of non-detections of HI and/or CO for ATLAS3D galaxies, we take the value of the upper limit on the HI and/or H2 mass. The results are shown in the bottom panel of Fig. 9, where the error bars are as in the bottom panel of Fig. 8. We find that the correlation predicted by the model between and cold gas fraction is also observed in the ATLAS3D, which is reassuring. This is evidence that our model contains some of the mechanisms that drive the misalignments observed in ATLAS3D.
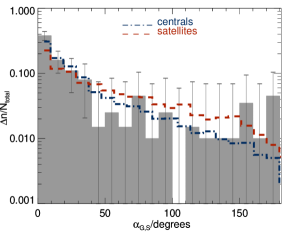
Satellites vs. Centrals. Fig. 10 shows the histogram of the angle between the angular momenta of the cold gas and stellar components in ETGs, separating central and satellite galaxies. There is a trend for satellite galaxies to show misalignments more often than centrals. Satellite galaxies in the model are quenched by ram pressure stripping of the hot gas and SNe driven winds. The former start operating when the galaxy becomes a satellite. Overall, this results in satellite galaxies having per cent of their stellar mass in place earlier than central galaxies, which exhibit more recent star formation. For satellites, accretion of cold gas onto the galaxy can continue for as long as the satellite retains part of its hot gas halo. However, a lot of this cold gas is too low density to transform into H2, resulting in low SFRs that do not alter the stellar mass of the galaxy. In the case of central galaxies, both star formation and accretion of cold gas continue for longer which leads to higher levels of alignment between the two components. Unfortunately, we cannot test this prediction with the current available data, but with larger datasets than ATLAS3D we would be able to cross-match with group catalogues and test this idea.
Note that the trend of satellite/centrals is not driven by stellar mass. We can see this by fixing the stellar mass and then looking at satellite and central galaxies. As an example, for the stellar mass bin , the fraction of satellite ETGs with degrees is per cent, while for centrals this fraction is per cent. However, there is a strong connection between the frequency of misalignments in centrals and satellites and the range of sub-halo masses hosting these two galaxy populations. The median sub-halo mass of satellite ETGs in the model is , where the peak of the frequency of misalignments takes place (see bottom panel of Fig. 6). On the other hand, the median sub-halo mass of central ETGs in the model is .
Star formation rate. Fig. 11 shows the distribution of in three different bins of SFR. We find that in the model, ETGs with low SFRs are associated with a preference for lower values of compared to those with higher SFRs. This is because higher SFRs in ETGs are associated with important recent cold gas accretion. Note that a similar trend is found between and the specific SFR (the ratio between the SFR and the stellar mass; SSFR); i.e. galaxies with lower SSFR show lower values of . At a fixed stellar mass we find that the correlation between and SFR becomes stronger. This is because stellar mass is positively correlated with SFR but anti-correlated with . Thus, when plotting all stellar masses the positive correlation between SFR and becomes weaker. Note however, that the driver of the correlation of with SFR and cold gas fraction is the same and therefore they are not independent.
We test the existence of a correlation between and SFR using ATLAS3D and the measured SFRs presented by Davis et al. (2014). Davis et al. measured SFRs in ETGs using a combination of ultraviolet information from GALEX and infrared photometry from WISE, when far-UV photometry was available, or only WISE data when not far-UV was available. This was possible for a subsample of ETGs. This worsens the statistics, but nevertheless we perform the calculation of the fraction of ETGs with degrees as a function of SFR to reveal possible trends. This is shown in the bottom panel of Fig. 11. The model predictions are also shown. The observations suggest a trend that goes in the same direction as the predictions of our model. It would be possible to confirm such a trend if SFRs were available for all ETGs in the ATLAS3D, as is the case of the cold gas fraction.
6 Limitations of the model and discussion
An important assumption of the model of Padilla et al. (2014) is that flips in the angular momenta of the galaxy components are uncorrelated over time. This means that an angular momentum flip at a given time, for instance, of the gas disk, has a direction uncorrelated to the direction of previous flips. This is not necessarily the case in reality, as matter can come in from preferred directions, for example from filaments. These filaments bring large specific angular momentum compared to that of the halo, and hence are capable of changing the direction of the galaxy angular momentum towards the preferred direction of filaments (Pichon et al. 2011; Sales et al. 2012; Danovich et al. 2012; Aumer et al. 2013; Danovich et al. 2014). This means that subsequent accretion episodes can come from the same (or similar) directions, which translates into angular momentum flips being correlated in direction over time.
| Model | |
|---|---|
| No flips correlated (Lacey14+GRP) | |
| All flips correlated (Lacey14+GRP) | |
| Flips correlated over | |
| (Lacey14+GRP) | |
| Guo et al. (2011) |
The ability of these cold flows to reach the halo centre where galaxies live is under debate. For example, Nelson et al. (2013) suggest that cold streams do not self-shield as efficiently as previously thought, as there is important heating as cold streams travel through the dark matter halo towards the centre. They show that the maximum fraction of gas accreted onto galaxies that did not get shock heated to a temperature close to the virial temperature of the halo is for a present-day halo mass of . This fraction decreases with increasing halo mass. Thus, it is still unclear to what extent angular momentum flips can be correlated in direction over time.
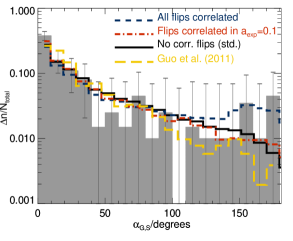
Here we test the idea of all flips in angular momentum being correlated in direction over time, and compare this assumption with our standard model, which assumes uncorrelated flips. Fig. 12 shows the histogram of for our standard model and for the model when all flips are correlated in direction over time. The latter model produces a flatter distribution of , particularly at degrees. The fraction of galaxies with degrees rises from per cent in our standard model to per cent. In order to quantify which model produces results closer to the observed one we calculate the two-sided Kolmogorov-Smirnov (KS) probability, (calculated using the ATLAS3D results). The values of are shown in Table 1 for the standard model (i.e. uncorrelated flips) and for the realisation that assumes correlated flips over time.
From the values in Table 1, one can conclude that observations prefer flips in angular momenta that are not fully correlated over time, i.e. the direction of flips in angular momentum at any time cannot know about all previous flips. Another possibility is that if correlated flips exit, the correlation spans timescales that are shorter than the age of galaxies. In order to test this idea, we perform an experiment where flips are correlated in direction during a finite period of time. We choose to quantify this by the interval in expansion factor where flips are correlated, . We show the result of this experiment for in Fig. 12 and the results of the KS test in Table 1. This model predicts a fraction of galaxies with degrees of per cent and from the results of Table 1 one can conclude that the model using uncorrelated flips is still in better agreement with the observations.
We also show for reference in Fig. 12 the predictions from a different semi-analytic model, that of Guo et al. (2011). In this model they follow the 3-dimensional angular momenta of the gas and stars in galaxies along similar lines to those presented in 3. In Guo et al. stars and gas are treated as independent bodies and they do not react to the gravity of each other as in GALFORM. The predicted distribution of also agrees well with the observations. We calculate a KS probability and the result is presented in Table 1. The Guo et al. model gives slighlty worse agreement with the observations of the ATLAS3D than our standard model. The fact that the model of Guo et al. following a similar scheme as we presented here also predicts a distribution of in reasonable agreement with the observations points to the robustness of such prediction even when physical processes in galaxies are treated differently in different models. Unfortunately semi-analytic models are limited by their simplified geometries, and it is not possible to include collimated flows feeding galaxies. Further studies with fully consistent cosmological hydro-dynamic simulations are needed for this task. Cosmological simulations such as EAGLE (Schaye et al., 2014) and Illustris (Vogelsberger et al., 2014) are ideal for this.
Another interesting result from hydro-dynamical simulations is that the rotation of stars can enhance cooling from the hot halo (Negri et al., 2014). This may be of particular interest for the fast rotators found in ATLAS3D (Cappellari et al., 2011). However, in the simulation setup of Negri et al. (2014), mass loss from stars feeds the halo of galaxies from which cooling takes place. This means that the system is designed to have components which are preferentially aligned. We show in paper I that the fraction of ETGs have their ISM content dominated by this gas source is very small ( per cent), and therefore this may be a second order effect in our calculations. A more complete study, for example using cosmological hydro-dynamical simulations can constrain the importance of this mechanism in driving accretion onto galaxies.
6.1 Expectations for late-type galaxies


The distribution of for late-type galaxies (LTGs; bulge-to-total stellar mass ratio ) will soon be probed by integral field surveys, such as SAMI, MANGA and CALIFA, and therefore it is important to show predictions for this population. The top panel of Fig. 13 shows the distribution of for LTGs and ETGs that have and . The distribution for central galaxies only is also shown. LTGs are expected to show slightly higher levels of misalignments than ETGs. However, the exact fraction of galaxies with degrees is a strong function of stellar mass. Note that the anti-correlation discussed in 5.2.2 between the fraction of ETGs with degrees and -band luminosity (or stellar mass) reverses at for ETGs and at for LTGs, with lower mass galaxies having a lower frequency of degrees. If this turnover exists, the large galaxy catalogue probed by SAMI will be able to see it. The driver of this turnover is due to an important fraction of galaxies below the turnover mass living in haloes with masses . These galaxies have had a quieter history, with fewer interactions relative to galaxies living in more massive haloes. The galaxies in low mass halo show more alignments than galaxies in intermediate halo masses (see Fig. 6).
In the case of LTGs, torques would be stronger since the gas has a clear disk to which to relax. Since we do not explicitly account for torques our calculation would be upper limits.
7 Conclusions
We have explored the origin of misalignments between the stars and gas in ETGs in the local Universe using the Lacey14 variant of the GALFORM model. The reference observational dataset is the ATLAS3D survey, which displays a fraction of per cent of ETGs exhibiting angles between the angular momenta of the gas and stars of degrees. This paper is the second of the series. We show in paper I (Lagos et al., 2014b) that the Lacey14 model reproduces the HI and H2 gas fractions and gas mass distribution functions of ETGs very well. The key to the latter is the incorporation of gradual ram pressure stripping (see Lagos et al. 2014b for details).
We first explore the simplest assumption, which is that the only source of misaligned cold gas (HI plus H2) with respect to the stellar body in ETGs is galaxy mergers. This has traditionally been the observational interpretation of of misaligned cold gas disks (Davis et al. 2011; Serra et al. (2012)). However, we find that there are not enough galaxy mergers at in the model, regardless of the dynamical friction timescale adopted. We find that by adopting the Jiang et al. (2008) dynamical timescale, which is the default option in Lacey14, only per cent of ETGs in the model have had a minor merger in the last Gyr that involved important gas accretion, leading to only per cent of ETGs having degrees. This percentage rises to per cent if we use the Lacey & Cole (1993) dynamical friction timescale, which favours more recent minor mergers.
We then explore a more general approach, which is to follow the history of gas accretion and stellar growth due to star formation in-situ and due to galaxy mergers, and apply the Monte-Carlo simulation of Padilla et al. (2014) to follow the angular momenta flips that are produced by this growth. This simulation analyses the change in mass and the source of that change (i.e. smooth accretion or mergers) and returns PDFs of the angle between the direction of the angular momentum of the component that is changing in mass before and after the accretion. That angle can change in any direction and we accumulate the change over time. We do this for all the components of ETGs we are interested in: hot halo, cold gas disk (HI plus H2) and stellar component. We apply this procedure for all ETGs in the semi-analytic model that have been selected to mimic the ETG selection in the ATLAS3D survey (based on their -band luminosity and HI+H2 mass). Our main findings are:
-
•
By applying the Padilla et al. Monte-Carlo simulation to the ETGs predicted by the Lacey14 model, we find that per cent of modelled ETGs have degrees. This angle varies in the range per cent when we select sub-volumes of the simulation of the size of the volume probed by the ATLAS3D (which observed all ETGs with out to Mpc). The level of misalignment found agrees with the observations, within the error bars. Note that our model has not been tuned to reproduce this observable and therefore this is a true prediction of the model.
-
•
We find that misalignments ( degrees) are found in ETGs living in intermediate mass haloes (), while ETGs hosted by larger or lower mass haloes tend to have degrees. This agrees with the observational results that ETGs living very close to each other (e.g. galaxy clusters or massive galaxy groups) show stellar and gas components that are aligned (Davis et al., 2011).
-
•
We find that the relation between and the halo mass leads to correlations between , stellar mass, cold gas fraction and SFR. Galaxies in the model with high stellar masses, low SFRs and low cold gas fractions show lower values of . The observational findings from ATLAS3D shows that galaxies with show degrees, which agrees very well with our predictions. These show that massive galaxies, , are very unlikely to show misalignments. We also test the prediction that there is a dependence of on cold gas fraction and SFR using the observations of the ATLAS3D and we find that these correlations are also in the observations, and they had not been found before.
-
•
The above trends are understood within the simple phenomenological finding that galaxies that have important gas accretion after most of the stellar mass of the galaxy is in place, are more likely to exhibit cold gas disks misaligned with respect to the stars. This accreted gas can come from either galaxy mergers or smooth cold gas accretion and it is not necessarily aligned with the existing stellar body. Galaxies in the model living in galaxy groups and clusters, which are also the most massive ETGs, lack important recent gas accretion episodes, and therefore their cold gas and stellar mass are aligned.
-
•
We show expectations for LTGs and ETGs over a wide range of stellar masses () and predict the existence of a turnover mass (), at which misalignments are most likely The existence of this turnover mass will soon be probed by integral field galaxy surveys.
The Monte-Carlo approach applied to GALFORM galaxies offers new, interesting ideas for the origin of what has been observed in ETGs in the local Universe, which has proven elusive in simulations of individual galaxies (Serra et al., 2014). The next step will be to integrate this angular momentum scheme directly into GALFORM to model intrinsic alignments between galaxies. Large improvements can also come from recent hydro-dynamical simulations (Vogelsberger et al., 2014; Schaye et al., 2014), which for the first time can tackle the problem of the angular momenta of the different galaxy components from hydro-dynamical simulations in a statistical fashion.
Acknowledgements
The authors thank Andreas Schruba, Paolo Serra, Qi Guo, Lisa Young and Madhura Killedar for useful discussions. The research leading to these results has received funding from the European Community’s Seventh Framework Programme (FP72007-2013) under grant agreement no 229517 and the STFC consolidated grant ST/L00075X/I. VGP acknowledges support from a European Research Council Starting Grant (DEGAS-259586). This work used the DiRAC Data Centric system at Durham University, operated by the Institute for Computational Cosmology on behalf of the STFC DiRAC HPC Facility (www.dirac.ac.uk). This equipment was funded by BIS National E-infrastructure capital grant ST/K00042X/1, STFC capital grant ST/H008519/1, and STFC DiRAC Operations grant ST/K003267/1 and Durham University. DiRAC is part of the National E-Infrastructure.
References
- Alatalo et al. (2013) Alatalo K., Davis T. A., Bureau M., Young L. M., Blitz L., Crocker A. F., Bayet E., Bois M. et al, 2013, MNRAS, 432, 1796
- Aumer et al. (2013) Aumer M., White S. D. M., Naab T., Scannapieco C., 2013, MNRAS, 434, 3142
- Baugh et al. (1996) Baugh C. M., Cole S., Frenk C. S., 1996, MNRAS, 283, 1361
- Baugh et al. (2005) Baugh C. M., Lacey C. G., Frenk C. S., Granato G. L., Silva L., Bressan A., Benson A. J., Cole S., 2005, MNRAS, 356, 1191
- Benson & Bower (2010) Benson A. J., Bower R., 2010, MNRAS, 405, 1573
- Benson et al. (2002) Benson A. J., Frenk C. S., Lacey C. G., Baugh C. M., Cole S., 2002, MNRAS, 333, 177
- Bett et al. (2010) Bett P., Eke V., Frenk C. S., Jenkins A., Okamoto T., 2010, MNRAS, 404, 1137
- Bett & Frenk (2012) Bett P. E., Frenk C. S., 2012, MNRAS, 420, 3324
- Binney & May (1986) Binney J., May A., 1986, MNRAS, 218, 743
- Blitz & Rosolowsky (2006) Blitz L., Rosolowsky E., 2006, ApJ, 650, 933
- Boselli et al. (2014) Boselli A., Cortese L., Boquien M., Boissier S., Catinella B., Gavazzi G., Lagos C., Saintonge A., 2014, ArXiv e-prints
- Bournaud et al. (2011) Bournaud F., Chapon D., Teyssier R., Powell L. C., Elmegreen B. G., Elmegreen D. M., Duc P.-A., Contini T. et al, 2011, ApJ, 730, 4
- Bournaud et al. (2014) Bournaud F., Perret V., Renaud F., Dekel A., Elmegreen B. G., Elmegreen D. M., Teyssier R., Amram P. et al, 2014, ApJ, 780, 57
- Bower et al. (2006) Bower R. G., Benson A. J., Malbon R., Helly J. C., Frenk C. S., Baugh C. M., Cole S., Lacey C. G., 2006, MNRAS, 370, 645
- Boylan-Kolchin et al. (2009) Boylan-Kolchin M., Springel V., White S. D. M., Jenkins A., Lemson G., 2009, MNRAS, 398, 1150
- Bryan et al. (2013) Bryan S. E., Kay S. T., Duffy A. R., Schaye J., Dalla Vecchia C., Booth C. M., 2013, MNRAS, 429, 3316
- Cappellari et al. (2011) Cappellari M., Emsellem E., Krajnović D., McDermid R. M., Serra P., Alatalo K., Blitz L., Bois M. et al, 2011, MNRAS, 416, 1680
- Cavaliere & Fusco-Femiano (1976) Cavaliere A., Fusco-Femiano R., 1976, A&A, 49, 137
- Ceverino et al. (2010) Ceverino D., Dekel A., Bournaud F., 2010, MNRAS, 404, 2151
- Cole et al. (2000) Cole S., Lacey C. G., Baugh C. M., Frenk C. S., 2000, MNRAS, 319, 168
- Cortese et al. (2011) Cortese L., Catinella B., Boissier S., Boselli A., Heinis S., 2011, MNRAS, 415, 1797
- Creasey et al. (2013) Creasey P., Theuns T., Bower R. G., 2013, MNRAS, 429, 1922
- Croom et al. (2012) Croom S. M., Lawrence J. S., Bland-Hawthorn J., Bryant J. J., Fogarty L., Richards S., Goodwin M., Farrell T. et al, 2012, MNRAS, 421, 872
- Danovich et al. (2014) Danovich M., Dekel A., Hahn O., Ceverino D., Primack J., 2014, ArXiv:1407.7129
- Danovich et al. (2012) Danovich M., Dekel A., Hahn O., Teyssier R., 2012, MNRAS, 422, 1732
- Davis et al. (1985) Davis M., Efstathiou G., Frenk C. S., White S. D. M., 1985, ApJ, 292, 371
- Davis et al. (2013) Davis T. A., Alatalo K., Bureau M., Cappellari M., Scott N., Young L. M., Blitz L., Crocker A. et al, 2013, MNRAS, 429, 534
- Davis et al. (2011) Davis T. A., Bureau M., Young L. M., Alatalo K., Blitz L., Cappellari M., Scott N., Bois M. et al, 2011, MNRAS, 414, 968
- Davis et al. (2014) Davis T. A., Young L. M., Crocker A. F., Bureau M., Blitz L., Alatalo K., Emsellem E., Naab T. et al, 2014, ArXiv:1403.4850
- Dekel et al. (2009) Dekel A., Sari R., Ceverino D., 2009, ApJ, 703, 785
- Driver & Robotham (2010) Driver S. P., Robotham A. S. G., 2010, MNRAS, 407, 2131
- Dubois et al. (2014) Dubois Y., Pichon C., Welker C., Le Borgne D., Devriendt J., Laigle C., Codis S., Pogosyan D. et al, 2014, MNRAS, 444, 1453
- Efstathiou et al. (1982) Efstathiou G., Lake G., Negroponte J., 1982, MNRAS, 199, 1069
- Emsellem et al. (2004) Emsellem E., Cappellari M., Peletier R. F., McDermid R. M., Bacon R., Bureau M., Copin Y., Davies R. L. et al, 2004, MNRAS, 352, 721
- Fanidakis et al. (2012) Fanidakis N., Baugh C. M., Benson A. J., Bower R. G., Cole S., Done C., Frenk C. S., Hickox R. C. et al, 2012, MNRAS, 419, 2797
- Font et al. (2008) Font A. S., Bower R. G., McCarthy I. G., Benson A. J., Frenk C. S., Helly J. C., Lacey C. G., Baugh C. M. et al, 2008, MNRAS, 389, 1619
- Gallagher et al. (1975) Gallagher J. S., Faber S. M., Balick B., 1975, ApJ, 202, 7
- Gonzalez-Perez et al. (2014) Gonzalez-Perez V., Lacey C. G., Baugh C. M., Lagos C. D. P., Helly J., Campbell D. J. R., Mitchell P. D., 2014, MNRAS
- Guo et al. (2011) Guo Q., White S., Boylan-Kolchin M., De Lucia G., Kauffmann G., Lemson G., Li C., Springel V. et al, 2011, MNRAS, 413, 101
- Husemann et al. (2013) Husemann B., Jahnke K., Sánchez S. F., Barrado D., Bekerait*error*ė S., Bomans D. J., Castillo-Morales A., Catalán-Torrecilla C. et al, 2013, A&A, 549, A87
- Jiang et al. (2008) Jiang C. Y., Jing Y. P., Faltenbacher A., Lin W. P., Li C., 2008, ApJ, 675, 1095
- Jiang et al. (2014) Jiang L., Helly J. C., Cole S., Frenk C. S., 2014, MNRAS, 440, 2115
- Jiménez et al. (2011) Jiménez N., Cora S. A., Bassino L. P., Tecce T. E., Smith Castelli A. V., 2011, MNRAS, 417, 785
- Johansson et al. (2012) Johansson P. H., Naab T., Ostriker J. P., 2012, ApJ, 754, 115
- Kauffmann (1996) Kauffmann G., 1996, MNRAS, 281, 487
- Kennicutt (1983) Kennicutt Jr. R. C., 1983, ApJ, 272, 54
- Knebe et al. (2013) Knebe A., Pearce F. R., Lux H., Ascasibar Y., Behroozi P., Casado J., Moran C. C., Diemand J. et al, 2013, MNRAS, 435, 1618
- Komatsu et al. (2011) Komatsu E., Smith K. M., Dunkley J., Bennett C. L., Gold B., Hinshaw G., Jarosik N., Larson D. et al, 2011, ApJS, 192, 18
- Lacey & Cole (1993) Lacey C., Cole S., 1993, MNRAS, 262, 627
- Lagos et al. (2011a) Lagos C. D. P., Baugh C. M., Lacey C. G., Benson A. J., Kim H.-S., Power C., 2011a, MNRAS, 418, 1649
- Lagos et al. (2014a) Lagos C. D. P., Baugh C. M., Zwaan M. A., Lacey C. G., Gonzalez-Perez V., Power C., Swinbank A. M., van Kampen E., 2014a, MNRAS, 440, 920
- Lagos et al. (2012) Lagos C. d. P., Bayet E., Baugh C. M., Lacey C. G., Bell T. A., Fanidakis N., Geach J. E., 2012, MNRAS, 426, 2142
- Lagos et al. (2008) Lagos C. D. P., Cora S. A., Padilla N. D., 2008, MNRAS, 388, 587
- Lagos et al. (2014b) Lagos C. d. P., Davis T. A., Lacey C. G., Zwaan M. A., Baugh C. M., Gonzalez-Perez V., Padilla N. D., 2014b, MNRAS, 443, 1002
- Lagos et al. (2013) Lagos C. d. P., Lacey C. G., Baugh C. M., 2013, MNRAS, 436, 1787
- Lagos et al. (2011b) Lagos C. D. P., Lacey C. G., Baugh C. M., Bower R. G., Benson A. J., 2011b, MNRAS, 416, 1566
- Marigo (2001) Marigo P., 2001, A&A, 370, 194
- McCarthy et al. (2008) McCarthy I. G., Frenk C. S., Font A. S., Lacey C. G., Bower R. G., Mitchell N. L., Balogh M. L., Theuns T., 2008, MNRAS, 383, 593
- Mitchell et al. (2014) Mitchell P. D., Lacey C. G., Cole S., Baugh C. M., 2014, MNRAS, 444, 2637
- Mo et al. (1998) Mo H. J., Mao S., White S. D. M., 1998, MNRAS, 295, 319
- Morganti et al. (2006) Morganti R., de Zeeuw P. T., Oosterloo T. A., McDermid R. M., Krajnović D., Cappellari M., Kenn F., Weijmans A. et al, 2006, MNRAS, 371, 157
- Murray et al. (2005) Murray N., Quataert E., Thompson T. A., 2005, ApJ, 618, 569
- Naab et al. (2013) Naab T., Oser L., Emsellem E., Cappellari M., Krajnovic D., McDermid R. M., Alatalo K., Bayet E. et al, 2013, ArXiv:1311.0284
- Negri et al. (2014) Negri A., Posacki S., Pellegrini S., Ciotti L., 2014, ArXiv:1406.0008
- Nelson et al. (2013) Nelson D., Vogelsberger M., Genel S., Sijacki D., Kereš D., Springel V., Hernquist L., 2013, MNRAS, 429, 3353
- Obreschkow & Glazebrook (2014) Obreschkow D., Glazebrook K., 2014, ApJ, 784, 26
- Okamoto et al. (2008) Okamoto T., Gao L., Theuns T., 2008, MNRAS, 390, 920
- Oosterloo et al. (2007) Oosterloo T., Fraternali F., Sancisi R., 2007, AJ, 134, 1019
- Padilla et al. (2014) Padilla N. D., Salazar-Albornoz S., Contreras S., Cora S. A., Ruiz A. N., 2014, MNRAS, 443, 2801
- Pichon et al. (2011) Pichon C., Pogosyan D., Kimm T., Slyz A., Devriendt J., Dubois Y., 2011, MNRAS, 418, 2493
- Portinari et al. (1998) Portinari L., Chiosi C., Bressan A., 1998, A&A, 334, 505
- Ruiz et al. (2013) Ruiz A. N., Cora S. A., Padilla N. D., Domínguez M. J., Tecce T. E., Orsi Á., Yaryura Y. C., García Lambas D. et al, 2013, ArXiv:1310.7034
- Sales et al. (2012) Sales L. V., Navarro J. F., Theuns T., Schaye J., White S. D. M., Frenk C. S., Crain R. A., Dalla Vecchia C., 2012, MNRAS, 423, 1544
- Schaye et al. (2014) Schaye J., Crain R. A., Bower R. G., Furlong M., Schaller M., Theuns T., Dalla Vecchia C., Frenk C. S. et al, 2014, ArXiv e-prints
- Serra et al. (2012) Serra P., Oosterloo T., Morganti R., Alatalo K., Blitz L., Bois M., Bournaud F., Bureau M. et al, 2012, MNRAS, 2823
- Serra et al. (2014) Serra P., Oser L., Krajnovic D., Naab T., Oosterloo T., Morganti R., Cappellari M., Emsellem E. et al, 2014, ArXiv:1401.3180
- Sharma et al. (2012) Sharma S., Steinmetz M., Bland-Hawthorn J., 2012, ApJ, 750, 107
- Springel et al. (2005) Springel V., White S. D. M., Jenkins A., Frenk C. S., Yoshida N., Gao L., Navarro J., Thacker R. et al, 2005, Nature, 435, 629
- Sutherland & Dopita (1993) Sutherland R. S., Dopita M. A., 1993, ApJS, 88, 253
- Tenneti et al. (2014) Tenneti A., Mandelbaum R., Di Matteo T., Feng Y., Khandai N., 2014, MNRAS, 441, 470
- Vogelsberger et al. (2014) Vogelsberger M., Genel S., Springel V., Torrey P., Sijacki D., Xu D., Snyder G., Bird S. et al, 2014, Nature, 509, 177
- Wardle & Knapp (1986) Wardle M., Knapp G. R., 1986, AJ, 91, 23
- Welch et al. (2010) Welch G. A., Sage L. J., Young L. M., 2010, ApJ, 725, 100
- Wiklind & Henkel (1989) Wiklind T., Henkel C., 1989, A&A, 225, 1
- Young et al. (2011) Young L. M., Bureau M., Davis T. A., Combes F., McDermid R. M., Alatalo K., Blitz L., Bois M. et al, 2011, MNRAS, 414, 940
- Young et al. (2013) Young L. M., Scott N., Serra P., Alatalo K., Bayet E., Blitz L., Bois M., Bournaud F. et al, 2013, ArXiv:1312.6318
Appendix A PDFs of angular momentum flips and slews
In Fig. 14 we show the probability distribution functions for the angle between the angular momentum of dark matter halos in the Millennium-II before and after they have accreted mass as calculated by Padilla et al. (2014). Each line corresponds to a fractional change in mass and we show these PDFs for two different redshifts. Fig. 15 shows the same PDFs but for flips in the angular momentum due to mergers with other DM halos.