X-Raying an Accretion Disk in Realtime:
the Evolution of Ionized Reflection during a Superburst from 4U 1636–536
Abstract
When a thermonuclear X-ray burst ignites on an accreting neutron star, the accretion disk undergoes sudden strong X-ray illumination, which can drive a range of processes in the disk. Observations of superbursts, with durations of several hours, provide the best opportunity to study these processes and to probe accretion physics. Using detailed models of X-ray reflection, we perform time resolved spectroscopy of the superburst observed from 4U 1636–536 in 2001 with RXTE. The spectra are consistent with a blackbody reflecting off a photoionized accretion disk, with the ionization state dropping with time. The evolution of the reflection fraction indicates that the initial reflection occurs from a part of the disk at larger radius, subsequently transitioning to reflection from an inner region of the disk. Even though this superburst did not reach the Eddington limit, we find that a strong local absorber develops during the superburst. Including this event, only two superbursts have been observed by an instrument with sufficient collecting area to allow for this analysis. It highlights the exciting opportunity for future X-ray observatories to investigate the processes in accretion disks when illuminated by superbursts.
Subject headings:
accretion, accretion disks — stars: neutron — stars: individual: 4U 1636-536 — X-rays: binaries — X-rays: bursts1. Introduction
Accretion onto neutron stars in low-mass X-ray binaries provides the fuel for runaway thermonuclear burning that powers Type I X-ray bursts (e.g., Lewin et al., 1993). Aside from many brief () bursts, a rare class of X-ray bursts is observed that last many hours: superbursts (Cornelisse et al., 2000; Strohmayer & Bildsten, 2006). They originate from the same systems as the short bursts, but are thought to be due to a carbon flash below the neutron star surface (Cumming & Bildsten, 2001; Strohmayer & Brown, 2002). Although superbursts can reach peak brightnesses similar to those of short bursts, their long durations provide for spectra with much higher signal-to-noise. Only two instances, however, were detected with an instrument capable of collecting such spectra: the Proportional Counter Array (PCA; Jahoda et al., 2006) on the Rossi X-ray Timing Explorer (RXTE; Bradt et al., 1993) observed a superburst from 4U 1820–30 in 1999 (Strohmayer & Brown, 2002) and from 4U 1636–536 (catalog 4U 1636-536) in 2001 (Strohmayer & Markwardt, 2002; Kuulkers et al., 2004).
Keek et al. (2014) performed a detailed time-resolved spectral analysis of the 4U 1636–536 superburst using a phenomenological spectral model. This revealed that the persistent flux increased in brightness and shifted to lower energies during the superburst, returning to pre-superburst values in the tail. Furthermore, the spectra exhibit an emission line and absorption edge close to . Similar features in the spectra of the superburst from 4U 1820–30 (Strohmayer & Brown, 2002) were found to be consistent with reflection of a blackbody spectrum off a photoionized accretion disk (Ballantyne & Strohmayer, 2004). The evolution of the reflection features suggested the temporary disturbance of the inner disk during the burst. Several physical scenarios were put forward to describe the behavior of the superburst–disk interaction, including Poynting-Robertson drag, radiatively or thermally driven winds, and an evolving disk geometry (Ballantyne & Everett, 2005). All processes are expected to play a role, but their relative importance could not be established.
In this Letter we investigate whether the spectra of the 2001 4U 1636–536 superburst are consistent with reflection. The evolution of the ionization state of the reflecting material is quantified, and we discuss possible interpretations.
2. Observations and Spectral Models
The spectra, response matrices, and instrumental backgrounds created by Keek et al. (2014) are reused for this analysis. The spectra are extracted from Standard 2 PCA data in the to energy range. The superburst spans four RXTE orbits. During the first and second orbit, spectra were extracted in time intervals. In orbit the line and edge were found to be exceedingly weak (Keek et al., 2014). To maximize the reflection signal, we extract one spectrum for orbit , with an exposure time of minutes. At this point in the superburst tail, the evolution of the spectral parameters is sufficiently slow to warrant this approach. We exclude orbit from our analysis, because no reflection signal is detected at that time, as the burst illumination has dropped substantially at the end of the superburst.
XSPEC version 12.8.1 (Arnaud, 1996) is employed to analyze the spectra. The main components of our spectral model are a power law with a high energy cutoff (cutoffpl in XSPEC) for the persistent flux and a blackbody (bbodyrad) for the neutron-star emission. Additionally, models of reflection of a blackbody off a photoionized accretion disk are included from Ballantyne (2004), and the grid of models is extended to include blackbody temperatures down to . They self-consistently include the line and edge. Apart from the regular blackbody parameters, the reflection models are a function of the ionization parameter :
| (1) |
with the illuminating flux at the disk and the hydrogen number density. In this Letter we use the logarithm of , with expressed in units of .
To include relativistic smoothing effects, such as Doppler broadening and gravitational redshifts, the reflection components are convolved with the rdblur model (Fabian et al., 1989), under the assumption that the burst illumination pattern drops quadratically with radius. The cflux model is used to determine the flux of the reflected blackbody, . Furthermore, photoelectric absorption is taken into account using the vphabs model with the composition of the absorbing material set to the mean values measured by Pandel et al. (2008) (see also Keek et al., 2014). The reported uncertainties in all fit parameters are at .
3. Results
3.1. Superburst Spectral Fits
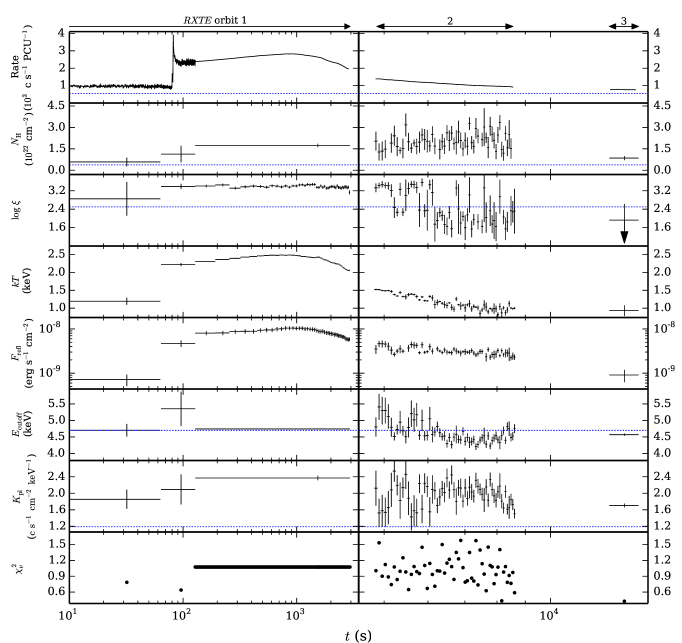
The superburst spectra are fit with the model described above (Section 2). We do not include a component for reflection of the power-law (Section 3.2), because it is expected to be too weak to be detected during the burst (see Keek et al., 2014). The parameters of the rdblur smoothing model are poorly constrained by the fits. We, therefore, choose to fix its parameters: the disk inclination angle is fixed to , and its inner radius to , with the gravitational radius (cf. Pandel et al., 2008). The absorption column, , is not fixed, but is determined by the fit.
Keek et al. (2014) found that the data allow for only a limited number of spectral components to be constrained. This is especially problematic now that a reflection component is added. To limit the number of free parameters, the cutoff power-law photon index is fixed to the pre-superburst best-fit value: (Keek et al., 2014). Furthermore, the normalizations of the spectral components cannot be constrained independently for each time bin. A combined fit is performed of all spectra in the first orbit, excluding the earliest two, which cover the fast part of the rise. During this fit, the values of , blackbody normalization , and cutoff power-law normalization are each set to be the same across all spectra. Previously, these parameters were found to typically exhibit variations of at most (Keek et al., 2014). Also, the power-law cutoff energy is fixed to the pre-superburst value: (see Keek et al., 2014). All other free parameters are allowed to be different for each spectrum (see Figure 1). This combined fit yields . For the rest of the superburst, is again fixed, but is a free parameter. Moreover, is fixed to the best-fit value from the combined fit in the first orbit: (see discussion by Keek et al., 2014). The values obtained with this model match a distribution for acceptable fits.
The results of both parts of the superburst fit are presented in Figure 1. After a high ionization parameter in the first orbit with a weighted mean of (excluding the first ), the fit results exhibit a transition to a lower ionization state with a weighted mean of in the second half of the second orbit111The models exhibit a minimum in the equivalent width of the Fe K iron line near due to Auger destruction (Ballantyne, 2004), but it may not be physical (García et al., 2013). When we artificially increase the line’s equivalent width to remove the minimum, the values of the fitted parameters do not change significantly. The fits are not very sensitive to the line strength, but more to the edge properties (see also Keek et al., 2014).. Rather than following the flux, transitions between two values. For spectra close to the time of the transition, there are two local minima in present around the higher and the lower value of , and the fits jump between these. We investigated a wide range of variations of our spectral model and different choices of fixed parameters, but there is no smooth transition between the two ionization states. The time of the transition is, however, sensitive to the amount of smoothing of the reflection component. With stronger or with no smoothing, it occurs earlier or later. Finally, in orbit , cannot be fully constrained, and we report an upper limit.
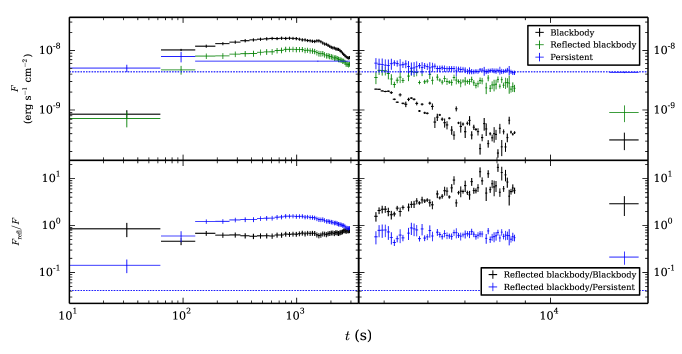
Figure 2 presents the unabsorbed flux of the different components and the ratio of the reflected blackbody flux with respect to the illuminating blackbody, which is a measure of the reflection fraction. We also include the ratio of the reflected blackbody and the persistent flux. The persistent flux is shown in the band, whereas the (reflected) blackbody flux is bolometric, but falls largely within the same band. Restricting the persistent flux to the band-pass gives a better representation of which component dominates the PCA spectra. Extrapolation to lower energies of the cutoff power law yields a bolometric correction factor of .
Whereas in the first orbit the in-band flux is dominated by the blackbody, in the second orbit the persistent flux is stronger. In the first orbit, the weighted mean of the ratio of the reflected and illuminating blackbody flux is . This ratio increases in the second orbit to (weighted mean in the last of the orbit). Furthermore, the reflected blackbody flux is a constant fraction of the in-band persistent flux in the second orbit of . If reflection were dominated by the persistent flux, would be over an order of magnitude larger than before the superburst (Section 3.2): much larger than the increase in during the superburst. We attempt to fit the spectra in that orbit while including a reflected cutoff power law (see also Section 3.2) instead of a reflected blackbody. The rest of the spectral model is the same, apart from an increase of the (fixed) blackbody normalization to account for the reflection fraction as measured in the first orbit. This does not provide a good description of the data, especially at later times where the blackbody flux is lowest (). Even though the cutoff power law is the brightest spectral component, the blackbody remains the dominant source of illumination for reflection.
3.2. Pre- and Post-Superburst Persistent Spectra
To characterize reflection outside of the superburst, we fit the persistent spectra in the RXTE orbits immediately before and after the superburst with an absorbed cutoff power-law and reflected cutoff power-law (see Ballantyne et al. 2012; grid extended for compatibility with the cutoffpl model). The two components share the photon index and cutoff energy. Smoothing by relativistic effects is applied to the reflection component as described in Section 3.1. The best fit parameters of the cutoff power-law component are within of those in the phenomenological fit (Keek et al., 2014), with the exception of the normalization, , due to the addition of the reflection component. The in-band flux ratio of the reflected and the illuminating cutoff power law is before and after the superburst. The material is mildly ionized with best fit value before and after the superburst. is not well constrained towards lower values, and points to the pegged values at the boundary of the domain. These values are consistent with those in the superburst tail (Section 3.1), although the latter was found to be dominated by reflected blackbody emission, and the uncertainties are rather large.
4. Discussion
Our analysis of the 2001 superburst from 4U 1636–536 reveals that the spectral features identified by Keek et al. (2014) are consistent with reflection of blackbody emission from the neutron star surface off the photoionized accretion disk. Although no other interpretations of the data were tested, we regard burst reflection as the most likely candidate, as it matches the strength of the emission line and absorption edge. For example, reflection of persistent emission is much weaker (Section 3.2; see also the discussion in Keek et al. 2014). Here we discuss the implications of the burst reflection interpretation.
4.1. Transition of Ionization State and Reflection Fraction
The ionization parameter, , decreases between the peak (the first orbit) and the tail (second half of the second orbit) of the superburst: . The blackbody fluxes (Figure 2) yield : a large part of can be explained by the decrease in the illuminating flux alone (Equation 1), whereas changes in the area and density of the reflector may account for the remainder. It does not, however, explain the non-smooth transition in (Section 3.1), which suggests that two reflection signals are present. The transition may signify a change in which component is brightest.
The decrease in is accompanied by a smooth ten-fold increase of the reflection fraction, which we define as the flux ratio of the reflected and the illuminating blackbody. When the reflection fraction increases, the reflected blackbody flux follows the same trend as the persistent flux (Figure 2). Both quantities may be driven by changes in the disk. Assuming an inclination angle of for 4U 1636–536 (e.g., Pandel et al., 2008), the predicted reflection fraction for a thin disk is (following Fujimoto, 1988), which may be increased by several tens of percent due to light bending (Lapidus & Sunyaev, 1985). The large observed reflection fractions of up to , require a thick disk that blocks part of the neutron star from the observer’s view (e.g., Blackman, 1999). The inner region of a thick disk may receive the bulk of the irradiation, and dominate the late-time reflection. At early times the superburst must, therefore, have induced a change in the inner disk. Perhaps the disk was flattened by radiation pressure (e.g., Lapidus & Sunyaev, 1985) or thinned by a strong wind (e.g., Ballantyne & Everett, 2005) around the superburst peak, and the geometry reverted to a thick disk when the burst flux dropped. Alternatively, X-ray heating could have decreased the density of the inner disk such that it is optically thin and does not reflect, or a part of the inner disk may be evacuated by winds or Poynting-Robertson drag (e.g., Ballantyne & Everett, 2005). Furthermore, for large values of reflection features disappear (e.g., Ballantyne, 2004), and part of the reflection flux may be indistinguishable from the illuminating blackbody in the PCA band, leading to an underestimation of the reflection fraction.
Any of these processes could shift the location that dominates the reflection spectrum to a region with a lower . Detailed numerical modeling is required to investigate the relative importance of each. In any case, at least two reflecting regions are required to explain the observed behavior, each with a different and reflection fraction.
4.2. Strongly Enhanced Local Absorption
The column density of photo-electric absorption, , is on average times larger during the superburst than the value outside of bursts (Pandel et al., 2008). This suggests that in addition to interstellar absorption, a strong local absorber developed during the superburst. Alternative models of local absorption describe the data equally well, including a photoionized absorption model created using XSTAR (Kallman & Bautista, 2001) and a model with partial covering. As most absorption must take place below the PCA’s band-pass, the data do not discriminate between different models. Although the precise values are model dependent, they must be large to have a noticeable effect within the considered energy band.
Alternatively, Boutloukos et al. (2010) suggested that, instead of a blackbody, the spectra of a superburst are better described by a Bose-Einstein distribution, which is identical to a blackbody with a deficit at low energies. The observed spectra do not discriminate between this model and strong local absorption.
4.3. Comparison to 4U 1820–30’s Superburst
Much of the observed behavior is qualitatively similar to the 1999 superburst from 4U 1820–30 (Strohmayer & Brown, 2002; Ballantyne & Strohmayer, 2004). Both sources are at a similar distance — for 4U 1636–536 (Galloway et al., 2008) and for 4U 1820–30 (Vacca et al., 1986; Ballantyne & Everett, 2005) — and both superbursts were observed with PCUs. 4U 1820–30’s superburst, however, was intrinsically brighter, as it reached the Eddington limit. The brightness of the reflection signal combined with the helium-rich disk of 4U 1820–30 produced a stronger Fe K line, and the width of the line was used to measure the location on the disk where reflection originated. This measurement is not possible for 4U 1636–536, where we have no direct constraints on the location of the reflecting surface. Conversely, as the blackbody is less bright for 4U 1636–536, the evolution of the persistent spectral component can be traced during its superburst (Keek et al., 2014), which was not possible for 4U 1820–30 (Strohmayer & Brown, 2002).
Despite the fact that for 4U 1636–536 the peak luminosity is only of the value for 4U 1820–30, the ionization transition occurs for both sources on a timescale of : around for 4U 1636–536, and for 4U 1820–30 at . Evacuation of the inner disk is expected to take place on a dynamical timescale that is unresolved by our analysis. If present, the effect is smaller for 4U 1636–536, as its luminosity at the superburst onset is lower. Processes that take place on a timescale of are likely viscous in nature. For example, puffing-up of the accretion disk by X-ray heating was a favored mechanism for 4U 1820–30 (Ballantyne & Everett, 2005). As no strong correlation of reflection and illumination parameters are apparent, the timescale of the evolution of the reflection features appear less dependent on the brightness of the superburst, and more on innate viscous processes of the accretion disk.
Both superbursts exhibited a similar increase in . 4U 1820–30 reached the Eddington limit, and a strong wind from the neutron star surface or from the irradiated disk could have formed the absorbing material (Ballantyne & Everett, 2005). It is interesting that the weaker superburst from 4U 1636–536 could have produced an absorber with an of similar magnitude. For both superbursts remained high in the tail of the superburst, long after the blackbody flux peaked, indicating a long-lived effect.
5. Conclusions
We have shown that the features identified in the spectra of the 2001 superburst from 4U 1636–536 (Keek et al., 2014) are consistent with reflection of the superburst off the photoionized accretion disk. This is only the second superburst for which this could be detected, and shows that much of the behavior is also present in a superburst of typical brightness, as opposed to the particularly powerful superburst from 4U 1820–30 (Ballantyne & Strohmayer, 2004). Our spectral fits suggest that initially reflection occurs off a highly ionized part of the disk at a larger radius, and transitions in the tail to reflection off the disk’s inner region when its ionization state is lower. The evolution of the reflecting regions depends on how the intense X-ray irradiation changes the disk’s geometry and ionization profile with time, and it will require numerical modeling to investigate in detail. Similar and improved observations of superburst spectra depend on future missions with large collecting areas such as NICER (Gendreau et al., 2012) and LOFT (Feroci et al., 2014). The substantial and evolving contribution of reflection to the spectrum that we observe for superbursts, may also be important for the interpretation of short Type I X-ray bursts. Their spectra are employed to constrain the neutron star equation of state, but in many cases a changing accretion environment is suspected to interfere with these measurements (e.g., Poutanen et al., 2014). Future instruments can use reflection to trace such changes, and accurately measure the neutron star mass and radius.
References
- Arnaud (1996) Arnaud, K. A. 1996, in ASP Conf. Ser. 101: Astronomical Data Analysis Software and Systems V, ed. G. H. Jacoby & J. Barnes, 17
- Ballantyne (2004) Ballantyne, D. R. 2004, MNRAS, 351, 57
- Ballantyne & Everett (2005) Ballantyne, D. R., & Everett, J. E. 2005, ApJ, 626, 364
- Ballantyne et al. (2012) Ballantyne, D. R., Purvis, J. D., Strausbaugh, R. G., & Hickox, R. C. 2012, ApJ, 747, L35
- Ballantyne & Strohmayer (2004) Ballantyne, D. R., & Strohmayer, T. E. 2004, ApJ, 602, L105
- Blackman (1999) Blackman, E. G. 1999, MNRAS, 306, L25
- Boutloukos et al. (2010) Boutloukos, S., Miller, M. C., & Lamb, F. K. 2010, ApJ, 720, L15
- Bradt et al. (1993) Bradt, H. V., Rothschild, R. E., & Swank, J. H. 1993, A&AS, 97, 355
- Casares et al. (2006) Casares, J., Cornelisse, R., Steeghs, D., et al. 2006, MNRAS, 373, 1235
- Cornelisse et al. (2000) Cornelisse, R., Heise, J., Kuulkers, E., Verbunt, F., & in ’t Zand, J. J. M. 2000, A&A, 357, L21
- Cumming & Bildsten (2001) Cumming, A., & Bildsten, L. 2001, ApJ, 559, L127
- Fabian et al. (1989) Fabian, A. C., Rees, M. J., Stella, L., & White, N. E. 1989, MNRAS, 238, 729
- Feroci et al. (2014) Feroci, M., den Herder, J. W., Bozzo, E., et al. 2014, in Space Telescopes and Instrumentation 2014: Ultraviolet to Gamma Ray, ed. T. Takahashi, J.-W. A. den Herder, & M. Bautz, Vol. 9144, 91442T
- Fujimoto (1988) Fujimoto, M. Y. 1988, ApJ, 324, 995
- Galloway et al. (2008) Galloway, D. K., Muno, M. P., Hartman, J. M., Psaltis, D., & Chakrabarty, D. 2008, ApJS, 179, 360
- García et al. (2013) García, J., Dauser, T., Reynolds, C. S., et al. 2013, ApJ, 768, 146
- Gendreau et al. (2012) Gendreau, K. C., Arzoumanian, Z., & Okajima, T. 2012, in Society of Photo-Optical Instrumentation Engineers (SPIE) Conference Series, Vol. 8443
- Jahoda et al. (2006) Jahoda, K., Markwardt, C. B., Radeva, Y., et al. 2006, ApJS, 163, 401
- Kallman & Bautista (2001) Kallman, T., & Bautista, M. 2001, ApJS, 133, 221
- Keek et al. (2014) Keek, L., Ballantyne, D. R., Kuulkers, E., & Strohmayer, T. E. 2014, ApJ, 789, 121
- Kuulkers et al. (2004) Kuulkers, E., in ’t Zand, J., Homan, J., et al. 2004, in AIP Conf. Proc. 714: X-ray Timing 2003: Rossi and Beyond, 257–260
- Lapidus & Sunyaev (1985) Lapidus, I. I., & Sunyaev, R. A. 1985, MNRAS, 217, 291
- Lewin et al. (1993) Lewin, W. H. G., van Paradijs, J., & Taam, R. E. 1993, Space Science Reviews, 62, 223
- Pandel et al. (2008) Pandel, D., Kaaret, P., & Corbel, S. 2008, ApJ, 688, 1288
- Pedersen et al. (1981) Pedersen, H., van Paradijs, J., & Lewin, W. H. G. 1981, Nature, 294, 725
- Poutanen et al. (2014) Poutanen, J., Nättilä, J., Kajava, J. J. E., et al. 2014, MNRAS, 442, 3777
- Strohmayer & Bildsten (2006) Strohmayer, T., & Bildsten, L. 2006, New views of thermonuclear bursts (Compact stellar X-ray sources), 113–156
- Strohmayer & Brown (2002) Strohmayer, T. E., & Brown, E. F. 2002, ApJ, 566, 1045
- Strohmayer & Markwardt (2002) Strohmayer, T. E., & Markwardt, C. B. 2002, ApJ, 577, 337
- Vacca et al. (1986) Vacca, W. D., Lewin, W. H. G., & van Paradijs, J. 1986, MNRAS, 220, 339