Anisotropic model for the fabrication of Annealed and Reverse Proton Exchanged waveguides in congruent Lithium Niobate
Francesco Lenzini, Sachin Kasture, Ben Haylock,
and Mirko Lobino∗
Centre for Quantum Dynamics, Griffith University, Brisbane, QLD, Australia
and
Queensland Micro- and Nanotechnology Centre, Griffith University, Brisbane, QLD, Australia
∗m.lobino@griffith.edu.au
Abstract
An anisotropic model for the fabrication of annealed and reverse proton exchange waveguides in lithium niobate is presented. We characterized the anisotropic diffusion properties of proton exchange, annealing and reverse proton exchange in Z-cut and X-cut substrates using planar waveguides. Using this model we fabricated high quality channel waveguides with propagation losses as low as 0.086 dB/cm and a coupling efficiency with optical fiber of 90% at 1550 nm. The splitting ratio of a set of directional couplers is predicted with an accuracy of 0.06.
OCIS codes: (130.3130) Integrated optics materials; (230.7370) Waveguides.
References and links
- [1] E. Wooten, K. Kissa, A. Yi-Yan, E. Murphy, D. Lafaw, P. Hallemeier, D. Maack, D. Attanasio, D. Fritz, G. McBrien, and D. Bossi, “A review of lithium niobate modulators for fiber-optic communications systems,” IEEE J. Sel. Top. Quant. 6, 69–82 (2000).
- [2] B. Thomsen, D. Reid, R. Watts, L. Barry, and J. Harvey, “Characterization of 40-gbit/s pulses generated using a lithium niobate modulator at 1550 nm using frequency resolved optical gating,” IEEE T. Instrum. Meas. 53, 186–191 (2004).
- [3] S. Longhi, M. Marangoni, M. Lobino, R. Ramponi, P. Laporta, E. Cianci, and V. Foglietti, “Observation of dynamic localization in periodically curved waveguide arrays,” Phys. Rev. Lett. 96, 243901 (2006).
- [4] S. Longhi, M. Lobino, M. Marangoni, R. Ramponi, P. Laporta, E. Cianci, and V. Foglietti, “Semiclassical motion of a multiband bloch particle in a time-dependent field: Optical visualization,” Phys. Rev. B 74, 155116 (2006).
- [5] S. Tanzilli, H. de Riedmatten, H. Tittel, H. Zbinden, P. Baldi, M. De Micheli, D. B. Ostrowsky, and N. Gisin, “Highly efficient photon-pair source using periodically poled lithium niobate waveguide,” Electron. Lett. 37, 26–28 (2001).
- [6] D. Bonneau, M. Lobino, P. Jiang, C. M. Natarajan, M. G. Tanner, R. H. Hadfield, S. N. Dorenbos, V. Zwiller, M. G. Thompson, and J. L. O’Brien, “Fast path and polarization manipulation of telecom wavelength single photons in lithium niobate waveguide devices,” Phys. Rev. Lett. 108, 053601 (2012).
- [7] P. Zhang, K. Aungskunsiri, E. Martín-López, J. Wabnig, M. Lobino, R. W. Nock, J. Munns, D. Bonneau, P. Jiang, H. W. Li, A. Laing, J. G. Rarity, A. O. Niskanen, M. G. Thompson, and J. L. O’Brien, “Reference-frame-independent quantum-key-distribution server with a telecom tether for an on-chip client,” Phys. Rev. Lett. 112, 130501 (2014).
- [8] R. V. Schmidt and I. P. Kaminow, “Metal-diffused optical waveguides in ,” Appl. Phys. Lett. 25, 458–460 (1974).
- [9] Y. N. Korkishko, V. A. Fedorov, T. M. Morozova, F. Caccavale, F. Gonella, and F. Segato, “Reverse proton exchange for buried waveguides in ,” J. Opt. Soc. Am. A 15, 1838–1842 (1998).
- [10] P. Ganguly, D. C. Sen, S. Datt, J. C. Biswas, and S. K. Lahiri, “Simulation of refractive index profiles for titanium indiffused lithium niobate channel waveguides,” Fiber Integrated Opt. 15, 135–147 (1996).
- [11] Y. N. Korkishko and V. A. Fedorov, “Relationship between refractive indices and hydrogen concentration in proton exchanged waveguides,” J. Appl. Phys. 82, 1010–1017 (1997).
- [12] K. R. Parameswaran, R. K. Route, J. R. Kurz, R. V. Roussev, M. M. Fejer, and M. Fujimura, “Highly efficient second-harmonic generation in buried waveguides formed by annealed and reverse proton exchange in periodically poled lithium niobate,” Opt. Lett. 27, 179–181 (2002).
- [13] M. L. Bortz and M. M. Fejer, “Annealed proton-exchanged waveguides,” Opt. Lett. 16, 1844–1846 (1991).
- [14] R. Roussev, X. Xie, K. Parameswaran, and M. Fejer, “Accurate semi-empirical model for annealed proton exchanged waveguides in z-cut lithium niobate,” in “Lasers and Electro-Optics Society, 2003. LEOS 2003. The 16th Annual Meeting of the IEEE,” , vol. 1 (2003), vol. 1, pp. 338–339.
- [15] R. V. Roussev, “Optical frequency mixers in periodically poled lithium niobate: materials, modeling and characterization,” Ph.D. thesis, Stanford University (2006).
- [16] P. K. Tien and R. Ulrich, “Theory of prism-film coupler and thin-film light guides,” J. Opt. Soc. Am. 60, 1325–1337 (1970).
- [17] G. Edwards and M. Lawrence, “A temperature-dependent dispersion equation for congruently grown lithium niobate,” Opt. Quant. Electron. 16, 373–375 (1984).
- [18] J. M. Zavada, H. C. Casey, C.-H. Chen, and A. Loni, “Correlation of refractive index profiles with substitutional hydrogen concentrations in annealed proton-exchanged linbo3 waveguides,” Appl. Phys. Lett. 62, 2769–2771 (1993).
- [19] Y. N. Korkishko and V. A. Fedorov, Ion Exchange in Single Crystals for Integrated Optics and Optoelectronics (Cambridge International Science Publishing, 1999).
- [20] S. T. Vohra, A. R. Mickelson, and S. E. Asher, “Diffusion characteristics and waveguiding properties of proton-exchanged and annealed channel waveguides,” J. Appl. Phys. 66, 5161–5174 (1989).
- [21] J. Weickert, B. Romeny, and M. Viergever, “Efficient and reliable schemes for nonlinear diffusion filtering,” IEEE T. Imag. Process. 7, 398–410 (1998).
- [22] J. Jackel and J. Johnson, “Reverse exchange method for burying proton exchanged waveguides,” Electron. Lett. 27, 1360–1361 (1991).
1 Introduction
Lithium niobate (LN) is one of the most widely used materials for the fabrication of integrated optical devices because of its high nonlinearity and large electro-optic coefficient for fast switching [1]. High speed modulators in LN have been standard components of optical telecommunication networks for decades [2] and more recently LN integrated optical devices have been used for the optical simulation of solid state systems [3, 4] and for quantum optics experiments including the generation [5] and manipulation [6] of single photons and the demonstration of a compact quantum-key-distribution system [7].
LN waveguides are fabricated mainly by two techniques: titanium indiffusion (Ti-indiffusion) [8] and proton exchange (either annealed (APE) or reverse (RPE) proton exchange) [9]. Ti-indiffused waveguides are fabricated through the deposition of a few nanometer thick Ti layer on top of the material followed by annealing at T1000 ∘C in a furnace. This is the standard technique used for commercial modulators and Ti indiffusion has been well characterised and reliably modeled [10]. For annealed (APE) and reverse (RPE) proton exchange waveguides, the core is fabricated by replacing lithium ions (Li+) with hydrogen ions (H+) by dipping the sample in a hot acid bath: this substitution increases the extraordinary refractive index and decreases the ordinary one [11]. In APE waveguides a subsequent annealing step in air is performed to reduce the H+ concentration and improve the optical properties of the waveguide. After proton exchange and annealing a third step of RPE is used to bury the waveguide under the crystal surface and increase the circular symmetry of the optical mode. The main difference between the two techniques is that Ti-indiffused devices guide both polarizations while APE and RPE waveguides guide only light polarized along the optical axis of the crystal.
APE and RPE waveguides have excellent optical properties and they have been used for a broad range of applications in classical and quantum optics including the demonstration of the highest conversion efficiency for second harmonic generation at 1550 nm reported to date [12] and the brightest single photon source based on parametric down conversion ever reported [5]. Nonlinear diffusion models have been proposed for APE [13] and RPE [14, 15] processes. The main limitations of these models are the assumptions that the diffusion of H+ ions in the crystal is isotropic even if the crystal is not and that the refractive index changes linearly with H+ concentration across all the different crystallographic phases [9].
In this paper we report a model of the anisotropic diffusion processes involved in the fabrication of APE and RPE waveguides by studying the H+ diffusion on Z-cut and X-cut substrates. Using this model we derive a relation between proton concentration and refractive index changes as a function of the wavelength when this change is in the -phase ( 0.025 at 633 nm). This is the phase where the propagation losses of the waveguides are minimized and where the relation of the H+ concentration with the ordinary and extraordinary refractive index changes, , is linear. We verify the validity of our model with the design and fabrication of channel waveguides and directional couplers for which the anisotropy in the diffusion is particularly critical.
The paper is divided into three more sections: the model of the APE and RPE fabrication steps are described in section 2 for X-cut and Z-cut substrates, in section 3 we compare the prediction of model with the experimental results through the design and fabrication of channel waveguides and directional couplers and section 4 is the conclusion.
2 Modelling of the refractive index profile evolution in APE and RPE planar waveguides on X-cut and Z-cut substrates
Lithium niobate is a uniaxial crystal whose optical axis is commonly referred to as the Z axis. In order to characterize the diffusion parameters of APE and RPE processes parallel and orthogonal to this direction we fabricated several planar waveguides on X-cut and Z-cut substrates. The effective refractive indices of the guided modes were measured using the prism coupling technique [16] with a precision of 0.0001 set by the 0.005∘ angular resolution of our set-up. The optimal diffusion parameters were estimated by minimizing the root-mean-square (rms) error between the measured and those calculated using the nonlinear diffusion model for H+ in LN. For the extraordinary and ordinary refractive indices of bulk LN we used dispersion curves given in [17] at a temperature =22 ∘C.
Only the the extraordinary refractive index increases during proton exchange while the ordinary index decreases. For this reason APE and RPE waveguides guide only one polarization which is TM mode for a Z-cut substrate and TE for X-cut. Nevertheless the ordinary refractive index change was taken into account for the calculation of the modes in Z-cut waveguides [11].
2.1 Proton exchange
Proton exchange (PE) was performed by dipping the LN sample in a pure benzoic acid bath heated to 168.5 ∘C. Temperature uniformity is critical for the homogeneity of the fabrication of multiple devices on a single substrate. Our PE reactor is a custom made oil-based heating mantle with internal stirring to improve uniformity.
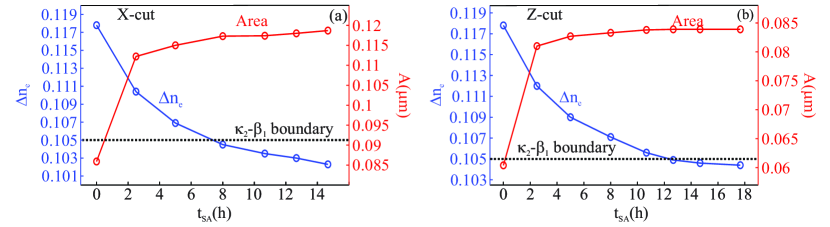
After PE the samples have a superficial layer at higher refractive index loaded with H+ ions. The guiding layer is formed by different crystallographic phases, with a portion of the protons occupying interstitial sites not contributing to an increase in the refractive index [11, 15, 18]. A soft annealing (SA) step in air at T=210 ∘C follows the PE causing the movement of the interstitial H+ ions to active substitutional sites with a consequent increase in the area of the refractive index profile. The area is calculated assuming a step-like refractive index profile of depth and index change . Figure 1 shows the evolution of the areas and of the refractive index changes, , with SA time for X-cut and Z-cut planar waveguides that were proton exchanged for 3 h. After each SA step the of the modes were measured by prism coupling and the values of and was retrieved using the inverse-WKB method. For both samples there is a fast increase of in the first hours of SA until it saturates to a constant value: this indicates that all interstitial H+ have moved to active substitutional sites. For the Z-cut sample the index change starts to decrease very slowly when reaches the boundary between the and phase corresponding to values below at =635 nm [19]. While for Z-cut samples soft annealing acts as a self-stopping process [14, 15], for X-cut the diffusion proceeds much faster and the values of shown by the last three data points of Fig. 1(a) clearly indicates that the crystal is entering in the phase, where a different relation between proton concentration and has to be employed.
In our fabrication we stop the SA when the refractive index change, , reaches the boundary between and at . Assuming a linear diffusion model for PE, the SA time and the PE time are proportional and given by [14, 15]:
| (1) |
| (2) |
Equations (1) and (2) are valid for a large interval of PE times, ranging from to around . For Z-cut samples, when PE time was larger than 10 h the temperature for SA was increased to a maximum of 230 ∘C and the new SA time calculated as:
| (3) |
where is the new temperature of choice for SA, is the temperature used for deriving relations (1)-(2), is the Boltzmann constant, and is the activation energy in the phase [15].
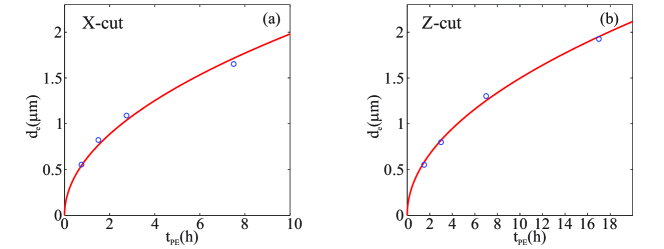
Relations (1)-(3) have been used to estimate the evolution of the waveguide depth with PE time with ranging from 0.5 m to 2 m. Figure 2 shows the measured evolution of with PE time for X-cut and Z-cut waveguides fitted with the linear diffusion law [19]. From our measurement we found that the diffusion coefficients for the two different substrates are:
| (4) |
| (5) |
2.2 Annealing
Proton exchanged waveguides have high propagation losses and a second order susceptibility almost totally suppressed [19]. Annealing in dry atmosphere at a temperature of 328 ∘C is performed to decrease the local H+ concentration, , and improve the optical properties of the waveguide in terms of propagation losses, second order nonlinearity and coupling with optical fiber.
The step-like refractive index profile obtained after PE and SA is the initial condition for modelling the annealing diffusion. The proton concentration is set to =1 for and to 0 for with indicating the direction orthogonal to the air-LN interface. The kinetics of H+ ions in X-cut and Z-cut planar waveguides are modelled by the one-dimensional nonlinear diffusion equation
| X-cut | Z-cut | ||||||
|---|---|---|---|---|---|---|---|
| (m2/h) | 0.334 | A | 5.063e-3 | (m2/h) | 0.414 | A | 4.646e-3 |
| 0.116 | B | 1.294e-3 | 0.134 | B | 9.632e-4 | ||
| 30.7 | C(m) | 0.217 | 34.5 | C(m) | 0.272 | ||
| 0.00711 | 0.0497 | ||||||
For , the rational form of is the same that would be obtained by a simple inter-diffusion model for and ions after the requirement of an electroneutrality condition [20]. The additional term acts as an empirical correcting factor taking into account the different values of the self diffusion coefficients of the two ion species in each phase encountered during annealing and RPE in a multiphase crystal. When the waveguide is in the -phase the refractive index change is proportional to and given by . We independently characterize the coefficient for the two substrates because the stresses experienced by the crystal during the high temperature diffusion processes are different for Z-cut and X-cut waveguides and this may affect the final value of [11].
Equation (6) is integrated using a semi-implicit finite difference algorithm [21] with and . The boundary conditions are at , meaning that there is no H+ flux at the LN-air interface, and for we used a transparent boundary condition in order to simulate an infinitely thick substrate. This is necessary in order to avoid the use of large integration window since for large the refractive index profiles have a long tail that extends for tens of microns.
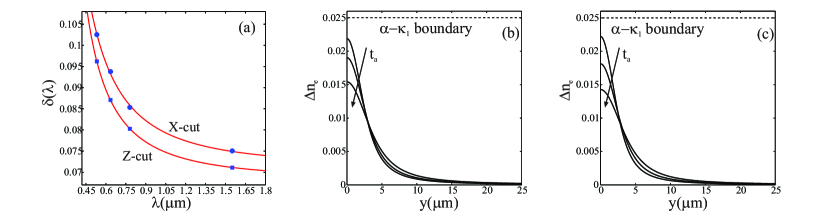
We fabricated several planar waveguides on the two different substrates with proton exchange depth ranging from 0.5 m to 2 m and monitored their evolution during annealing by measuring the of the modes. The values of the parameters and were determined by minimizing the root-mean-square error between the measured effective indices, , and the ones calculated with a mode solver and the refractive index profile obtained from Eq. (6), . The wavelength dependence of was determined by interpolating the data acquired at the wavelengths 1550 nm, 780 nm, 635 nm and 532 nm with the one pole Sellmeier equation .
| X-cut | Z-cut | ||
|---|---|---|---|
| (h) | (h) | ||
| 36 | 0.6 | 25 | 1.4 |
| 44 | 1.8 | 34 | 1.0 |
| 59 | 1.2 | 48 | 1.6 |
Table 1 shows the parameters of the diffusion and the coefficients of the Sellmeier equations obtained from the minimization of the rms error .
The Sellmeier curves are shown in Fig. 3(a), while Fig. 3(b) and (c) show the evolution of the refractive index profile during annealing for an X-cut with a PE depth = 0.822 m and a Z-cut waveguide with = 0.798 m. Table 2 shows the values of the rms error of the model for these two waveguides characterised by the first four guided modes at =635 nm.
2.3 Reverse Proton exchange
The asymmetry in the refractive index profile of APE waveguides (see Fig.3(b),(c)) generates an asymmetry in the intensity profile of the guided modes that reduces the coupling efficiency with optical fibre and the mode overlap in frequency conversion processes. Furthermore the modes of APE waveguides overlap with the PE dead layer which has suppressed nonlinearity. This problem is overcome with RPE which buries the waveguides through the back substitution of for at the surface of the crystal.
Reverse Proton Exchange is performed after annealing by dipping the sample in an eutectic melt of (mole percent ratio of ) at a temperature of [22]. During this process the H+ near the LN surface are removed while the other protons are annealed deeper into the substrate.
| X-cut | Z-cut | ||
|---|---|---|---|
| (h) | (h) | ||
| 8 | 2.8 | 10.8 | 2.6 |
| 11.5 | 1.9 | 15.6 | 1.7 |
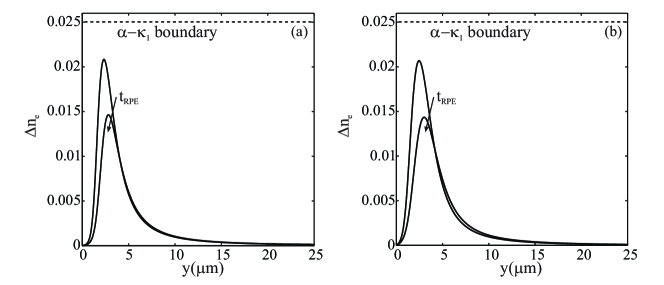
The process is modelled using Eq. (6) with changed boundary condition at . In this way we model the eutectic melt as a perfectly absorbing layer placed at the top surface. The parameter , that controls the value of the diffusion coefficient for , plays a central role in determining the rate of the RPE process. In fact this rate is mainly affected by the diffusion properties of the protons at the top surface of the crystal, that have concentration values approaching zero. For this reason the values of reported in Tab. 1 are obtained through minimization of the RPE data keeping fixed the value of the other parameters obtained by the APE characterization.
Figure 4 shows the evolution of the refractive index profile during RPE for X-cut and Z-cut substrates and the rms in the calculation of the for these profiles is given in Tab. 3. Reverse exchange moves the peak of the profile below the LN surface causing an improvement in the symmetry of the mode, a reduction in the surface scattering component of the propagation losses and a pulling of the mode away from dead-layer on the surface that is created after PE.
3 Design and fabrication of channel waveguides
We applied this model for the design and fabrication of straight channel waveguide and directional couplers on a Z-cut substrate. The design constraints were: good coupling with optical fiber, waveguide in the -phase, single mode operation at 1550 nm and low propagation losses.
The fabrication parameters were determined by solving the diffusion equation
| (8) |
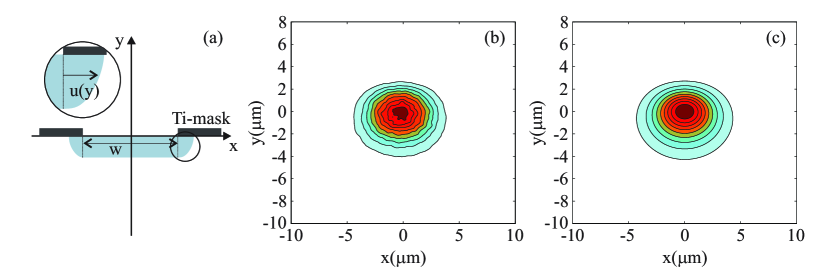
with the diffusion coefficients obtained in section 2 for annealing and RPE and maximizing our fabrication constraints. The initial condition for the annealing diffusion is the step-like refractive index profile shown in Fig. 5(a) where the shaded region has a proton concentration . The waveguides were fabricated by patterning a titanium mask on a LN wafer by standard photolithography with a channel width of the waveguides, =8 m. The undercut diffusion of proton during PE is modelled by the empirical formula with (see inset in Fig. 5(a)).
After our analysis we fabricated the devices using a proton exchange depth =1.75 m, annealing time =26 h and reverse time =14.5 h. Figure 5(b) shows the intensity profile of the waveguide output mode at 1550 nm while Fig 5(c) is the mode profile predicted by our model. The overlap between measured and calculated mode is 96% and overlap between the measured fiber and waveguide modes is 90% which is in accordance with the 90.5% prediction from our model. The insertion losses for a 2.8 cm long waveguide were 1.39 dB which account for dB per facet of coupling and Fresnel losses and dB/cm propagation losses.
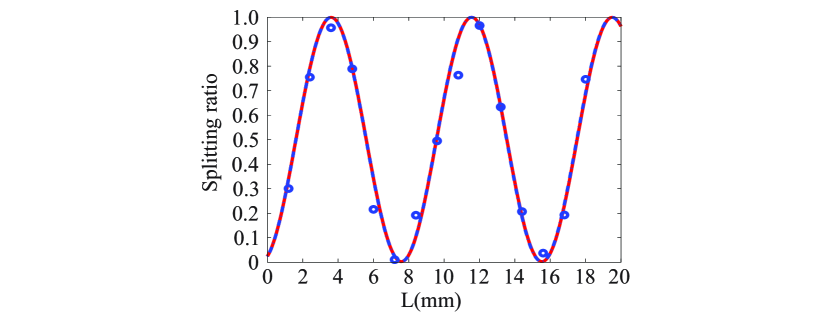
A set of 15 directional couplers with coupling lengths ranging from 1.2 mm to 18 mm were fabricated with the same parameters as the straight waveguide and a separation of 13.5 m between the centres of the waveguide in the coupling region. The anisotropy of the diffusion is critical for the modeling of this devices because the lateral diffusion of H+ plays a crucial role in the effective coupling between the waveguides. Figure 6 shows the measured splitting ratios as a function of the coupling length: the data is plotted along with the a sine square fitting function, which gives a coupling length = 3.9730.09 mm compared to the estimated value of = 3.976 mm also shown in Fig. 6. The comparison between measured and simulated splitting ratio has a rms error of 0.06.
4 Conclusions
In conclusion we have derived a simple and reliable model of the anisotropic diffusion for the fabrication of APE and RPE waveguide in LN. The model was tested with the design and fabrication of straight waveguides and directional couplers with good agreement between measured and calculated quantities. This model will provide a useful tool for the design and optimization of complex integrated optical devices in LN.
Acknowledgments
This work was supported by the Australian Research Council (ARC) under the Grants DP140100808. ML acknowledges the support of the ARC-Decra DE130100304. This work was performed in part at the Griffith node of the Australian National Fabrication Facility. A company established under the National Collaborative Research Infrastructure Strategy to provide nano and microfabrication facilities for Australia’s researchers.