Demixing and confinement in slit pores
Abstract
Using Monte Carlo simulation, we study the influence of geometric confinement on demixing for a series of symmetric non-additive hard spheres mixtures confined in slit pores. We consider both a wide range of positive non-additivities and a series of pore widths, ranging from the pure two dimensional limit to a large pore width where results are close to the bulk three dimensional case. Critical parameters are extracted by means of finite size analysis. We find that for this particular case in which demixing is induced by volume effects, phase separation is in most cases somewhat impeded by spatial confinement. However, a non-monotonous dependence of the critical pressure and density with pore size is found for small non-additivities. In this latter case, it turns out that an otherwise stable bulk mixture can be forced to demix by simple geometric confinement when the pore width decreases down to approximately one and a half molecular diameters.
pacs:
05.70.Jk,64.75.Cd,65.20.DeI Introduction
Phase separation under confinement has been for decades a topic of primary interest both from the technological and fundamental science standpointsGelb et al. (1999). It is obvious that the reduction in the number of neighbors of those molecules adjacent to the pore walls will induce important phase diagram shifts, whose character will be mostly dependent on the nature of the wall-fluid (or wall-adsorbate) interaction. In the limit of plain two dimensional confinement the system will exhibit bidimensional criticality, which is essentially different -e.g. as critical indices are concerned- from its bulk three dimensional counterpartBinney et al. (1993). We assume that this bidimensional criticality also holds for the different levels of confinement studied in this work.Binder (1992)
Many new and interesting effects can be induced by confining and the interplay between adsorbate-adsorbate and adsorbate-pore wall forces. Very recently, Severin and coworkersSeverin et al. (2014) found evidence of a microphase separation in an otherwise fully miscible mixture of ethanol and water when adsorbed in a slit pore formed by a graphene layer deposited on a mica wall. Of utmost interest are also the effects that confinement have on enhancing or preempting crystallization of undercooled fluidsHung et al. (2005); Alba-Simionesco et al. (2006). This has been a key approach in the attempts to throw some light in the search for the elusive liquid-liquid critical point in undercooled waterBiddle et al. (2014), resorting to the preemption of crystallization induced by tight confinement of water in nanoporesChen et al. (2006); Bertrand et al. (2012) and extensive use of diffraction experiments in combination with computer simulations. Not long ago, Fortini and DijsktraFortini and Dijkstra (2006) explored the possibility of manipulating colloidal crystal structures by confinement in slit pores. In contrast, thorough studies on the influence of tunable confinement on demixing transitions are scarceDuda et al. (2003). One of the simplest systems that illustrate demixing in binary mixtures is the non-additive hard sphere system (NAHS) with positive non-additivity, of which the limiting case of the Widom-Rowlinson modelWidom and Rowlinson (1970) has deserved particular theoretical attention and prompted the development of specially adapted algorithms to cope with the hard-core singularities and critical slowing down of the demixing transitionJohnson et al. (1997). More general instances of the non-additive hard sphere mixture problem (mostly in the symmetric case) have been studied in the two-dimensional limitSaija and Giaquinta (2002), and in a number of detailed studies in three dimensionsLomba et al. (1996); Góźdź (2003); Jagannathan and Yethiraj (2003); Buhot (2005).
In this work, we intend to explore thoroughly the demixing transition of the symmetric non-additive hard sphere mixture under confinement in a slit pore by means of computer simulation.
The model defined as mixture of A and B components, is characterized by an interaction of the type
| (1) |
where denote the A and B species, is Kronecker’s delta, the non-additivity parameter is , and is the interparticle separation.
We will study a series of confined non-additive hard sphere mixtures (for various values) using extensive semi-grand ensemble Monte Carlo simulationsKofke and Glandt (1988); Frenkel and Smit (2002); Góźdź (2003). The effects of geometric confinement are modeled by the presence of hard-core walls, separated by a distance, , that constrain the particle movement in one space direction (along the -axis as defined here). The fluid particle with thus be subject to an external potential of the form
| (2) |
This aims at reproducing the behavior of a fluid confined in a slit pore. Since all interactions at play are purely hard-core, the demixing transition will result from the interplay of entropic and enthalpic (i.e. excluded volume) effects. Our calculations range from the pure two dimensional limit to a relatively large pore width (, approaching the bulk three dimensional mixture). We have taken advantage of the particular nature of the interaction to implement cluster algorithmsSwendsen and Wang (1987); Wolff (1989); Buhot (2005) in order to cope with the critical slowing down when approaching the consolute point. Finite size scaling techniques have been applied in order to provide accurate estimates of the critical pointsGóźdź (2003). These systems were previously studied by Duda et al.Duda et al. (2003) by means of mean-field theory and Monte Carlo simulations, considering two values of the slit width, , and different values of . In most of the cases they simulate just one system size, corresponding to a number of particles . Here we will perform a comprehensive analysis of the phase diagram for different values of , and . In addition, for each case several values of will be considered, which will allow us to get more reliable estimates of the phase diagram of these systems, and in particular of the critical points.
The rest of the paper is sketched as follows: in the next section we briefly summarize the computer simulation techniques we have used, and our main results are presented together with conclusions and future prospects in Section III.
II Methodology
Given the particular symmetry of our model, the most appropriate simulation approach to study the phase equilibria is the use of semi-grand canonical Monte Carlo (MC) simulations Kofke and Glandt (1988); Frenkel and Smit (2002); Góźdź (2003). We impose the difference between the chemical potentials of the two components , the volume , the temperature and keep the total number of particles, fixed; is the concentration of particle species A. The total number density is thus fixed. In addition to the conventional MC moves, particles can also modify their identity (i.e. the species to which they belong)Lomba et al. (1996). The identity sampling can be performed through an efficient cluster algorithm that involves all the particles in the systems and that will be presented later in the paper. After MC sweeps for equilibration, our simulations were typically extended over MC sweeps to perform averages. A sweep involves single-particle translation attempts, and one cluster move. Note that due to symmetry the critical mole fraction of component (and ) will be , and the demixing transition will occur at . When demixing occurs, the mole fraction, of the components in the two phases, are computed through the ensemble averages of the order parameter
| (3) |
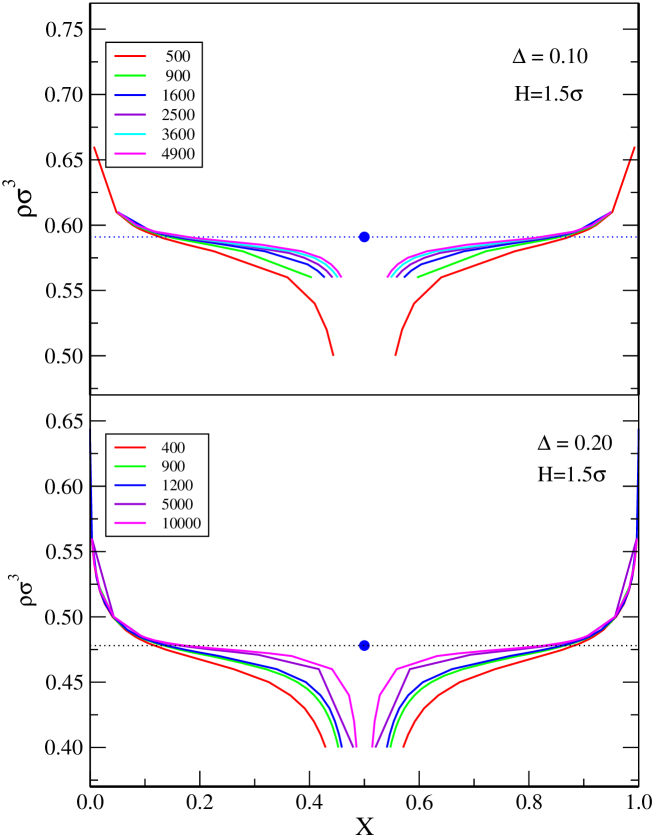
as . Given the symmetry of the model and the efficiency of the cluster algorithm, the average of from the simulations at will be , independently of the presence or absence of demixing at the simulation conditions. By analysis of the mole fraction histograms for a series of binary mixtures at different total densities, , one can obtain a series of phase diagrams for each sample size, as illustrated in Figure 1, where the extreme size dependence of the results on the sample size in the neighborhood of the critical point can be readily appreciated.
It is well known that as the critical point is approached, larger samples are needed, correlations become long ranged and critical slowing down must be dealt with somehow. To that aim we have complemented single particle moves with cluster movesSwendsen and Wang (1987); Wolff (1989); Buhot (2005) following the Swendseng-Wang strategySwendsen and Wang (1987). Two particles of the same species are considered linked within the same cluster when their separation is less than . Note that due to the linking criteria and the hard-core interactions all the particles belonging to a given cluster are of the same species, and two particles lying at a distance below are necessarily included in the same cluster. As a consequence, cluster identity swaps do not lead to particle overlaps, and for the symmetric case, , the procedure leads to a rejection-free algorithm of composition sampling for a fixed set of particle positions. This algorithm rests on two key elements: (1) Clusters are built following the rules defined above, and (2) For each cluster one of the two possible identities ( or ) is independently chosen with equal probabilities. Along the simulations the fraction of configurations containing percolating clusters is monitored as an additional signal of the presence of a phase transitionStauffer and Aharony (2003).
Another issue that has to be addressed is the calculation of the pressure in the confined system with discontinuous interactions. The scheme proposed by de Miguel and JacksonMiguel and Jackson (2006) and further exploited for the Widom-Rowlinson mixture in Reference de Miguel et al., 2007 turns out to be the simplest approach in the present case. In order to estimate the pressure, we perform virtual compressions of the system (both in the direction –orthogonal to the pore walls– and in the directions). The virial pressure is then computed as
| (4) |
where as usual, is the change of the volume in the compression, , with , and is the number of particle pairs that overlap during the virtual (test) compression of the system. In practice, the pressure is calculated by computing for a set of values of and extrapolating to the the limit .
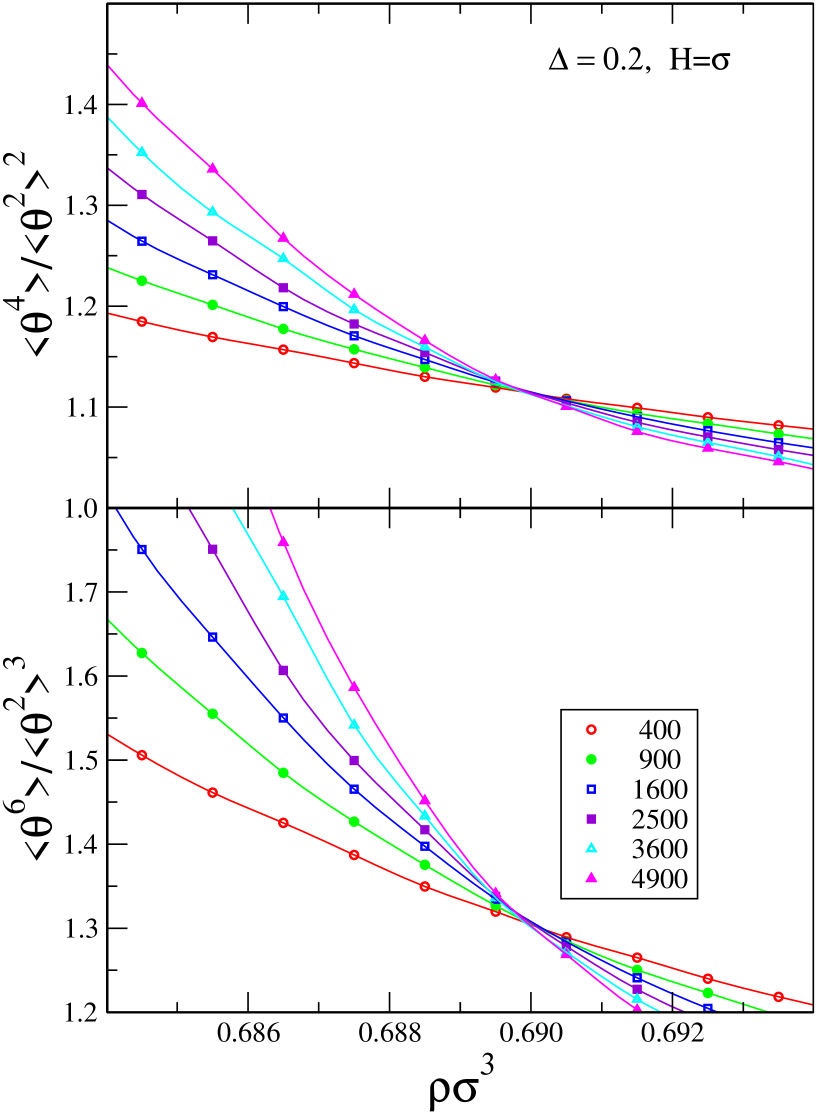
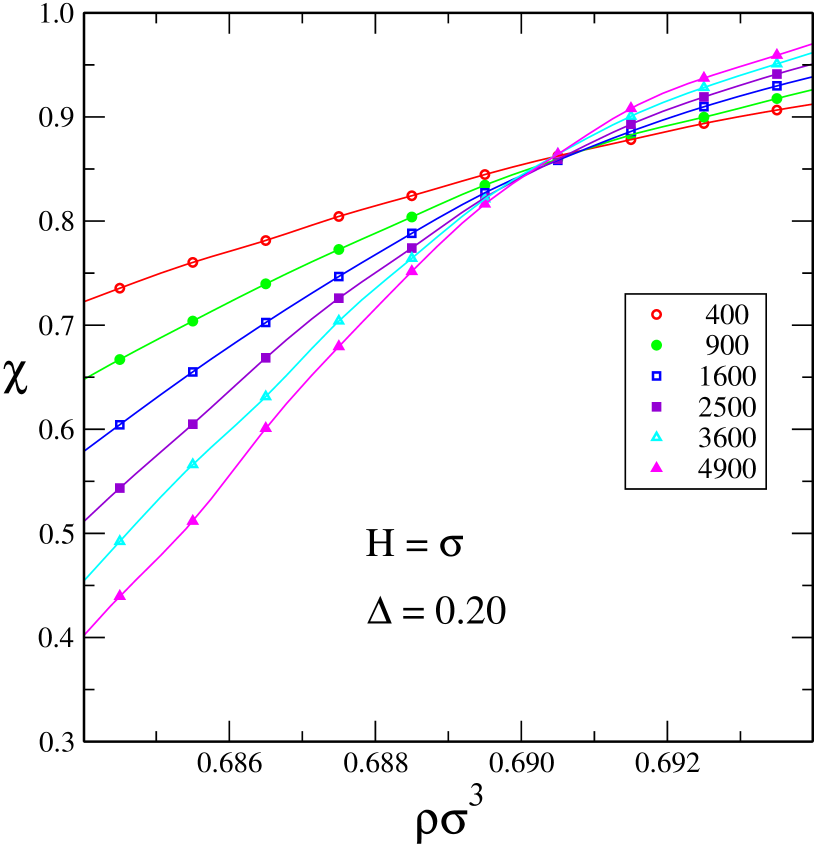
Now, the demixing transition is monitored following the evolution and size dependence of a series of appropriate order parameters. Here we have considered on one hand, , as defined in Eq. (3), and on the other the fraction of percolating configurations, . A configuration is defined as percolating if (and only if) at least one of its clusters becomes of infinite size when considering the periodic boundary conditions; those clusters are often denoted as wrapping clusters. With the order parameter we proceed to perform a Binder cumulant like analysisBinder (1981); Landau and Binder (2005). This is done by considering ratios between momenta of the order parameter probability distribution given as:
| (5) |
where the angular brackets indicate ensemble averages, and looking at how these quantities vary with the density for different system sizes. Calculations are carried out for different samples sizes, , and curves of , , and are plotted vs. total density . According to the finite size scaling analysisLandau and Binder (2005), the crossing of the curves for different system sizes, should define the critical point and be size independent for sufficiently large samples. In practice, we fit the critical density estimates, , obtained from different crossings. This is done by taking pairs of system sizes, , and looking for the density where the curves of the analyzed property for the two system sizes cross. The results for a given are taken as estimates for the pseudo-critical densities for the system size , and from then one can extrapolate the critical density in the thermodynamic limit ). These extrapolations were done by fitting the results to straight lines of the formGóźdź (2003) , where we took , according to the assumed bidimensional criticality. Notice that a more rigorous finite-size scaling analysis should be based on results from simulations carried out in either ) or ensembles instead of resorting to semi-grand ensemble simulations.Fisher (1968); Almarza et al. (2012); López et al. (2012) The estimates of obtained from the fraction of percolating configurations and the cumulants are fully consistent within statistical error bars. The corresponding critical pressures are obtained by means of a series of semi-grand canonical simulations carried out at the critical density and with varying sample sizes and extrapolating and for . An example of the evolution of the order parameters for the two dimensional limit, (i.e. pore width ) and non-additivity is presented in Figures 2 and 3.
For densities about , demixing occurs at . The mole fractions of the coexisting phases for each given system size are computed through the order parameter , as: . Using the results for different system sizes, we estimate the composition in the thermodynamic limit by fitting the results to a second-order polynomial in . Then, the phase diagram can be fully estimated discarding the equilibrium data close to the critical (much affected by sample size dependence), and using the extrapolated data , and a fit to the approximateFisher (1968) scaling law
| (6) |
where we assume the system to belong to the two dimensional Ising universality classGóźdź (2003), and hence .
III Results
We have considered systems with varying degrees of non-additivity, ranging from to , and pore widths from to (see Table 1 for the specific values).
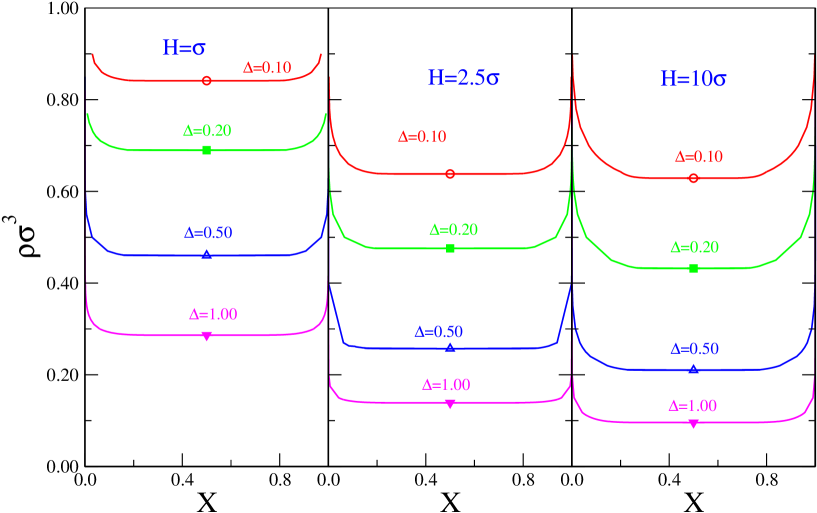
Semi-grand ensemble simulations were run for samples of 400, 900, 1600, 2500, 3600 and 4900 particles when . Sample sizes of 6400 particles were included for pore widths larger than up to where an additional sample size of 8100 particles was included. As mentioned in the previous section, for a given system defined by a pair (), simulations are run for a series of total densities, , and we monitored the behavior of the order parameters (as illustrated in Figures 2 and 3). Following the procedures indicated above we obtain a series of phase diagrams as illustrated in graphs of Figure 4 for three selected pore widths, , and . The complete set of critical properties for most of the systems studied is collected in Table 1.
From Figure 4 one immediately appreciates that increasing the non-additivity lowers the critical density, i.e. favors demixing as expected. In contrast, we observe that confinement tends to stabilize the mixed phase. This effect is particularly visible when going from the system to the two dimensional case, where one sees that the critical density practically doubles for the two largest non-additivities. Obviously, as the non-additivity decreases demixing occurs at higher packing fractions and packing constraints necessarily limit the effects of confinement on the critical density. Interestingly, we observe that as the change on the critical density is much smaller, and practically negligible for the smallest non-additivity. In practice, as we will see later, for the critical values of the bulk three dimensional hard sphere mixture have almost been reproduced. This effect of stabilization of the mixture due to confinement can be easily understood when one realizes that the average number of neighbors is reduced as one goes from the bulk three dimensional system to the two dimensional one. This implies that particles of a given type A (or B) will have fewer neighbors of type B (or A) when they are close to the walls, the limiting case being the two dimensional system. As a consequence, these particles will have a lower tendency to demix as the density (or pressure) is increased. Obviously, the fraction of particles adjacent to the walls is maximum when , and this fraction decreases rapidly as increases, and as a consequence the critical density decreases. Once the pore allows for two fluid layers inside, the fall in the critical density as the pore widens is not so pronounced.
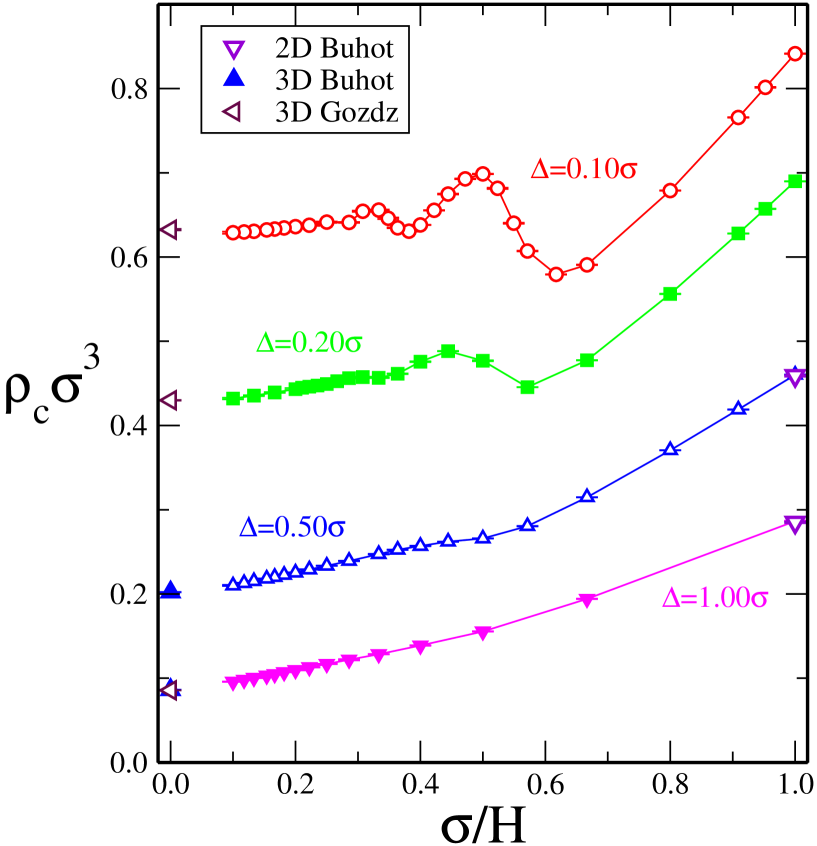
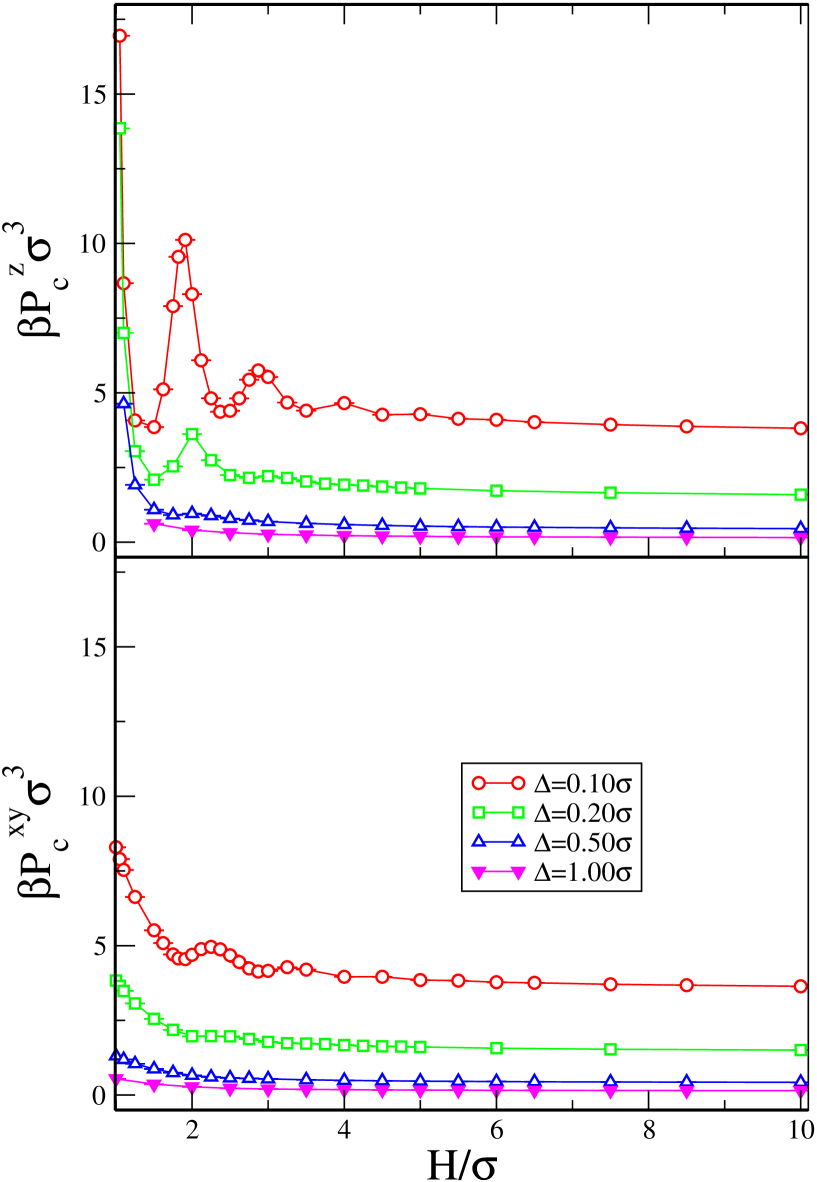
Now, in Figures 5 and 6 we observe the explicit evolution of the critical density vs and the critical pressure vs . In Figure 5 some values from the literature for the two and three dimensional limit are included. As mentioned before, the critical densities for practically have already converged to those of the unconfined system. The dependence of the critical density on pore size has two linear regimes, which for and merge continuously at . For smaller pore sizes the critical densities grow rapidly as the pore size shrinks due to the marked decrease in the number of neighbors induced by the presence of walls. For larger pore sizes, , another linear regime with a less pronounced slope sets in. An interesting feature emerges in the region for and 0.2: both the critical density and show a clear non-monotonous dependence on H, with maxima located at , and , –the latter only visible in the pressure curve– recalling the neighbor shell structure of a pair distribution function. We find then that in the ranges () the critical density and pressure increase (i.e. the mixture is stabilized) when the pore widens. Note however that on the maxima are shifted towards larger -values, and actually the minima of lie close to the maxima of . Somehow, the increase in the pressure against the pore walls tends to be compensated by a decrease of the pressure along the unbound directions.This mismatch is the obvious result of the lack of isotropy induced by the walls.
An extreme situation occurs at and , for which the critical density () is appreciably lower than that of the bulkGóźdź (2003) (). This actually implies that for certain systems (i.e. degrees of non-additivity), a stable mixture can be forced to demix by simple geometric confinement. In fact one observes that the maxima in – i.e. local stability maxima for the mixtures – occur when the pore can fit approximately an integer number of layers ( and 3). From these state points, increasing or decreasing the pore size induces demixing. The effect of the increase in pore size is easily explained as the result of an increasing number of neighbors of different species that will prefer to be in a single component phase. On the other hand, if we focus on the behavior of the system when going from to , we realize that the number of neighbors does not dramatically change when varies within these limits, as long as is small. In fact, for the pore still allows for a closed packed structure of two particle layers with 9 neighbors per particle, with A and B particles mixed. If the number of neighbors remains approximately constant, the reduction of available volume with the shrinkage of the pore width will induce demixing. The effect will still be present but less patent when going from to . Large values of will destroy this stabilizing effect, e.g. when volume exclusion will prevent the presence of unlike neighbors in adjacent layers. Small values allow for this possibility and therefore higher packing fractions of the stable mixture can be found, by which the non-monotonous dependence of the critical properties on the pore width is explained.
In summary, we have presented a detailed study of the effects of geometric confinement on symmetric mixtures of non-additive hard spheres. We have found that, as an overall trend, confinement tends to impede demixing, rising both critical densities and pressures, but interestingly for small degrees of non-additivity a non-monotonous dependence is found. In fact, for certain values of the cross interaction, it is found that confinement can induce demixing by simple packing effects. In future works, we will address the effects of competition between energetic and steric contributions to the intermolecular potential and tunable wall interactions.
Acknowledgements.
The authors acknowledge the support from the Dirección General de Investigación Científica y Técnica under Grants No. FIS2010-15502 and FIS2013-47350-C5-4-R. The CSIC is also acknowledged for providing support in the form of the project PIE 201080E120.References
- Gelb et al. (1999) L. D. Gelb, K. Gubbins, R. Radhakrishnan, and M. Sliwinska-Bartkowiak, Rep. Prog. Phys. 62, 1573 (1999).
- Binney et al. (1993) J. Binney, N. Dowrick, A. Fisher, and M. Newman, The theory of critical phenomena (Clarendon, Oxford, 1993).
- Binder (1992) K. Binder, Annual Review of Physical Chemistry 43, 33 (1992).
- Severin et al. (2014) N. Severin, I. M. Sokolov, and J. P. Rabe, Langmuir 30, 3455 (2014).
- Hung et al. (2005) F. R. Hung, K. E. Gubbins, R. Radhakrishnan, K. Szostak, F. Béguin, G. Dudziak, and M. Sliwinska-Bartkowiak, Appl. Phys. Lett. 86, 103110 (2005).
- Alba-Simionesco et al. (2006) C. Alba-Simionesco, B. Coasne, G. Dosseh, G. Dudziak, K. E. G. R. Radhakrishnan, and M. Sliwinska-Bartkowiak, J. Phys.: Condens. Matter 18, R15 (2006).
- Biddle et al. (2014) J. W. Biddle, V. Holten, and M. A. Anisimov, J. Chem. Phys. 141, 074504 (2014).
- Chen et al. (2006) S.-H. Chen, F. Mallamace, C.-Y. Mou, M. Broccio, C. Corsaro, A. Faraone, , and L. Liu, Proceedings of the National Academy of Science of the United States of America 103, 12974 – 12978 (2006).
- Bertrand et al. (2012) C. E. Bertrand, Y. Zhang, and S.-H. Chen, Phys. Chem. Chem. Phys. 15, 721 (2012).
- Fortini and Dijkstra (2006) A. Fortini and M. Dijkstra, J. Phys.: Condens. Matter 18, L371 (2006).
- Duda et al. (2003) Y. Duda, E. Vakarin, and J. Alejandred, Journal of Colloid and Interface Science 258, 10 (2003).
- Widom and Rowlinson (1970) B. Widom and J. S. Rowlinson, J. Chem. Phys. 52, 1670 (1970).
- Johnson et al. (1997) G. Johnson, H. Gould, J. Machta, and L. K. Chayes, Phys. Rev. Lett. 79, 2612 (1997).
- Saija and Giaquinta (2002) F. Saija and P. V. Giaquinta, J. Chem. Phys. 117, 5780 (2002).
- Lomba et al. (1996) E. Lomba, M. Alvarez, L. Lee, and N. G. Almarza, J. Chem. Phys. 104, 4180 (1996).
- Góźdź (2003) W. T. Góźdź, J. Chem. Phys. 119, 3309 (2003).
- Jagannathan and Yethiraj (2003) K. Jagannathan and A. Yethiraj, J. Chem. Phys. 118, 7907 (2003).
- Buhot (2005) A. Buhot, J. Chem. Phys. 122, 024105 (2005).
- Kofke and Glandt (1988) D. A. Kofke and E. D. Glandt, Mol. Phys. 64, 1105 (1988).
- Frenkel and Smit (2002) D. Frenkel and B. Smit, Undesrtanding Molecular Simulation (Academic, London, 2002).
- Swendsen and Wang (1987) R. H. Swendsen and J.-S. Wang, Phys. Rev. Lett. 58, 86 (1987).
- Wolff (1989) U. Wolff, Phys. Rev. Lett. 62, 361 (1989).
- Stauffer and Aharony (2003) D. Stauffer and A. Aharony, Introduction to Percolation Theory (Taylor and Francis, London, 2003), 2nd ed.
- Miguel and Jackson (2006) E. D. Miguel and G. Jackson, Mol. Phys. 104, 3717 (2006).
- de Miguel et al. (2007) E. de Miguel, N. G. Almarza, and G. Jackson, J. Chem. Phys. 127, 034707 (2007).
- Binder (1981) K. Binder, Z. Phys. B 43, 119 (1981).
- Landau and Binder (2005) D. P. Landau and K. Binder, A guide to Monte Carlo Simulations in Statistical Physics (Cambridge University, Cambridge, 2005).
- Fisher (1968) M. E. Fisher, Physical Review 176, 257 (1968).
- Almarza et al. (2012) N. G. Almarza, J. Tavares, and M. T. da Gama, Phys. Rev. E 85, 053102 (2012).
- López et al. (2012) L. G. López, D. H. Linares, and A. J. Ramirez-Pastor, Phys. Rev. E 85, 053101 (2012).
| 1.00 | 0.841 | 8.30 | — | 0.690 | 3.84 | – | 0.460 | 1.314 | – | 0.286 | 0.547 | – |
|---|---|---|---|---|---|---|---|---|---|---|---|---|
| 1.05 | 0.802 | 7.91 | 16.95 | 0.657 | 3.66 | 13.85 | – | – | – | – | – | – |
| 1.10 | 0.765 | 7.55 | 8.67 | 0.628 | 3.49 | 7.01 | 0.419 | 1.193 | 4.64 | – | – | – |
| 1.25 | 0.679 | 6.64 | 4.08 | 0.555 | 3.07 | 3.05 | 0.370 | 1.051 | 1.919 | – | – | – |
| 1.50 | 0.591 | 5.52 | 3.86 | 0.477 | 2.56 | 2.10 | 0.314 | 0.876 | 1.089 | 0.194 | 0.365 | 0.621 |
| 1.75 | 0.607 | 4.70 | 7.91 | 0.445 | 2.18 | 2.54 | 0.280 | 0.751 | 0.912 | – | – | – |
| 2.00 | 0.699 | 4.71 | 8.31 | 0.477 | 1.97 | 3.62 | 0.266 | 0.660 | 0.959 | 0.155 | 0.275 | 0.405 |
| 2.25 | 0.675 | 4.97 | 4.83 | 0.488 | 1.97 | 2.75 | 0.262 | 0.604 | 0.889 | – | – | – |
| 2.50 | 0.638 | 4.69 | 4.41 | 0.476 | 1.97 | 2.25 | 0.257 | 0.575 | 0.795 | 0.138 | 0.227 | 0.319 |
| 2.75 | 0.635 | 4.24 | 5.44 | 0.461 | 1.88 | 2.16 | 0.252 | 0.558 | 0.735 | – | – | – |
| 3.00 | 0.656 | 4.16 | 5.54 | 0.456 | 1.78 | 2.21 | 0.247 | 0.542 | 0.693 | 0.128 | 0.202 | 0.268 |
| 3.50 | 0.641 | 4.20 | 4.40 | 0.456 | 1.73 | 2.04 | 0.239 | 0.512 | 0.632 | 0.122 | 0.189 | 0.241 |
| 4.00 | 0.642 | 3.97 | 4.66 | 0.449 | 1.67 | 1.93 | 0.233 | 0.491 | 0.592 | 0.117 | 0.180 | 0.221 |
| 4.50 | 0.638 | 3.96 | 4.27 | 0.446 | 1.63 | 1.86 | 0.229 | 0.478 | 0.562 | 0.113 | 0.173 | 0.207 |
| 5.00 | 0.636 | 3.85 | 4.29 | 0.443 | 1.61 | 1.80 | 0.225 | 0.468 | 0.541 | 0.109 | 0.167 | 0.196 |
| 6.00 | 0.634 | 3.78 | 4.11 | 0.439 | 1.57 | 1.73 | 0.220 | 0.452 | 0.508 | 0.105 | 0.160 | 0.182 |
| 7.50 | 0.631 | 3.72 | 3.94 | 0.436 | 1.54 | 1.66 | 0.215 | 0.440 | 0.482 | 0.100 | 0.153 | 0.169 |
| 10.00 | 0.630 | 3.65 | 3.82 | 0.432 | 1.51 | 1.59 | 0.210 | 0.428 | 0.458 | 0.096 | 0.147 | 0.158 |