11email: maryvonne.gerin@ens.fr 22institutetext: Sorbonne Universités, UPMC Univ Paris 06, UMR 8112, LERMA, F-75005, Paris, France. 33institutetext: CNRS UMR5804, Laboratoire d’Astrophysique de Bordeaux, 2 rue de l’Observatoire, BP89, 33271 Floirac cedex, France.
33email: maxime.ruaud@obs.u-bordeaux1.fr 44institutetext: Instituto de Ciencia de Materiales de Madrid (ICMM-CSIC). E-28049, Cantoblanco, Madrid, Spain. 44email: jr.goicoechea@icmm.csic.es 55institutetext: Jet Propulsion Laboratory, California Institute of Technology, 4800 Oak Grove Drive, Pasadena, CA 91109-8099, USA. 55email: pauf.f.goldsmith@jpl.nasa.gov 66institutetext: California Institute of Technology, Cahill Center for Astronomy and Astrophysics 301-17, Pasadena, CA 91125, USA. 66email: darek.lis@obspm.fr,tgp@caltech.edu 77institutetext: Max-Planck Institute für Radioastronomie, Auf dem Hügel 69, D-53121 Bonn, Germany. 77email: kmenten@mpifr-bonn.mpg.de 88institutetext: Department of Physics and Astronomy, The John Hopkins University, Baltimore, MD, 21218, USA. 88email: neufeld@pha.jhu.edu 99institutetext: National Radio Astronomy Observatory, 520 Edgemont Road Charlottesville, VA 22903, USA. 99email: hliszt@nrao.edu
[C ii] absorption and emission in the diffuse interstellar medium across the Galactic Plane††thanks: Herschel is an ESA space observatory with science instruments provided by European-led Principal Investigator consortia and with important participation from NASA.
Abstract
Aims. Ionized carbon is the main gas-phase reservoir of carbon in the neutral diffuse interstellar medium and its 158 m fine structure transition [C ii] is the most important cooling line of the diffuse interstellar medium (ISM). We combine [C ii] absorption and emission spectroscopy to gain an improved understanding of physical conditions in the different phases of the ISM.
Methods. We present high resolution [C ii] spectra obtained with the Herschel/HIFI instrument towards bright dust continuum sources regions in the Galactic plane, probing simultaneously the diffuse gas along the line of sight and the background high-mass star forming regions. These data are complemented by single pointings in the 492 and 809 GHz fine structure lines of atomic carbon and by medium spectral resolution spectral maps of the fine structure lines of atomic oxygen at 63 and 145 m with Herschel/PACS.
Results. We show that the presence of foreground absorption may completely cancel the emission from the background source in medium spectral resolution PACS data and that high spectral resolution spectra are needed to interpret the [C ii] and [O i] emission and the [C ii]/FIR ratio. This phenomenon may explain part of the [C ii]/FIR deficit seen in external luminous infrared galaxies where the bright emission from the nuclear regions may be partially canceled by absorption from diffuse gas in the foreground. The C+ and C excitation in the diffuse gas is consistent with a median pressure of for a mean kinetic temperature of K. A few higher pressure regions are detected along the lines of sight, as emission features in both fine structure lines of atomic carbon. The knowledge of the gas density allows us to determine the filling factor of the absorbing gas along the selected lines of sight. The derived median value of the filling factor is 2.4 %, in good agreement with the properties of the Galactic Cold Neutral Medium. The mean excitation temperature is used to derive the average cooling due to C+ in the Galactic plane : ergs-1H-1. Along the observed lines of sight, the gas phase carbon abundance does not exhibit a strong gradient as a function of Galacto-centric radius and has a weighted average of C/H = .
Key Words.:
ISM : general; ISM : structure; ISM : individual objects : W28A, W31C, W33A, G34.3+0.15, W49N, W51, DR21(OH), W3-IRS5; ISM : lines and bands; Galaxy : disk; Infrared : ISM1 Introduction
The diffuse interstellar medium presents a complex structure due to the coexistence of two stable phases of neutral gas, the Cold Neutral Medium (CNM) with moderate densities and temperatures ( and ) and the Warm Neutral Medium (WNM) with low densities and high temperatures ( and ), the two phases being in pressure equilibrium (see Draine, 2011). Higher pressure phases are associated either with HII regions created by massive stars, and with molecular clouds where the interplay of gravity and magnetic fields contributes to the creation of denser structures, in which thermal pressure does not balance other forces present. The classical tracer of both diffuse ISM phases is the hyperfine transition of neutral hydrogen at 21 cm (HI). Both phases contribute to the widespread emission, while the CNM can also be detected in absorption against either continuum sources or background HI emission. However it is still fairly difficult to estimate the relative contributions of these phases to the total amount of atomic hydrogen, and how this varies with the physical conditions in the Galaxy (Kalberla & Kerp, 2009).
The fine structure line of ionized carbon at 158 m, [C ii], is the main cooling line of the CNM and as such is a complementary probe of this diffuse phase. The Herschel satellite has performed the first [C ii] survey of the Galactic plane (Langer et al., 2010; Pineda et al., 2013; Langer et al., 2014). The measured [C ii] emission has been compared with HI and CO data to identify the contributions from the different ISM phases, leading to the conclusion that the CNM gas represents % of the atomic gas in the Galactic Plane. In addition to the molecular gas traced by CO emission, an additional 30 % is traced by the [C ii] emission. This “CO dark” molecular gas is also detected as an excess in thermal dust emission in the sub-millimeter regime as discussed by Planck Collaboration et al. (2011) using the Planck Surveyor data.
Detection of [C ii] emission is limited by the sensitivity of the HIFI instrument. Absorption spectroscopy toward strong far infrared continuum sources can improve the ability to study low column density regions. This method has been pioneered for the fine structure lines of ionized carbon and neutral oxygen by Vastel et al. (2000, 2002) and by Lis et al. (2001) using the Infrared Space Observatory (ISO) long wavelength spectrograph (LWS) at moderate spectral resolution. The HIFI instrument on board the Herschel satellite has allowed for the first time high spectral resolution observations of both neutral and ionized carbon fine structure lines, with high sensitivity. It has also enabled the detection of ground state hydride lines from the diffuse interstellar medium (Gerin et al., 2012). These observations have revealed that neutral species like HF, CH and possibly water vapor, are reliable tracers of molecular hydrogen (Gerin et al., 2010; Neufeld et al., 2010; Flagey et al., 2013). Given the very large critical densities of the ground state hydride lines compared to the moderate densities in the diffuse ISM, the absorption data do not provide information on the physical conditions of the absorbing gas.
In this paper we present complementary data on the fine structure lines of ionized and neutral carbon aimed at better understanding the properties of the diffuse gas in the Galactic Plane. The high spectral resolution HIFI data are complemented by PACS spectral maps for the [C ii] and [O i] fine structure lines, at medium spectral resolution. We study the density and pressure structure, as well as the the volume filling factor of the colder and denser phases (CNM and diffuse molecular gas) from the comparison of the emission and absorption data. Section 2 presents the observations. Section 3 discusses the analysis methods and gives the main results, while the conclusions are presented in Section 4 and summarized in Section 5. Appendices A and B give additional information on the observations and present the data in the complete set of sources observed.
2 Observations
2.1 Presentation of the HIFI observations
| Name | Ref.a | Velocity | |||||||
|---|---|---|---|---|---|---|---|---|---|
| interval | ( | ( | ( | ||||||
| (J2000) | (J2000) | () | () | () | ) | ) | ) | ||
| W28A(G5.89-0.4) | 18:00:30.4 | -24:04:00 | 10 | 1.3 | 1 | [15,25] | 3.2f | e | |
| W31C(G10.6-0.4) | 18:10:28.7 | -19:55:50 | -2 | 5.0 | 2 | [10,23] | 5.0b | c | |
| [23,34] | 5.4b | c | |||||||
| [34,61] | 6.9b | c | |||||||
| W33A(G12.9-0.3) | 18:14:39.4 | -17:52:00 | 37 | 2.4 | 3 | [14,25] | c | c | |
| G34.3+0.15 | 18:53:18.7 | +01:14:58 | 58 | 3.3 | 4 | [8,20] | 2.2b | c | |
| [20,35] | 5.0b | c | |||||||
| W49N(G43.2-0.1) | 19:10:13.2 | +09:06:12 | 11 | 11.4 | 5 | [25,50] | 7.0b | c | |
| [50,80] | 9.3b | c | |||||||
| W51(G49.5-0.4) | 19:23:43.9 | +14:30:30.5 | 57 | 5.4 | 6 | [1,10] | 1.5b | c | |
| [10,16] | 1.0b | c | |||||||
| [16,35] | 2.4b | c | |||||||
| DR21OH(G81.7+0.6) | 20:39:00.7 | +42:22:46.7 | -2 | 1.5 | 7 | [1,20] | 5.0b | c | |
| W3-IRS5 | 02:25:40.6 | +62:05:51 | -37 | 2.0 | 8 | [-25,-15] | 0.7b,d | e | |
| [-15,10] | 0.9b,d | e |
a References: (1) Motogi et al. (2011),(2) Sanna et al. (2014), (3) Immer et al. (2013), (4) Kuchar & Bania (1994),
(5) Gwinn et al. (1992), (6) Sato et al. (2010), (7) Rygl et al. (2012), (8) Xu et al. (2006)
b from (Winkel et al., 2014), c From Godard et al. (2012) ; d using data from
Normandeau (1999) ; e this paper using [CH]/[H2] = (Sheffer et al., 2008) and [HF]/[H2] = (Sonnentrucker et al., 2010) ; f from Fish et al. (2003).
The source sample is based on the PRISMAS sources, as presented in e.g. Godard et al. (2010); Flagey et al. (2013). W3-IRS5 was targeted as an additional sight-line to probe the outer Galaxy as this source is located in the Perseus arm. The source positions, LSR velocities and distances are listed in Table 1 as well as the velocity intervals corresponding to the diffuse matter absorption and the associated atomic, molecular and total hydrogen column densities. Table A.1 in Appendix A summarizes the observing modes and provides the ObsID analyzed in this paper.
Analysis of absorption spectra requires accurate knowledge of the continuum level, which is best measured in DBS (Double Beam Switching) mode with heterodyne receivers like HIFI. However, since the [C ii] emission is very extended in the Galaxy, this mode produces spectra that are contaminated by the presence of signals in the OFF beam. To avoid this problem, HIFI could be operated using the internal cold load (employed for calibration), as a reference for monitoring the system gain. This observing mode called “Load Chop” (LC) minimizes the contamination at the expense of a lower accuracy measurement of the continuum (de Graauw et al., 2010; Roelfsema et al., 2012). We therefore performed the [C ii] and [C i] observations in two steps : we obtained a single pointing at the source position in DBS mode, followed by either a small map covering (for [C ii]) or a single pointing (for both [C i] lines) in LC mode. This combination provides the continuum at the central position and an accurate spectrum free of contamination, including both the background source emission and the foreground diffuse medium along the line of sight. As the continuum emission of the background source is semi-extended, we also used the PACS spectrometer (Poglitsch et al., 2010) to determine the 158m continuum over the area mapped with HIFI.
The spectroscopic parameters of the targeted fine structure lines are given in Table 2. At these frequencies, the angular resolution of the Herschel telescope is limited by diffraction, and the FWHM beam size is 44”, 26” and 11”, at 492, 809, and 1900 GHz, respectively. As we are focusing on the foreground absorption in this paper, we have not attempted to correct for the difference in angular resolution among the different lines.

2.2 HIFI Data processing
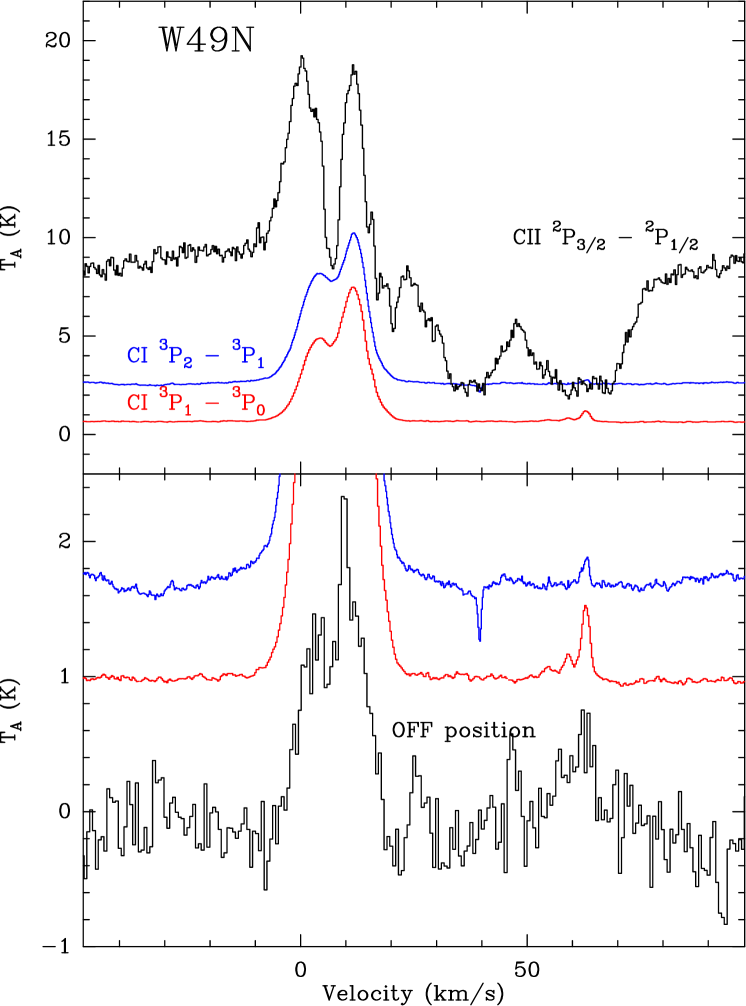
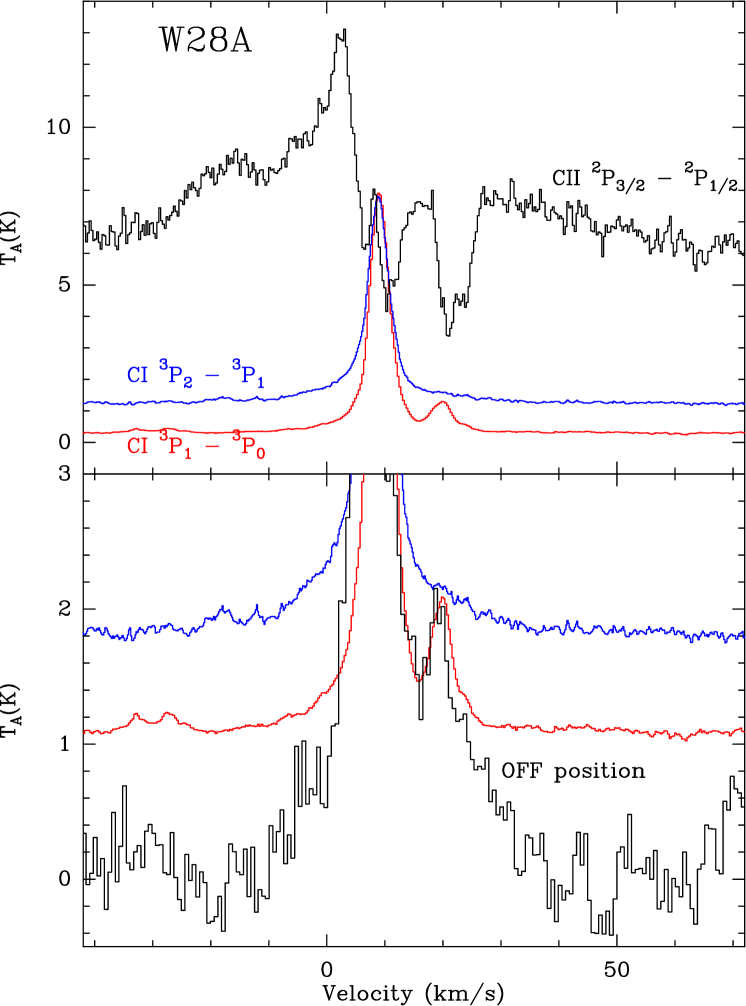
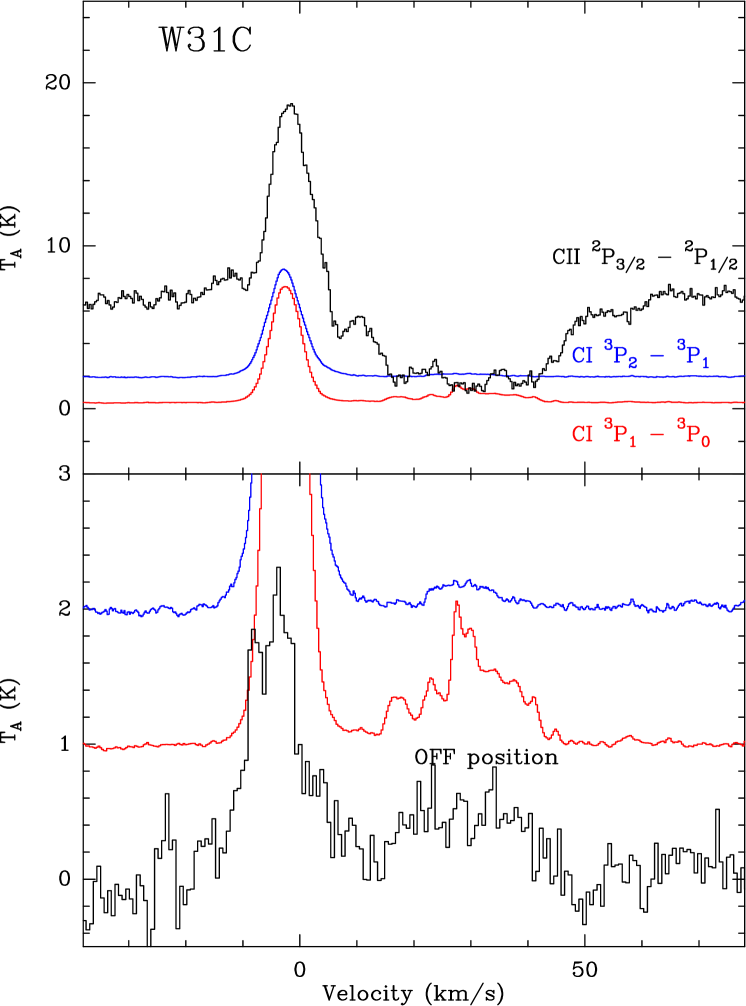
The observations have been analyzed with the Herschel Interactive Processing Environment (HIPE version 9 111available at http://herschel.esac.esa.int/HIPE_download.shtml). The HIFI data have been corrected for fringes using the HIFIFitfringe routine. The single pointing and maps have been exported to the CLASS package222available at http://www.iram.fr/IRAMFR/GILDAS/ for further processing. The HIFI mixers are double side band (DBS) and therefore sensitive to the emission in two frequency bands. Therefore the detected continuum levels are the combination of the continuum emission in these two side bands while the line emission and absorption is detected in one side band only. Correction for the relative gain of each mixer in the two side bands is included in the calibration pipeline. The HIFI calibration accuracy is better than 10%. As the foreground emission is extended relative to the HIFI beam at 1.9 THz, we present all data in this paper in units of antenna temperature denoted TA. As an example of the resulting spectra and maps, the data toward W49N are shown in Fig. 1 and Fig. 2. The data for the other sources are presented in Appendix B. For each source, we display the spectrum observed in load chop mode toward the central position with the correct SSB continuum level, as well as the mean spectrum toward the OFF positions, obtained as the difference between the load chop and DBS spectra. This shows the level of contamination by emission signal in the OFF beam. A linear baseline has been removed from the spectra.
We derived the continuum intensities from the DBS spectra. We used the HIFI efficiencies given in Roelfsema et al. (2012) to convert the continuum values from Kelvin to Jy, namely 464, 469, and 506 Jy/K at 0.49, 0.81, and 1.9 THz, respectively. The continuum values are listed in Table 3. For the [C ii] data at 1.9 THz, we provide a comparison with the continuum intensities measured in the central pixel of the PACS footprint.


2.3 PACS data processing
The PACS spectra presented in this work were obtained between 2010 and 2012 using the Range Spectroscopy SED mode. This mode is designed to cover the full PACS wavelength range in Nyquist sampling to get the complete far-IR Spectral Energy Distribution (SED). The observation ObsIDs are tabulated in Table A.1. The PACS spectrometer uses photoconductor detectors and provides 25 spectra over a 47′′47′′ field-of-view (FoV) arranged as 55 spatial pixels (“spaxels”), each with an angular size of 9.4′′ on the sky (Poglitsch et al., 2010). The measured width of the PACS spectrometer point spread function (PSF) increases with wavelength for 100 m. In particular, only 50% (70%) of a point source emission would fall in the central spaxel at 158 m (63 m). The resolving power in the R1 and B3A grating orders are 1200 (250 km s-1) at 158 m and 3300 (90 km s-1) at 63 m. The total observing time was 1.4 h per source in the R1 order and 1.3 h in the B3A order.
Observations were carried out in the “chop-nod” mode with the largest chopper throw of 6 arc-min. This mode offers a reasonable measurement of the continuum level toward bright, compact star forming cores. In the observed regions, however, the reference nod positions are often contaminated by extended [Cii]158 m and [Oi]63 m line emission. Accurate calibration of the line intensities toward each source is thus not trivial and requires subtraction of the reference position emission. The continuum rms noise of the spectra toward each continuum peak position was typically 5-10 Jy/spaxel. Except for W33A (the faintest of the sample) the continuum peak in each source is a few thousand Jy/spaxel, close but still below the saturation levels of PACS detectors.
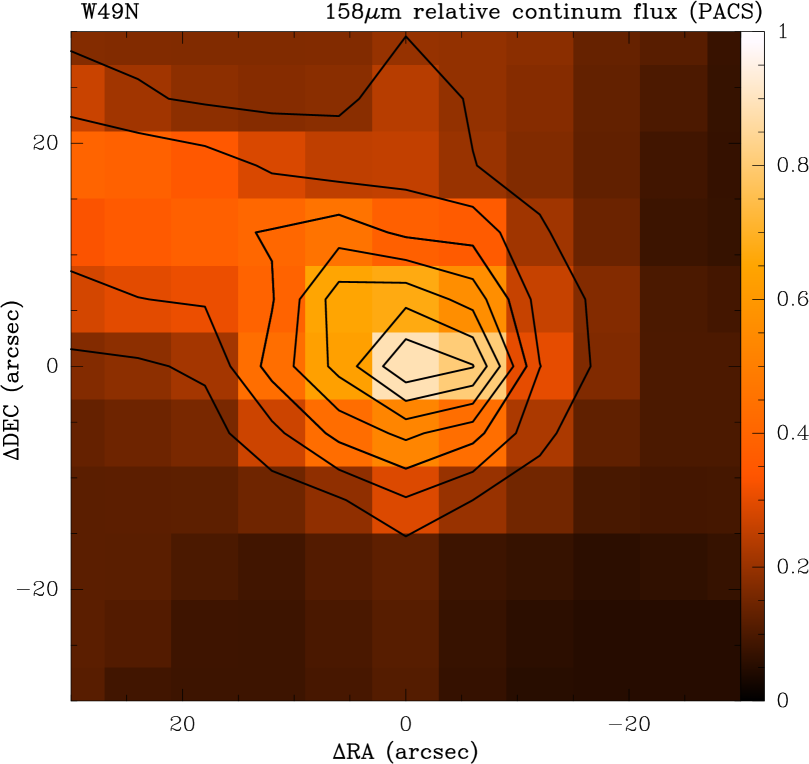
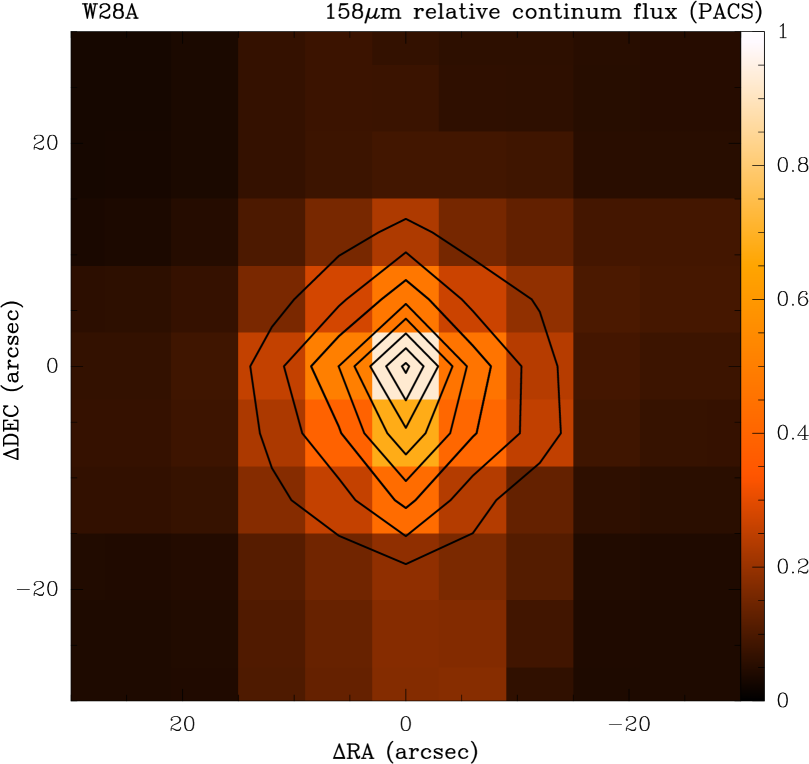
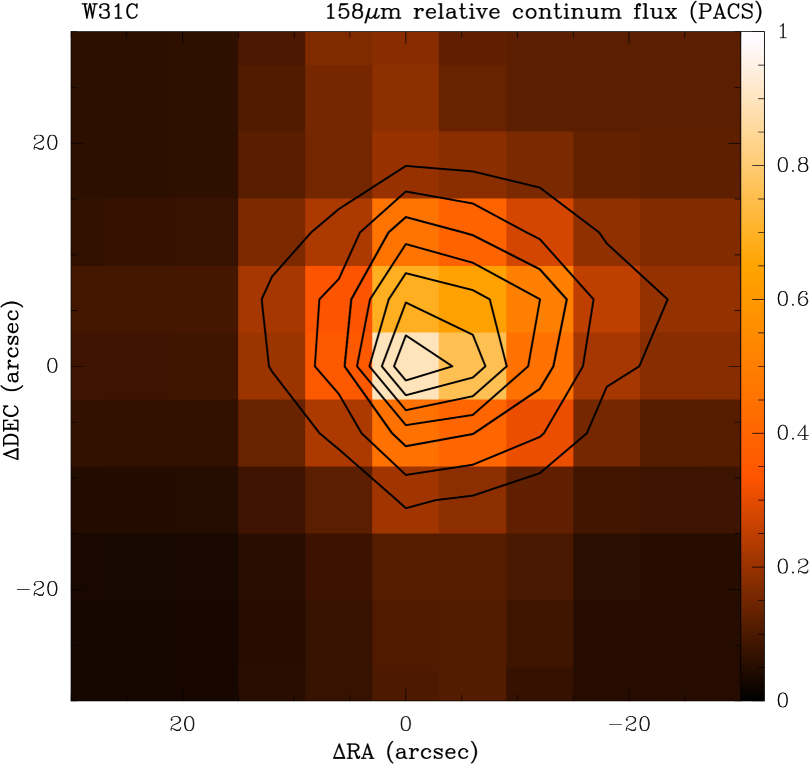
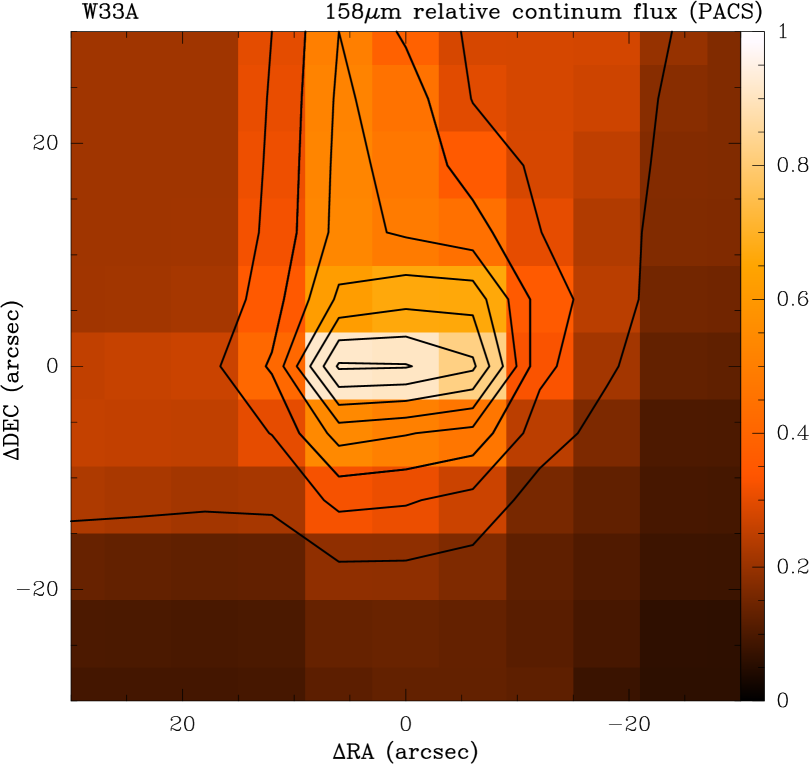
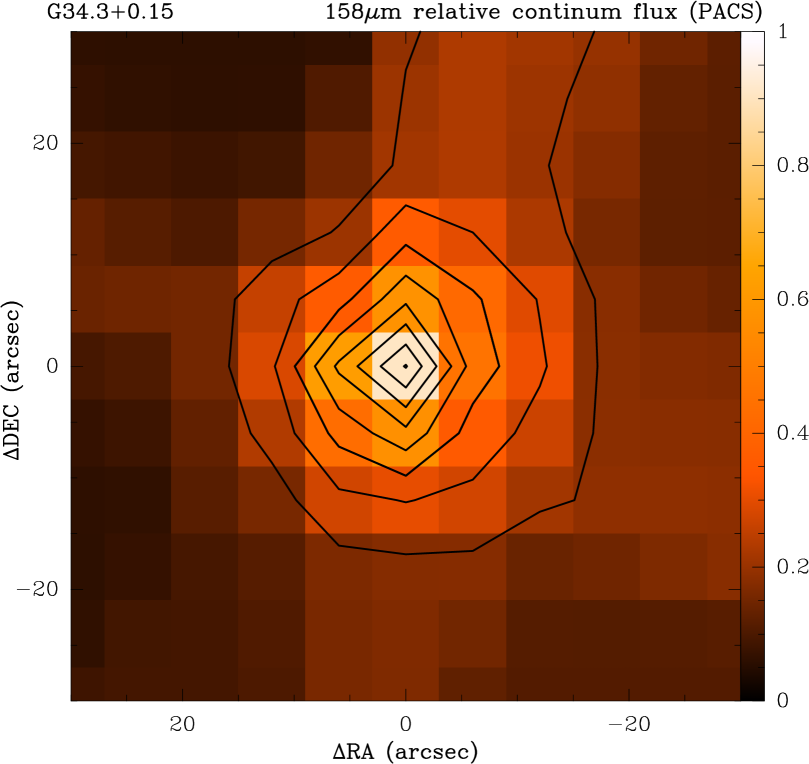
The PACS data were processed in HIPE 11 (Ott, 2010). The 158, 145 and 63 m continuum levels in each observed position were extracted using the standard ChopNodRangeScan pipeline for chopped Range Spectroscopy observations. Table 3 shows a summary of the 158 m continuum levels measured with PACS toward the continuum peak of each source. The absolute flux calibration uncertainty is estimated to be 30 333See PACS Spectroscopy performance and calibration,” PACS/ICC document ID PICC-KL-TN-041, by B. Vandenbussche et al.. Toward the peak positions, the continuum fluxes have been extracted using the PACS point source correction applied to the central spaxel fluxes. Owing to the relatively large distance to these sources, this is a good first approximation (specially for their bright and compact far-IR continuum peak). Indeed, the resulting fluxes are in very good agreement with those obtained from HIFI at the map center. Maps of the relative continuum emission with respect to the peak position were constructed for each observed source and are shown in Figure 3 and Figs 13 to 31. The PACS maps were re-centered with respect to the HIFI map (0′′, 0′′) coordinates. In most sources, the (0′′, 0′′) position agrees with the continuum peak.
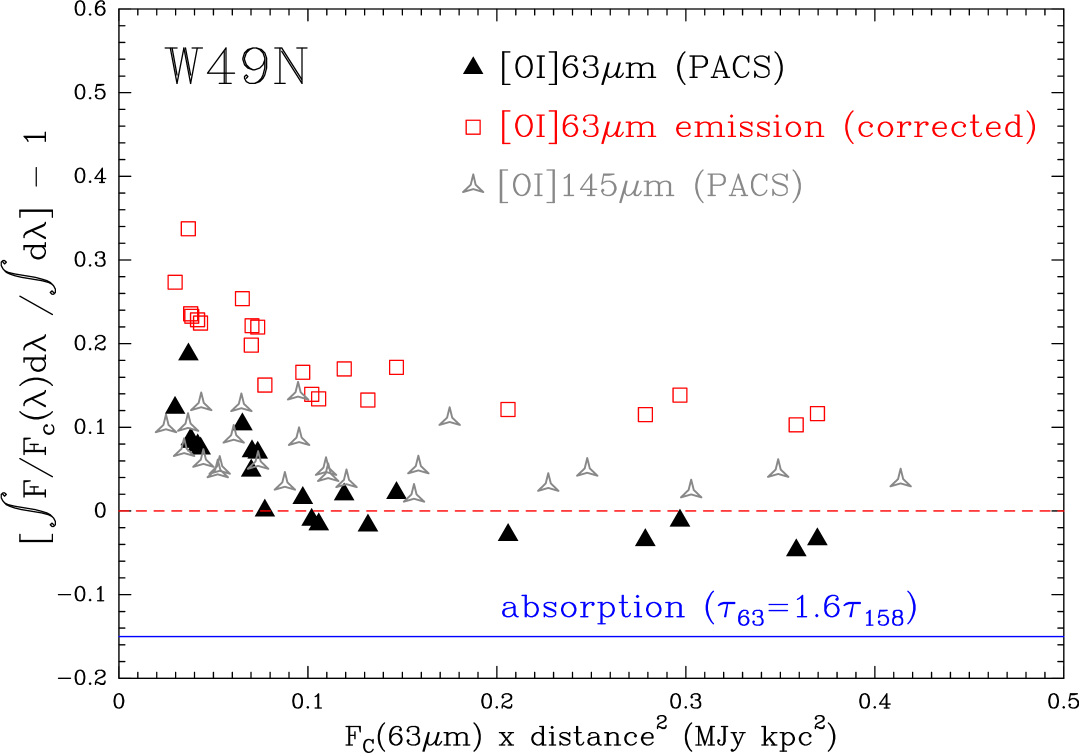
In order to correct for the [Cii] 158 m and [Oi] 63 m line contamination in the reference nod positions we used the ChopNodSplitOnOff pipeline. For W49N, W51 and W31C, the [Cii] 158 m line emission in the A and B nod positions is almost the same (10-30 of the intrinsic ON source emission). The [Oi] 63 m line emission in the nod positions is typically 0-10% of the ON source emission. For these sources we could correct for the extended emission by taking into account the line emission in each reference spaxel. The final spectral map thus contains the continuum emission plus the corrected [C ii] 158 m and [Oi]63 m line emission/absorption. A polynomial baseline of order 3 was subtracted from each spectrum to obtain the continuum–subtracted data, and each spectrum was divided by the continuum to obtain the line/continuum spectra. Figure 3, and Figures 13 to 31 show the resulting [C ii] maps for each source. We also display maps of the relative continuum emission at 158m (with respect to the peak position). Figure 4 shows the line to continuum maps for the [O i] 63 m and 145 m lines toward W49N.
| Source | (HIFI)1 | (HIFI)2 | (HIFI)3 | (PACS)4 | |||
|---|---|---|---|---|---|---|---|
| (K) | (102 Jy/beam) | (K) | (102 Jy/beam) | (K) | (102 Jy/beam) | (102 Jy/beam) | |
| W28A | |||||||
| W31C | |||||||
| W33A | … | … | |||||
| G34.3+0.15 | |||||||
| W49N | |||||||
| W51 | |||||||
| DR21(OH) | … | … | |||||
| W3-IRS5 | … | … |
1 using 464 Jy/K, 2 using 469 Jy/K, 3 using 506 Jy/K, 4 using the point source calibration.


3 Results
3.1 Spatial structure
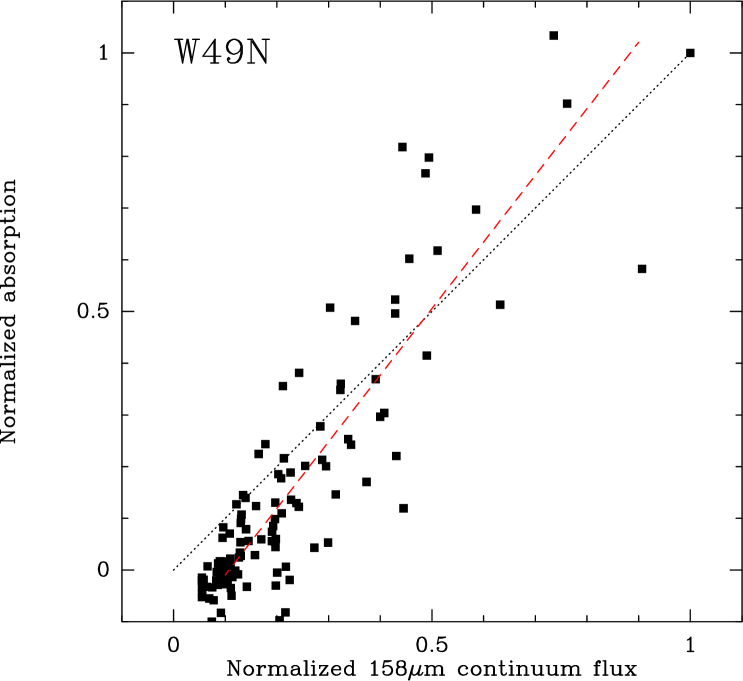
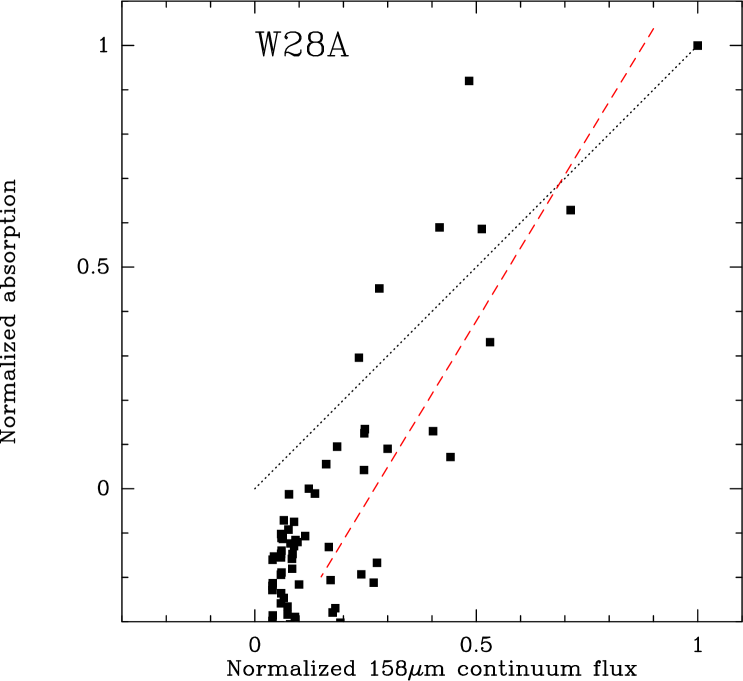
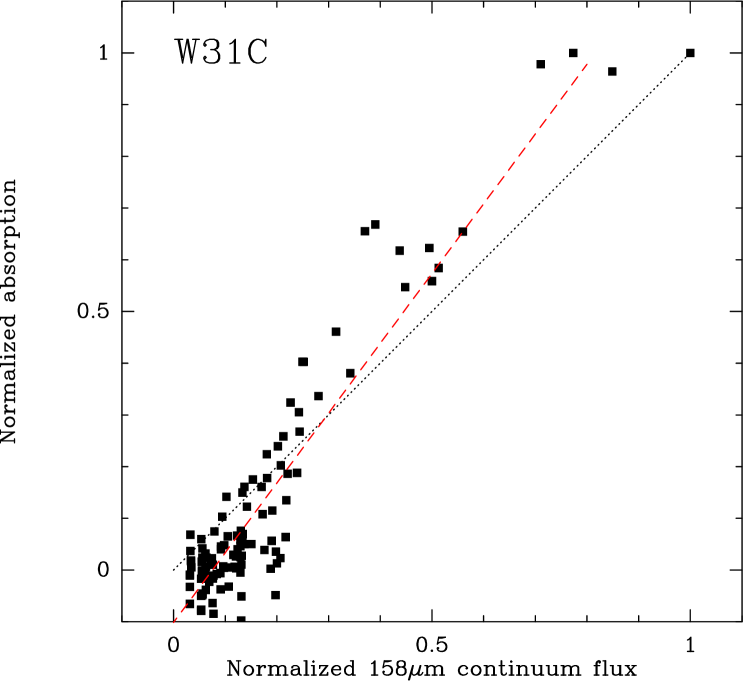
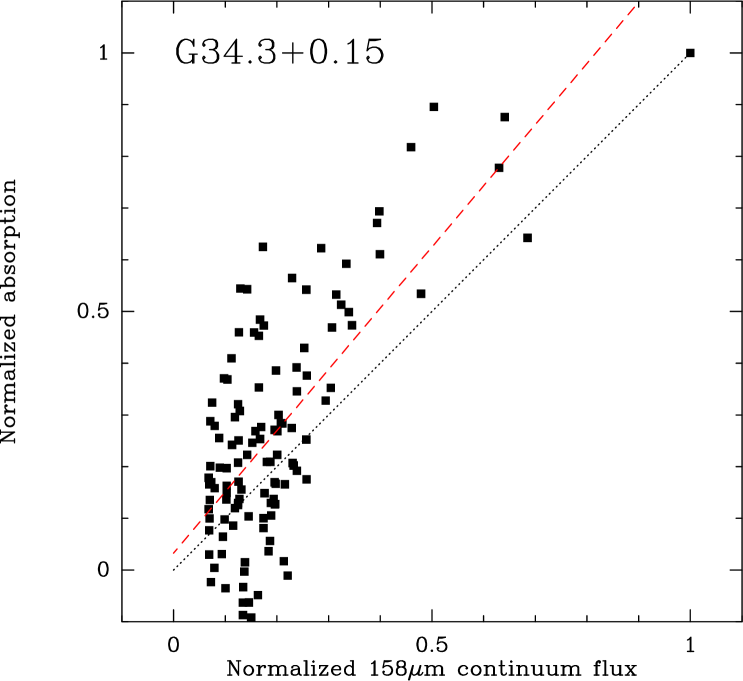
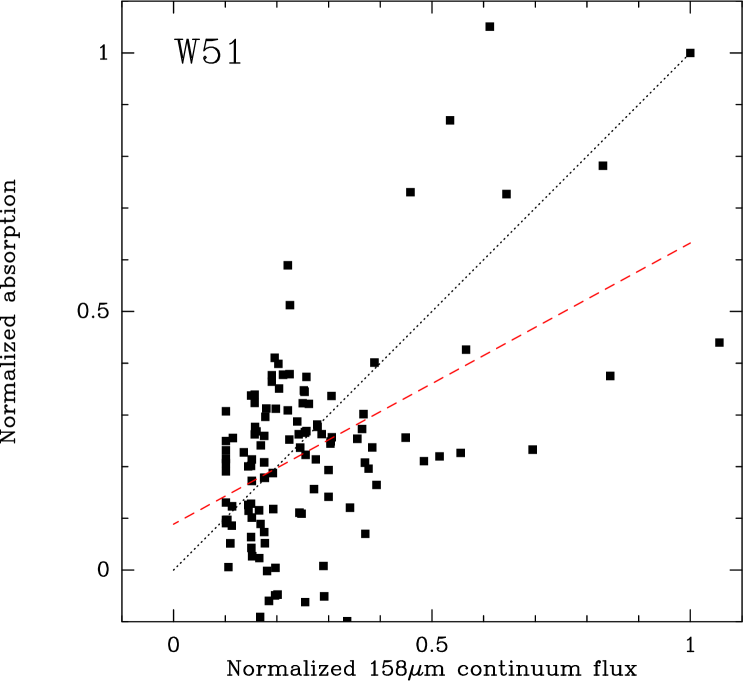
We have made use of the information in both the PACS and HIFI data to investigate the spatial variations of the foreground absorption. The continuum emission was accurately measured at the map center with HIFI. However, since the continuum information obtained in the HIFI map is not fully reliable, the HIFI map provides only the velocity integrated emission or absorption (in ) at each position. We have therefore made use of the PACS spectral map data to determine the spatial variation of the far infrared continuum emission in each source. As the continuum emission is expected to vary smoothly at 158m, we have interpolated the measured continuum fluxes in each PACS spaxel to obtain a far infrared continuum map of each source. Because this method is not expected to provide an accurate absolute calibration, we only make use of the spatial variation of the fluxes relative to the map center. Figure 3 (left panel) presents the resulting continuum map for W49N. Figure 5 presents the comparison of the velocity integrated absorption relative to the velocity integrated absorption at the map center for each pixel of the HIFI map. The relative integrated absorption and continuum emission (each normalized by value at the center of the map) show an excellent linear correlation, with a correlation coefficient of 0.88 for W49N and a slope close to unity. This behavior is expected for an extended and uniform foreground absorber. While small amplitude variations are not excluded given the limited signal to noise ratio, the diffuse gas along the line of sight behaves to first order as a uniform screen across the angular extent of the W49N background source. Therefore the molecular column densities derived from the ground state hydride absorption lines reported elsewhere with different angular resolutions are directly comparable to the present data. The same behavior is found for the other sources in the sample.
3.2 [C ii] line to continuum ratio
All sources exhibit complex line profiles in the velocity ranges associated with the star forming regions, with multiple velocity components, the possibility of self-absorption and in some cases broad line wings likely tracing UV-irradiated outflows, e.g. for W49N or for W28A (Fig. 11,Gusdorf et al. (2014)). Nevertheless the velocity integrated [C ii] signal from the massive star forming regions is always positive. W33A is the most extreme case since the [C ii] emission almost vanishes at the HIFI map center as illustrated in Fig. 18. The presence of diffuse material in the foreground leads to absorption of the background emission. At the PACS spectral resolution, the resulting [C ii] signal in the central spaxel can appear either in absorption (towards W49N) or in emission (towards W51) depending on the relative strengths of the emission and absorbing signals. This shows the need for a sufficient spectral resolution to separate the different contributions to the [C ii] signals in sources with a complex velocity structure.
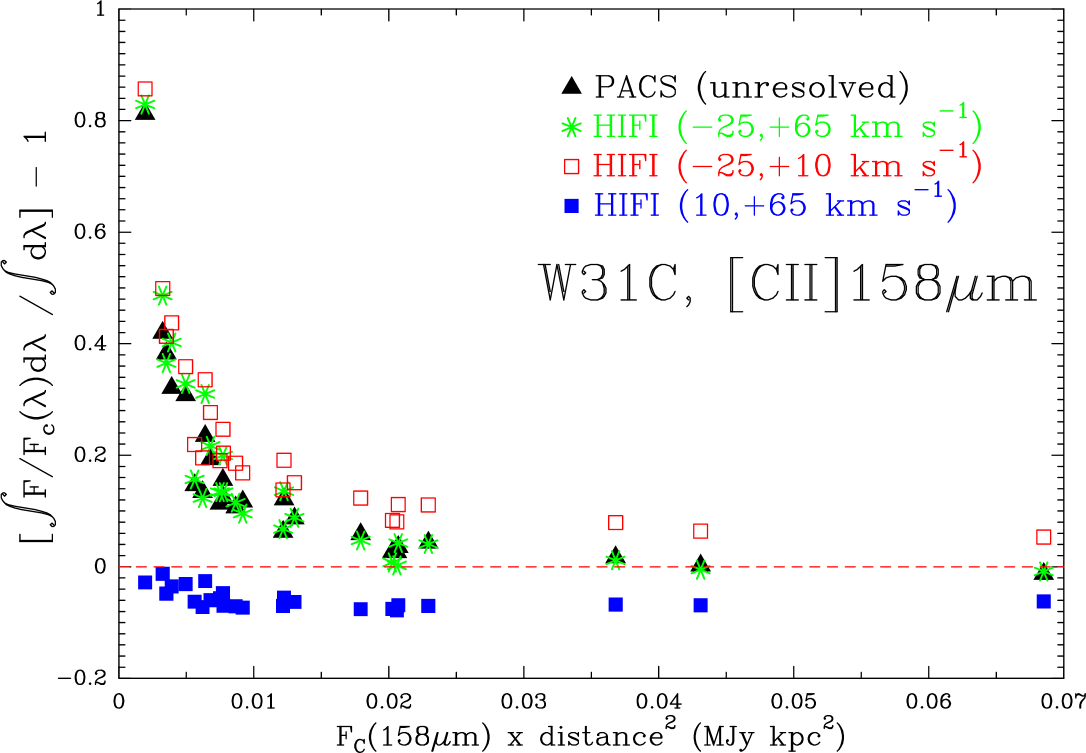
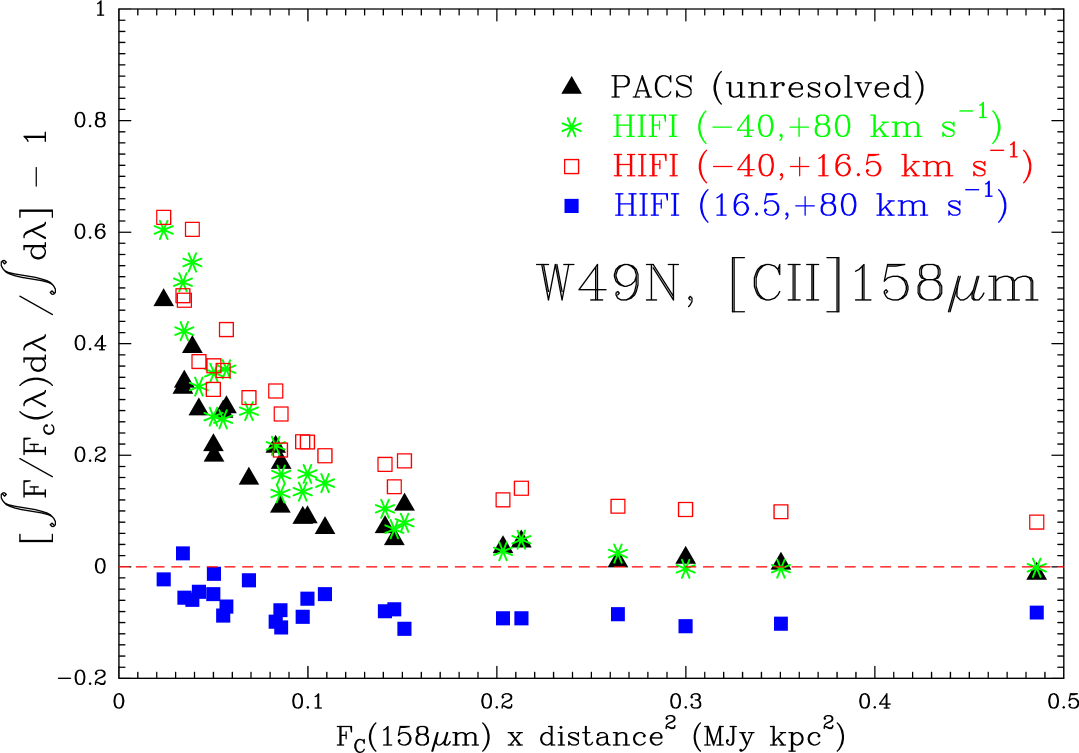
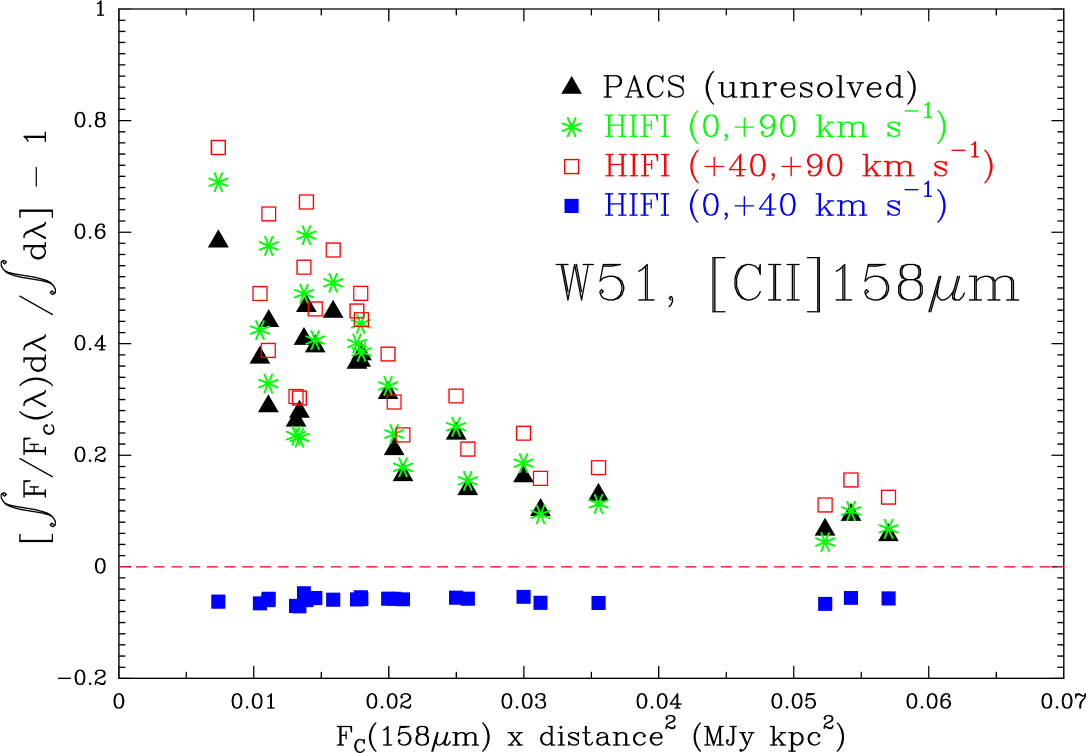
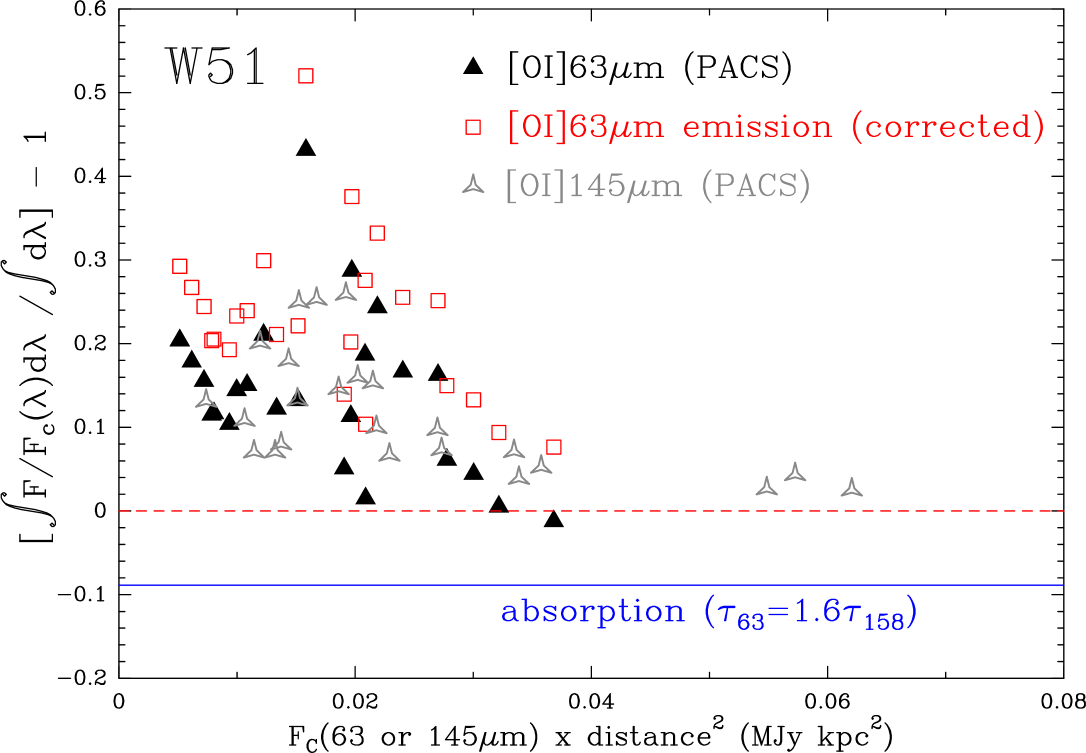
The [C ii] line is used as a tracer of the star formation rate in external galaxies, including distant systems at high redshifts (Stacey et al., 2010). We have used the present data to estimate the [C ii] emission relative to the far infrared continuum in the three massive star forming regions W31C, W49N and W51. As explained above, the PACS [C ii] and [O i] data could be corrected from the low level emission from the OFF position for these three sources only. The data are shown in Figure 6 in which each PACS spaxel is displayed as an independent point. For each source the PACS data where the contributions from the source and the foreground absorption are merged are shown as black squares, and the same quantity measured by HIFI as green stars. The HIFI data allow separation of the intrinsic source contribution (empty red squares) and the absorption from the foreground gas (filled blue squares with negative values). In all plots the horizontal scale is the product of the spaxel flux by the distance to the source, with the low values on the left side corresponding to the map edges and the high values on the right side to the continuum peak associated with the massive star forming region. The vertical scale is the relative [C ii] emission , defined as
| (1) |
To compute from the PACS observations we used a wavelength window of m starting at 157.5 m and ending at 158.0 m . This wavelength interval is broader than the intrinsic line widths and comparable to the full frequency bandpass of the HIFI band 7 receiver.
As both the line and continuum values are detected with the same instrument, is independent of calibration errors or uncertainties in the PSF. The ratio of the [C ii] line luminosity , to the far infrared luminosity can be simply derived from and depends weakly on the shape of the far infrared spectral distribution of the source. Using infrared emission spectra computed with the Draine & Li dust model (Draine & Li, 2007) and choosing the parameters appropriate to our sources, we determine
| (2) |
The data for W31C, W49N and W51 show an excellent agreement between the unresolved data from PACS and the velocity resolved HIFI data. The dip in [C ii] detected in the PACS maps towards W49N and W31C is fully explained by the foreground absorption. These plots also confirm the constancy of the absorption across the extent of the PACS map as the blue points fall nearly on a horizontal line. The slight decrease of the absorption at lower continuum flux is likely to reflect the competition between the weak emission filling in the absorption at lower continuum fluxes, as expected from the physical conditions along these sight-lines (see below).
It is also interesting to notice that the intrinsic emission from the massive star forming regions presents a strong spatial variation of their relative [C ii] emission, from at the map edges down to at the peak of the far infrared emission, or from down to . This behavior is reminiscent of the deficit in [C ii] emission observed in compact and luminous infrared galaxies such as Arp 220 or NGC 4418 (Graciá-Carpio et al., 2011) with deeply embedded star forming regions and possible Active Galactic Nuclei. As for massive star forming regions, the heating sources are deeply embedded in large dust column densities. Therefore the emerging signal in the fine structure lines is heavily dependent on the geometry of the heating radiation relative to the location of the dense molecular gas, and the emergent intensity can be severely attenuated. The presence of absorption by a foreground layer, as in the PRISMAS sources, will also contribute to dimming the emergent [C ii] signal, especially at low spectral resolution.
3.2.1 Diffuse ISM absorption toward NGC 4418
To illustrate the effect of foreground absorption, we have used the recent H I absorption observations towards the NGC 4418 galaxy nucleus (Costagliola et al., 2013) to evaluate the [C ii] line opacity associated with the foreground absorption. The HI spectrum presents two components with total column densities of and . Assuming that the gas producing the HI absorption is diffuse, it is expected to produce an absorption signal in [C ii] as well. We can estimate the magnitude of this absorption from the HI column densities using a carbon to hydrogen abundance ratio of 10-4. These numbers lead to expected integrated line opacities of and for the [C ii] line associated with each velocity component. To further estimate the impact of this absorption, we use the measured line widths of 130 and 160 to derive the relative emission as defined in Eq.1, and obtain -0.04 and -0.11. Note that the figures are negative because they correspond to absorption. We therefore obtain comparable figures for the absorption caused by the diffuse gas along the line of sight to massive star forming regions, and for the diffuse gas in the foreground of NGC 4418 nucleus. This simple example shows that the interpretation of low [C ii] emission, or even of the non detection of [C ii], in luminous infrared galaxies is difficult. The presence of absorption lines, either from HI in the centimeter domain, or molecular lines in the far infrared domain should be used as a warning for the possibility of a [C ii] absorption, which would affect the emission from the dense star forming regions. In that case the use of classical PDR modeling to interpret the detected signal should be done with caution. A detailed knowledge of the source geometry and its environment is needed to obtain meaningful results.
3.3 Atomic Oxygen fine structure lines
While the discussion is focused on [C ii], it should be noted that the presence of foreground absorption is expected to affect the [O i] line at 63 m even more severely than [C ii], as this line is expected to have a larger opacity for the same total hydrogen column density. Indeed, using a carbon to hydrogen ratio of , an oxygen to hydrogen ratio of (Sofia et al., 2004), the spectroscopic parameters listed in Table 2, and assuming low excitation as appropriate for diffuse gas, we obtain O I = 1.6 .
Spectrally resolved line profiles of the [O i] 63 m line are clearly needed to accurately evaluate the impact of foreground absorption, or self-absorption in the sources themselves.
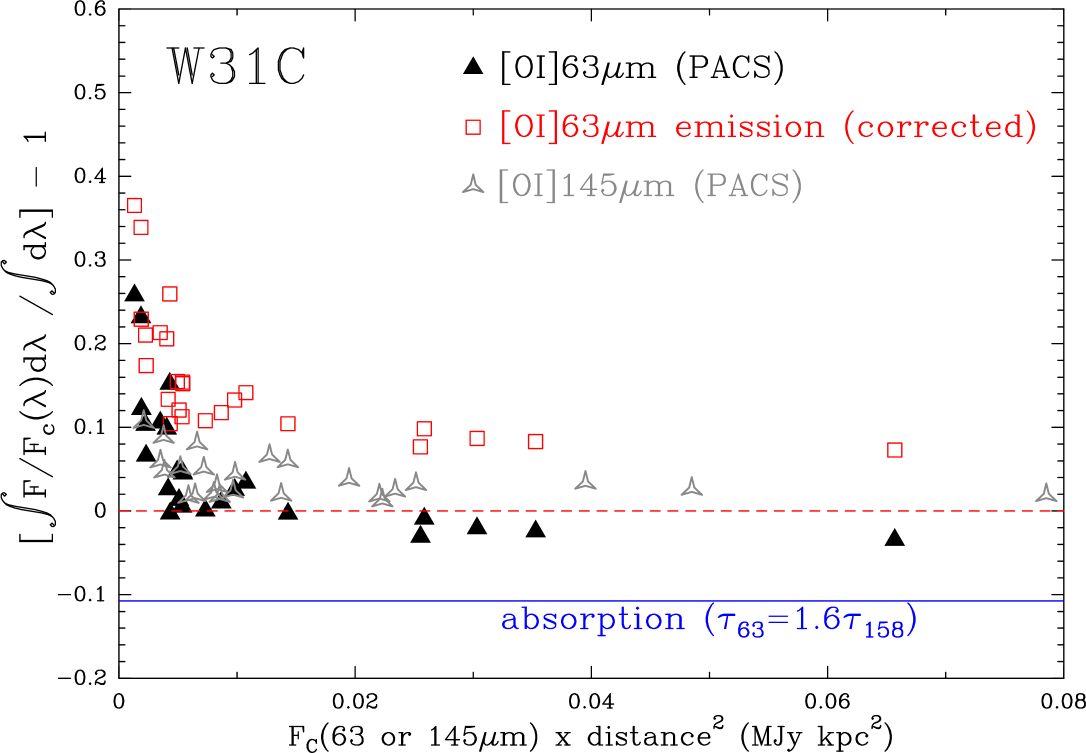
Using the PACS data shown in Fig 4, we have computed the relative emission of the [O i] fine structure lines at 63 m and 145 m, as a function of the continuum luminosity at the same wavelength. The relative emission for both oxygen lines is defined as in Eq.1. 444 To compute from PACS observations we used a wavelength window of m for [C ii], 0.45 m for [O i145] and 0.2 m for [O i63], with the following lower and upper limits: 157.50 – 158.00 m for [C ii], 63.28 – 63.08 m for [O i63], and 145.30 – 145.75 m for [O i145]. These wavelength intervals are broader than the intrinsic line widths. In a similar manner as for [C ii], the relative [O i] line emission can be related to the ratio of the the line luminosity to the far infrared luminosity ratios, but with different scalings. We obtain
| (3) |
and
| (4) |
Figure 7 presents the relative emission of the [O i] lines for the W31C, W49N and W51 sources. In this figure the black triangles show the data for the ground state line at 63 m and the gray symbols those for the excited line at 145 m. As expected from the [C ii] behavior, and the larger opacity of the [O i] 63m line, the oxygen maps show an even stronger effect of the absorption by the foreground gas than do the [C ii] maps. To evaluate the effect of the foreground gas and restore the intrinsic emission from the background source, we have estimated the absorption caused by the foreground gas using the mean value of the [C ii] absorption, scaled by 1.6, the ratio of the line opacities for the adopted carbon and oxygen abundances. It is shown as a blue line in Fig 7. The corrected points are shown as empty red squares. While the original PACS [O i] data at 63 m present either a pure absorption (negative ), or a weak [O i] emission comparable to that of the [O i] 145 m line, the corrected points are always positive, with stronger than . For the massive sources, ranges from at the edge of the observed regions with moderate far infrared emission down to at the peak of the far infrared emission. thus decreases from down to .
This shows that in a situation where a bright source is observed through a foreground of diffuse gas, the use of the [O i] 63 m line alone for quantitative models is not recommended either. Line ratios comparing the two fine structure lines of oxygen at 63 and 145 m, or [O i] with [C ii] will need to be corrected for absorption before being of quantitative use. Luminous infrared galaxies showing a [C ii] deficit are also expected to be deficient in the 63 m [O i] line if the deficit is caused by a foreground layer of diffuse gas.
3.4 C+ Column densities
The spectroscopic parameters of the detected lines are summarized in Table 2. The C+ column density of the diffuse gas can be obtained from the velocity integrated absorption through the relationship
| (5) |
where is the partition function at the excitation temperature (), is the Einstein coefficient listed in Table 2, and is the line frequency. As discussed by Goldsmith et al. (2012), the excitation temperature of [C ii] is significantly lower than the kinetic temperature in the diffuse gas because the densities are too low to produce a collisional excitation rate comparable to the spontaneous decay rate. For lower than , the above expression can be written
| (6) |
The above limit in the excitation temperature corresponds to a fraction of C+ ions in the ground state larger than 95%. At higher excitation temperatures, equation 6 underestimates the C+ column density.
In the diffuse interstellar gas, C+ is the gas phase carbon reservoir. The total gas column density can therefore be derived, assuming that the gas phase carbon abundance relative to hydrogen is constant. Using the value derived by Sofia et al. (2004), , we obtain :
| (7) |
This formula shows the excellent sensitivity of the absorption measurements that allow the detection of low column density regions, corresponding to 0.05 magnitudes of visible extinction.
3.5 Atomic carbon column densities
For neutral carbon, most spectra show pure emission, the sole exception being the 40 velocity feature in the spectrum towards W49N. In LTE the atomic carbon column densities can be derived from the expression appropriate for emission,
| (8) |
where is the main beam temperature of the ground state fine structure line at 492 GHz. This formula assumes that the emission is optically thin and the level populations can be described by a single excitation temperature, . It is accurate within 10% for . The column density is underestimated for higher or lower values of , especially at the lower end where the populations of the excited levels become very small. This may be the case for instance in low density diffuse neutral gas. Therefore we performed statistical equilibrium calculations to derive the atomic carbon column densities, using the column density derived from the LTE formula as a lower limit.
The velocity feature at towards W49N deserves a specific analysis because it shows up in absorption in the line at 809 GHz, but is not detected neither in emission nor in absorption in the line at 492 GHz. This behavior corresponds to the very special case where the excitation temperature of the ground state line is equal to the apparent continuum value of the background source. At 809 GHz, the rise of the thermal dust continuum emission results in a higher continuum temperature than the line excitation temperature, hence the appearance of an absorption line.
The radiative transfer equation for a plane parallel isothermal cloud located in front of a background continuum source producing a continuum antenna temperature can be written
| (9) |
where . In this formula the first term represents the absorption of the background radiation and the second one the emission of the plane parallel foreground cloud. These two terms can partially cancel each other, with the emission filling in the absorption. In the situation that , equation 9 yields and the foreground cloud becomes invisible. For W49N, the continuum value at 492 GHz, expressed in main beam temperature units, is . This translates to an excitation temperature of . Such a low excitation temperature is consistent with the presence of cold molecular gas, in agreement with the detection of deep absorption in CN, NH3 and H13CO+ (Godard et al., 2010; Persson et al., 2012). Indeed, as discussed by Tatematsu et al. (1999), the 492 GHz [C i] line is almost thermalized at the edges of dense molecular cores. The carbon column density for this particular feature is derived from the line using , . This large value is consistent with the strong H13CO+ absorption (Lucas & Liszt, 2000) and confirms that this feature is associated to translucent material (A mag) rather than diffuse gas (A mag).
3.6 Physical conditions from the [C ii] data
The combination of the emission and absorption allows us to derive the excitation conditions of ionized carbon since it provides both the line opacity and peak temperature. Following Goldsmith et al. (2012) we have derived the excitation temperature for the velocity components detected both in absorption and in the OFF emission spectra. The well–known equations in the case that the foreground gas is uniform in terms of excitation temperature and optical depth are:
| (10) |
| (11) |
| (12) |
where and ) are defined above. ON - OFF spectrum provides the line opacity. This can then be used to analyze the OFF emission spectrum, which yields since the opacity is known. Given the large separation of the C+ fine structure levels, 92 K, the modest density and column density of the diffuse medium produces only weak emission, typically at the 0.5 K level. The OFF position spectra displayed in the bottom panel of Fig. 1 and Fig 11 to 29 indeed show emission at this level in the same velocity range as the prominent absorption detected in the ON source spectra.
The derived optical depths and excitation temperatures are given in Table 4. Despite the range in [C ii] opacities, the excitation temperatures cluster around the median value of and a mean value of . The weak feature towards W3-IRS5 has been omitted from this average as the S/N ratio is poor and the accuracy of the opacity determination is lowered by the presence of base line undulations.
The derivation of the excitation temperature relies on several hypotheses. In particular it assumes that the same component is responsible for the emission and absorption. It therefore ignores possible contribution of the warm ISM phases, the Warm Neutral Medium (WNM) and the Warm Ionized Medium (WIM) to the [C ii] signals. Although weaker than the CNM features, emission from the WIM has been detected by Herschel (Velusamy et al., 2012) at a level comparable to the features discussed here. The WNM is not expected to produce emission features given the low densities and electron fraction, but could contribute to the broad absorption features, and therefore lead to an overestimate of the line opacity. In this case, the excitation temperatures could be slightly underestimated.
The expected opacity from a WNM feature can be estimated from the average physical conditions of this phase as derived by Heiles & Troland (2003). The mean density , and the average HI column density per kpc of . With a C+ fractional abundance of , the corresponding C+ column density is kpc-1, corresponding to an integrated line opacity of kpc-1. The line width is constrained by the typical velocity gradient along a sight-line through the Galactic Plane, about per for the considered Galactic longitudes, and by the turbulent and thermal broadening, to be , hence the maximum opacity of each feature is .
A similar calculation holds for the WIM, with an expected higher C+ abundance given the partial destruction of dust grains in hot gas. This simple calculation therefore shows that the warm phases make only a minor contribution to the absorption, except for long path-lengths in velocity–crowded regions. They may contribute to the weak and broad absorption features detected between the deep and narrow features. This minor contribution with will not affect the determination of the excitation temperature except for the most optically thin features.
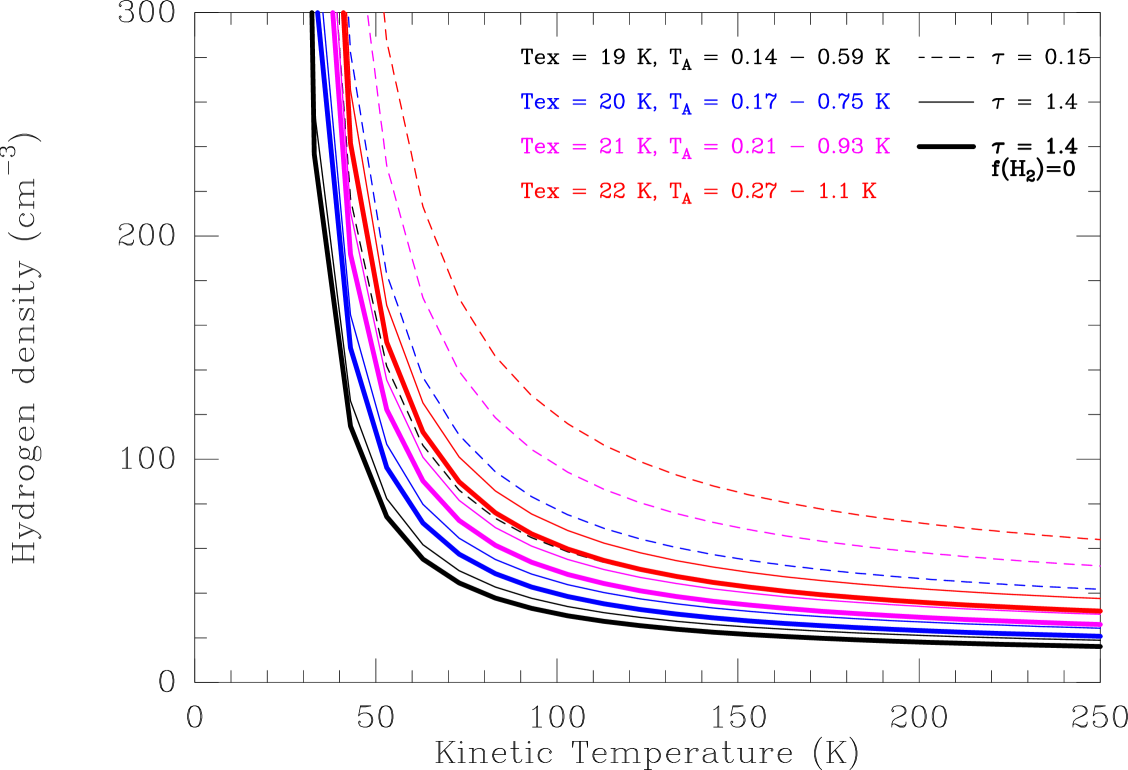
Figure 8 presents loci of constant excitation temperature of the [C ii] transition in the diffuse ISM taking into account collisions with H, H2 and electrons. In these calculations, the electron fraction is set to (Draine, 2011), about twice the adopted gas-phase elemental carbon abundance and two hypothesis have been made for the relative fractions of atomic and molecular hydrogen : pure atomic hydrogen or equal amounts of H and H2. For a typical kinetic temperature of 100 , the mean excitation temperature derived above (20.4 K) corresponds to gas densities between 40 and 80 depending on the [C ii] line opacity and the fraction of hydrogen in molecular form. These conditions clearly correspond to those of the diffuse ISM and confirm that the bulk of the detected [C ii] emission and absorption is consistent with diffuse gas.
| Source | Width | Area | ||||
|---|---|---|---|---|---|---|
| () | () | () | () | () | ||
| W28A | [15;25] | |||||
| W31C | [15;30] | |||||
| [30;50] | ||||||
| G34.3+0.15 | [10;20] | |||||
| [20;40] | ||||||
| W49N | [10;50] | |||||
| [50;70] | ||||||
| W51 | [1:10] | |||||
| [16:35] | ||||||
| DR21(OH) | [5;25] | |||||
| W3-IRS5 | [-25;-15] | |||||
| [-15;15] |
a The optical depths are determined from the ON and OFF difference spectra with assumption of uniform foreground gas; see text.
We have used the HI Galactic Plane survey (McClure-Griffiths et al., 2009; Kalberla et al., 2005, 2010) and new JVLA data (Winkel et al., 2014) to obtain the gas kinetic temperature and have derived the volume densities () from the C+ excitation temperature using the relationship
| (13) |
In this formula, , is the escape probability, which can be estimated from the line opacity (), and is the collisional de-excitation rate coefficient so that . We neglect the effect of any background radiation field on the excitation as the CMB and other contributions in the diffuse ISM are likely unimportant at the frequency of the [C ii] line. The [C ii] excitation is computed using the collisional cross sections for atomic and molecular hydrogen, helium, and for electrons. We have assumed that all carbon is ionized with a gas-phase carbon abundance of (Sofia et al., 2004). This leads to an electron abundance taking into account all sources of electrons (Draine, 2011) . We used the collisional cross sections summarized by Draine (2011). The results are displayed in Table 5. They apply to the absorption signals, for which the atomic and molecular column densities have been derived (Godard et al., 2012). Atomic and molecular hydrogen have only slightly different [C ii] collision rate coefficients (Wiesenfeld & Goldsmith, 2014), so the molecular H2 fraction is not very important for determining the excitation of the [C ii] fine structure line.
The median density derived from the [C ii] data is cm-3 and the mean value, ignoring the W3-IR5 sight-line is cm-3. The thermal pressure ranges from to with a median value of . In addition to the gas density, Table 5 also lists the ionized carbon column density N and the kinetic temperature derived from the H I data.
| Source | Width | a | b | c | d | Lengthe | Filling | |||
|---|---|---|---|---|---|---|---|---|---|---|
| (1018 | factorf | |||||||||
| () | () | () | ) | () | (cm-3) | (pc) | () | (%) | ||
| W28A | [15;25] | 100 | 0.51 | 24 | 1.1 | 2 | ||||
| W31C | [10,23] | 105 | 0.68 | 85 | 1.5 | 6 | ||||
| [23,34] | 100 | 0.74 | 116 | 0.9 | 13 | |||||
| [34,61] | 90 | 0.45 | 107 | 1.3 | 8 | |||||
| G34.3+0.15 | [8,20] | 95 | 0.52 | 18 | 0.85 | 2 | ||||
| [20,35] | 85 | 0.34 | 30 | 1.0 | 3 | |||||
| W49N | [25,50] | 90 | 0.51 | 43 | 1.8 | 2 | ||||
| [50,80] | 100 | 0.59 | 134 | 2.6 | 5 | |||||
| W51 | [1,10] | 90 | 0.55 | 13 | 0.7 | 2 | ||||
| [10,16] | 150 | 0.19 | 6 | 0.5 | 1 | |||||
| [16,35] | 130 | 0.06 | 11 | 1.5 | 1 | |||||
| DR21OH | [0,20] | 95 | 0.61 | 81 | 0.9 | 9 | ||||
| W3-IRS5 | [-25;-15] | 40 | 0.52 | 0.7 | 0.9 | 0.07 |
a is the C+ column density in the diffuse gas along the line of sight to the background sources, computed for the given LSR velocity interval. b HI data from the Galactic Plane survey http://www.astro.uni-bonn.de/hisurvey/profile/index.php , and from Winkel et al. (2014). c is the fraction of hydrogen in molecular form. d is the gas density. e is the total size of the CNM absorption features in the considered velocity interval. f is the filling factor of the CNM absorption features in the considered velocity interval.
3.7 Physical conditions from the [C i] data
To analyze the C i observations, we used the offline version of RADEX, a radiative transfer code based on the escape probability approximation (van der Tak et al., 2007). For each velocity component, we compared the observed line intensities to predictions obtained from a grid of RADEX models covering a pre-defined set of input parameters. The observed quantities include, for each velocity component, the integrated intensity of the C i () line, as well as that of the () transition, whenever observed. In the most favorable cases, we thus could use both the () integrated intensity value and the () to () integrated intensity ratio. In cases where the line was not detected, we used the integrated intensity and a lower limit to the integrated intensity ratio () to (). In cases where the ()) line was not observed, we used only the () integrated intensity. We also determined the line width, , and the peak temperature for each velocity component, from Gaussian fits over the observed spectral range.
The radiative transfer calculations were performed using collisional rates with ortho and para H2, H, H+, He and electrons (Schröder et al., 1991; Launay & Roueff, 1977; Roueff & Le Bourlot, 1990; Staemmler & Flower, 1991; Johnson et al., 1987). For the model grid, the equivalent temperature of the background radiation field was set to the microwave background field, K. The grid covers a range of gas densities from 10 to 1000 cm-3, a range of kinetic temperatures from 40 to 200 with eight values for and six for , corresponding to the parameters of the diffuse gas. We also sampled the effect of the composition of the gas by computing models for three values of the fraction of hydrogen in molecular form , and of the total column density of carbon using eight values of the C column density: cm-2. As for the [C ii] excitation calculations, we assumed that C+ is the main reservoir of carbon in these clouds, hence the electron density is derived from the total density using the same carbon abundance relative to hydrogen as above : ). The helium density is set to 10% of the hydrogen density and the H+ density is set to its minimum value . We have checked that increasing the electron density to and the proton density to does not change the model predictions for neutral carbon fine structure lines. For each velocity component, the observed quantities were compared to the appropriate model results. The fits are reported in Table 6 and illustrated in Fig. 9.They make use of the kinetic temperature derived from the HI data. Since collisional excitation rates with atomic hydrogen are larger than those with molecular hydrogen, the derived physical parameters show a clear dependence on the fraction of gas in molecular form. We have used the available information on the fraction of hydrogen in molecular form to select the best fit models. For about half of the velocity components, the fits are not well constrained and a broad interval of gas pressures is consistent with the data, while the range of best fit gas pressures is relatively narrow for a second half of the models. The pressure distribution is bimodal with about two thirds of the velocity components with pressures values ranging between and , and the remaining components with significantly larger pressures. As the excitation analysis of the carbon lines does not return a single pressure value but rather an interval of acceptable values, we have derived the range of pressures using the median values of the minimum and maximum pressure values for each velocity component. We derive a pressure range of , which is consistent with the median pressure value derived from the analysis of the [C ii] data.
| Source | VLSR(1)1(1)(1)1(1)footnotemark: | Width(1)1(1)(1)1(1)footnotemark: | (1–0)(2)2(2)(2)2(2)footnotemark: | (2–1)(2)2(2)(2)2(2)footnotemark: | N(C) | ||
|---|---|---|---|---|---|---|---|
| () | () | () | () | (1016) | () | (103 ) | |
| W28A | 20 | 4.0 | 4.401.20 | (3)3(3)(3)3(3)footnotemark: | 20 - 200 | 0.7 - 11 | |
| 24 | 1.5 | 0.600.30 | (3)3(3)(3)3(3)footnotemark: | 1.81.3 | 40 - 1000 | 1.0 - 100 | |
| W31C | 16.5 | 5.0 | 0.870.09 | (4)4(4)(4)4(4)footnotemark: | 21 | 40 - 400 | 2.2 - 34 |
| 17.5 | 3.5 | 0.840.08 | 0.160.02 | 40 - 70 | 2.2 - 3.4 | ||
| 23 | 3.5 | 1.330.13 | 0.410.04 | 200 - 400 | 11 - 20 | ||
| 24.5 | 1.5 | 0.530.05 | 0.240.02 | 400 - 1000 | 22 - 29 | ||
| 27.5 | 2.5 | 2.700.27 | 0.630.06 | 70 - 200 | 4.4 - 7.2 | ||
| 30 | 2.5 | 2.300.23 | 0.590.06 | 70 - 130 | 5.5 - 9.4 | ||
| 34 | 5.0 | 2.000.20 | 0.430.04 | 40 - 70 | 2.2 - 3.5 | ||
| 37.5 | 4.0 | 1.590.16 | (4)4(4)(4)4(4)footnotemark: | 102 | 20 - 40 | 0.9 - 1.5 | |
| 41 | 2.5 | 0.830.08 | (4)4(4)(4)4(4)footnotemark: | 31 | 40 - 70 | 1.7 - 2.2 | |
| 45 | 1.5 | 0.240.02 | (4)4(4)(4)4(4)footnotemark: | 0.750.25 | 40 - 200 | 1.7 - 8.4 | |
| W33A | 24 | 2.5 | 1.350.28 | – | 40 - 200 | 2.7 - 7.8 | |
| G34.3 | 27 | 1.5 | 0.560.06 | 0.510.05 | 0.750.25 | 1000 | 90 - 100 |
| 47.5 | 1.5 | 0.440.04 | (3)3(3)(3)3(3)footnotemark: | 0.750.25 | 130 - 200 | 9 - 13 | |
| W49N | 51 | 1.5 | 0.070.02 | (4)4(4)(4)4(4)footnotemark: | 0.50.2 | 40 - 70 | 1.2 - 2.0 |
| 54.5 | 3.5 | 0.350.04 | 0.060.01 | 70 - 200 | 2.9 - 4.4 | ||
| 59 | 2.5 | 0.510.05 | 0.800.03 | 21 | 40 - 200 | 1.5 - 7.5 | |
| 63 | 2.5 | 1.400.14 | 0.530.05 | 21 | 200 - 1000 | 12 - 26 | |
| 40(5)5(5)(5)5(5)footnotemark: | 100 - 600 | 3.0 - 4.5 | |||||
| DR21(OH) | 9 | 2.5 | 3.400.34 | – | 20 - 130 | 0.65 - 4.5 | |
| 13.5 | 3.5 | 0.570.06 | – | 2.01 | 40 - 400 | 1.3 - 11 | |
| W3-IRS5 | -21 | 1.0 | 0.110.01 | – | 40 - 70 | 1.3 - 2.0 |
4 Discussion
4.1 Gas pressure
Figure 9 presents histograms of the pressure derived from the [C II] and [C I] data. We show histograms of the minimum and maximum pressure compatible with the [C I] data given the wide range of acceptable solutions.
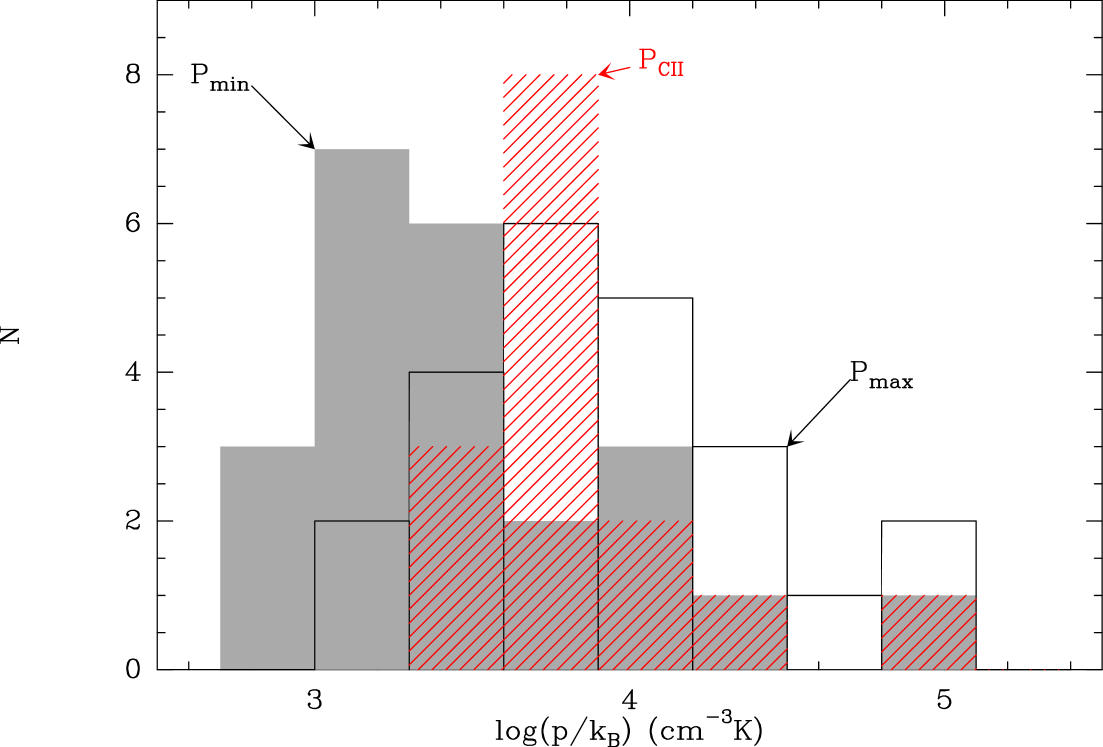
It is encouraging to see that the independent analysis of the C and C+ excitation lead to similar physical conditions for the diffuse interstellar gas in the Galactic plane. The median pressure derived from the velocity components detected in emission is K for [C ii] and K for the [C i] velocity components. There is a slight tendency for to decrease with increasing , as more opaque lines reach higher excitation temperatures for a given density. This shows that the emission data may be slightly biased towards the high pressure regions. In addition, the regions with larger fractions of molecular gas tend to have slightly higher pressures than do the more atomic components. The pressures derived from the neutral carbon emission lines can be biased towards relatively dense regions because the ionization equilibrium is driven to higher C/C+ ratio at higher densities. Because of the more efficient collisional excitation of atoms and ions, higher pressure regions are also more likely to produce line emission than low pressure regions. The true median pressure may therefore be slightly lower than the median value, and closer to the lower bound of our pressure determination, K.
The median density derived from the [C ii] data is 60 . These figures are very comparable to the physical conditions of the diffuse ISM in the solar neighborhood, determined from UV absorption measurements (Jenkins & Tripp, 2011; Goldsmith, 2013). The average pressure is also consistent with the theoretical predictions for a Galacto-centric radius of 5 (Wolfire et al., 2003).
Interestingly these density and pressure conditions are also those of the low density gas responsible for the strong CH+ absorption features (Falgarone et al., 2010a; Godard et al., 2012). Models of the chemistry triggered by turbulent dissipation reproduce the observed CH+ column densities in the diffuse medium if the dissipation bursts occur in the CNM (Godard et al., 2009, 2014). The association with the CNM is further supported by the close similarity of the velocity profiles of the CH+ and [C ii] absorption lines in the diffuse ISM (Falgarone et al., 2010b).
We conclude that the main phase responsible for the foreground absorption is the so-called cold neutral medium. The diffuse medium in this phase has a broad range of content of molecular gas, from nearly pure atomic gas up significant amounts of molecular gas (Godard et al., 2012; Winkel et al., 2014). The CNM is also responsible for the diffuse [CII] emission of the Galactic plane.
4.2 Filling factor
The knowledge of the median density and total gas column allows us to derive the average (1-dimensional) filling factor of this diffuse component along the sampled sight-lines. The length and filling factor of the CNM absorption features are listed in Table 5. These figures have been derived using the total gas column N, the mean fraction of gas in molecular form , and the distance along the line of sight in a given velocity interval as
| (14) |
and
| (15) |
In these formulas, represents the total length along the line of sight of each velocity feature and is computed from the Galactic rotation curve assuming a flat rotation curve with and a distance to the Galactic Center, of 8.5 . In the first Galactic quadrant and for , the distance along the line of sight can be written as
| (16) |
where the signs refer to the near and far distance branches and is the distance to the Galactic center. is determined from assuming circular motions,
| (17) |
For the studied lines of sight, the mean distance gradient produced by the rotation curve is about 100 pc per . Since the velocity features we studied are broader than 1 , they are likely not to be associated with a single and coherent entity but most likely result from the superposition of several individual “CNM cloudlets”. The derived density and temperatures correspond to the average properties of these “CNM cloudlets”. For all velocity intervals, the combined length along the line of sight of the “CNM cloudlets”, , is significantly smaller than the path-length along the sight–lines to the background sources . The filling factors for the selected velocity intervals range from 0.07 to 13 % with higher filling factors in the largest opacity sight-lines, and a median value of 2.4%. These filling factors have been evaluated along paths of kpc length along the sight–lines to the background sources. The highest values may result from a selection bias as we chose sight-lines known for the presence of foreground absorption and adapted the velocity intervals to the line profiles. Note that the approach we followed to derive the filling factor leads to an upper limit as we assign all the absorbing gas to the CNM. Overall, these figures are consistent with the expected low volume filling factor of the CNM (Heiles & Troland, 2003; Kalberla & Kerp, 2009). These data therefore confirm that although most of the mass resides in the cold phases, these phases occupy a small fraction of the volume of the Galaxy.
The line profiles provide additional information on the spatial distribution of the CNM : for all sources, the [C ii] line profiles show well defined velocity components, which correspond to localized regions in the Galactic plane. Therefore the diffuse medium is not uniformly distributed in space but spatially concentrated, most likely in the spiral arms as found in emission line surveys (e.g. Pineda et al. (2013) for [C ii]).
4.3 Gas phase carbon abundance and C+ in the ISM phases
The C and C+ column densities listed in Tables 5 and 6 show that C+ dominates over atomic carbon in the diffuse gas, although a direct comparison between the velocity components present in emission and absorption is not straightforward. Nevertheless it is possible to compare the total C+ and C column densities along each sight-line. We find N(C)/N(C+) ranging from 1 to 28 %, with a median value of 6 %.
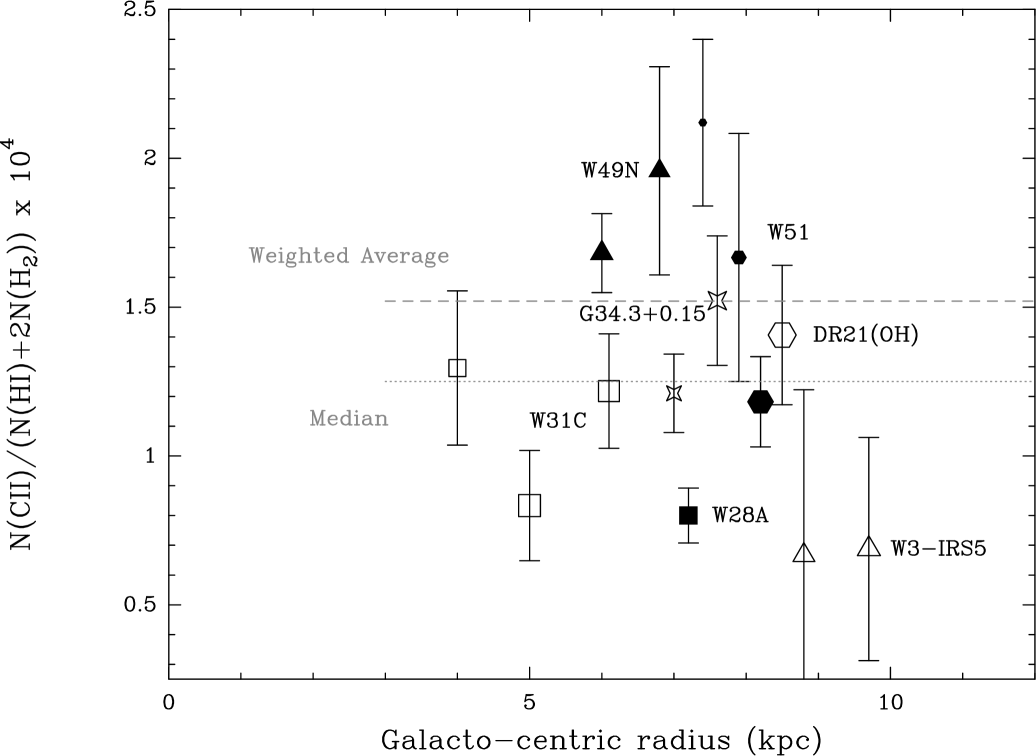
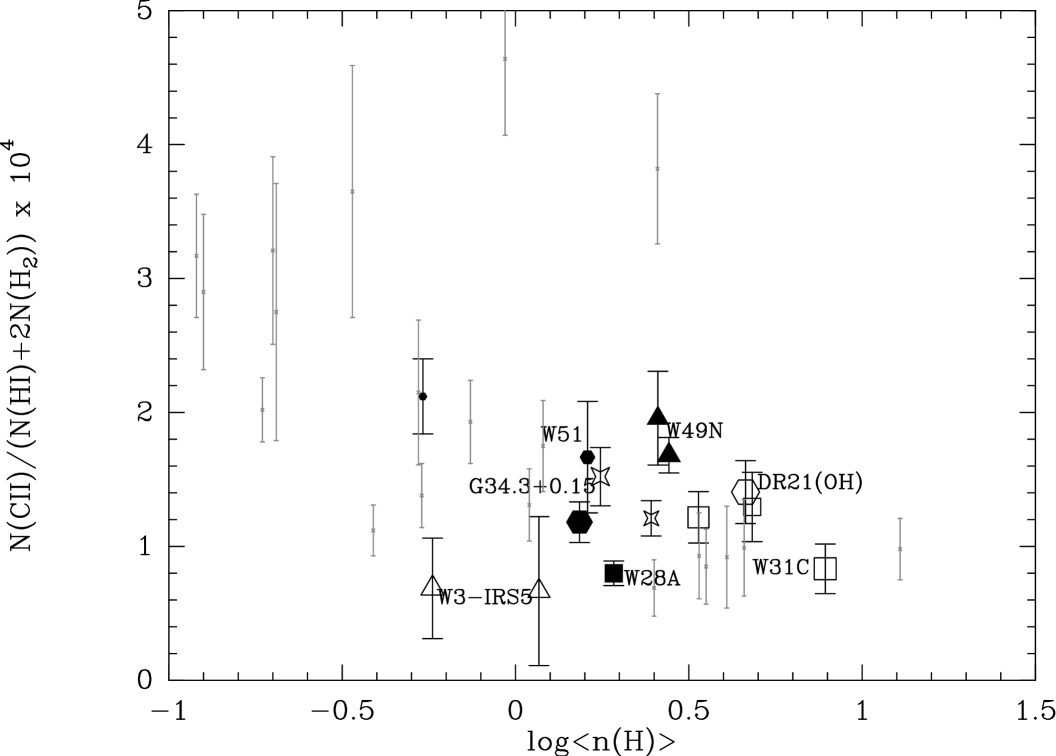
Because the gas-phase carbon abundance has been shown to spatially vary as a consequence of dust grain processing (Parvathi et al., 2012) we have investigated the gas-phase carbon abundance by comparing the derived C+ column densities with independent estimates of the hydrogen column densities derived from HI for the cold atomic gas and CH and HF for the diffuse molecular gas. Figure 10 shows the ratio of the C+ and total hydrogen column densities as a function of Galacto-centric radius. In this figure, the size of the symbol scales with the fraction of gas in molecular form . We do not find any strong effect with . The carbon abundance may be lower towards W3-IRS5 sampling the outer galaxy but the achieved S/N ratio is too low to draw a definitive conclusion. The median value is C/H and the weighted average C/H . The right panel of Figure 10 illustrates how the Herschel values are fully consistent with the measurements derived from FUV absorption lines towards massive stars by Parvathi et al. (2012), especially comparing the same range of average hydrogen densities, , along the lines of sight, namely .
There are several sources of uncertainties in this comparison, which contribute to the observed scatter :
-
•
At large molecular hydrogen column densities, C and CO will make a significant contribution to the carbon budget. We do not expect this effect to be very strong because we do not see any significant effect with and the total atomic carbon column density does not rise above 15% of the total C+ column density except towards W28A.
-
•
The warm interstellar phases may be contributing to the [CII] absorption. Ionized carbon is expected to be present in the Warm Neutral Medium (WNM) and Warm Ionized Medium (WIM). Given the low densities, the excitation of the fine structure line will be moderate, leading to an absorption signal towards a strong continuum source. Additional information from other fine structure lines, [NII] at 205 m and [O i] at 63m, is required to identify the relative contributions of these two warm phases. Herschel HIFI data of the [NII] at 205 m line have been analyzed by Persson et al. (2014), and indeed show absorption towards W31C and W49N confirming the presence of the warm ionized medium along the same sight-lines. The WIM produces an excess [CII] absorption at the 7 - 10% level along both sight-lines.
-
•
The estimations of the molecular hydrogen column densities are based on CH and HF measurements assuming a constant abundance relative to H2. Optical and FUV measurements towards bright stars have shown that the relationship between CH and H2 is linear and exhibits a significant scatter of 0.2dex (Sheffer et al., 2008), larger than the measurement uncertainties, and which probably reflects small variations in the physical conditions along the probed sight-lines. As shown by Levrier et al. (2012), averaging over long path-lengths tends to reduce the scatter, but local variations of the CH abundance relative to H2 cannot be excluded. The same can be true for HF as well.
Overall, the excellent agreement between the gas phase carbon abundance deduced from FUV and FIR data confirms the validity of the derivation of atomic and molecular gas column densities and supports the association of the [C ii] absorption with CNM gas, with minor contributions from the WIM.
4.4 C+ Cooling
For an optically thin line, the cooling rate is proportional to the upper state population, and the cooling rate per C+ ion is given by , where is the fraction of the carbon ions in the upper level of the fine structure transition. The determination of the excitation temperature, , of the [C ii] line allows to compute the C+ cooling of the diffuse medium. The low values from Table 4 indicate that only a few percent of the population is in the upper level. With the excitation temperature known, we can write the energy loss per H nucleon as
| (18) |
Taking the mean [C ii] excitation temperature (Section 3.6), , and assuming that all carbon is in ionized form so that the ratio of the C+ to H column densities is equal to gives
| (19) |
Using a carbon abundance of as derived from the present data, we obtain a cooling rate per H atom about three times larger than the mean value derived by Gry et al. (1992) for local lines of sight and five times larger than the cooling rate for low velocity clouds derived by Lehner et al. (2004) from a 43 object sample. The difference between the FUV and Herschel measurements can be understood as arising from the difference in the environments. The FUV data mostly target gas at high Galactic latitudes in the solar neighborhood while the far infrared Herschel data mainly probe the Galactic plane, where the star formation activity and the heating rate are expected to be larger. The Herschel-derived cooling rate is in very good agreement with the models for and Galacto-centric radii of 5 and 8.5 presented by Wolfire et al. (2003), which include an increase of the heating rate in the inner Galaxy.
5 Conclusion
In this paper we have analyzed high-resolution spectra of the fine structure lines of ionized and neutral carbon, complemented by lower spectral resolution line maps of C+ and O, towards massive star forming regions in the Galactic plane.
-
•
The high spectral resolution data exhibit complex line profiles from the background sources combined with absorption produced by the diffuse interstellar medium along the line of sight. We show that at low spectral resolution this combination leads to very low [C ii] and [O i] signals, which can be wrongly interpreted. We suggest that part of the [C ii] deficit in local luminous infrared galaxies is due to the presence of low density material in the foreground of the compact region producing the far-infrared emission. This diffuse gas component is expected to absorb part of the [C ii] signal from the compact star forming region close to the nucleus. The effect is expected to be even larger for the 63 m fine structure line of oxygen, which has a higher opacity for the same gas column density.
-
•
The Herschel data have been combined with ground based HI data to derive the physical conditions in the diffuse gas. The median pressure is and the median density , for a kinetic temperature of . These properties confirm that the absorbing gas can be associated with the so-called cold neutral medium (CNM). The fraction of hydrogen in molecular form in this gas is highly variable.
-
•
The excitation conditions derived from the [C i] emission data are consistent with those deduced from [C ii]. The atomic carbon column densities remain significantly smaller than the ionized carbon column densities, confirming that C+ is the main carbon reservoir along the lines of sight in most cases.
-
•
The line profiles show that the CNM is not uniformly distributed but follows the Galactic Spiral arms. The comparison of the gas densities and column densities has allowed us to determine the filling factor of the CNM along the lines of sight in the Galactic Plane. The derived median value of the filling factor is 2.4%. This value may be slightly biased upward by the source selection criteria.
-
•
On average, the gas-phase abundance of carbon derived from the comparison of the [C ii] absorption with the sum of the atomic and molecular hydrogen column densities, using CH and HF as tracers of H2, is in good agreement with previous measurements using FUV data, leading to C/H . Some sight-lines may present a small excess [C ii] absorption which indicates that two other ISM phases, the warm neutral medium and the warm ionized medium, may contribute to the [C ii] absorption.
-
•
The [C ii] cooling per hydrogen nucleon in the Galactic plane is ergs-1H-1, in good agreement with predictions from Wolfire et al. (2003).
Acknowledgements.
The Herschel spacecraft was designed, built, tested, and launched under a contract to ESA managed by the Herschel/ Planck Project team by an industrial consortium under the overall responsibility of the prime contractor Thales Alenia Space (Cannes), and including Astrium (Friedrichshafen) responsible for the payload module and for system testing at spacecraft level, Thales Alenia Space (Turin) responsible for the service module, and Astrium (Toulouse) responsible for the telescope, with in excess of a hundred subcontractors. HIFI has been designed and built by a consortium of institutes and university departments from across Europe, Canada and the United States under the leadership of SRON Netherlands Institute for Space Research, Groningen, The Netherlands and with major contributions from Germany, France and the US. Consortium members are: Canada: CSA, U.Waterloo; France: CESR, LAB, LERMA, IRAM; Germany: KOSMA, MPIfR, MPS; Ireland, NUI Maynooth; Italy: ASI, IFSI-INAF, Osservatorio Astrofisico di Arcetri-INAF; Netherlands: SRON, TUD; Poland: CAMK, CBK; Spain: Observatorio Astronmico Nacional (IGN), Centro de Astrobiologa (CSIC-INTA); Sweden: Chalmers University of Technology - MC2, RSS & GARD; Onsala Space Observatory; Swedish National Space Board, Stockholm University - Stockholm Observatory; Switzerland: ETH Zurich, FHNW; USA: Caltech, JPL, NHSC. HIPE is a joint development by the Herschel Science Ground Segment Consortium, consisting of ESA, the NASA Herschel Science Center, and the HIFI, PACS and SPIRE consortia. MG, MR, AG and EF acknowledge support from the Centre National de Recherche Spatiale (CNES). This work was partly funded by grant ANR-09-BLAN-0231-01 from the French Agence Nationale de la Recherche as part of the SCHISM project. J.R.G thanks Spanish MINECO for funding support under grants CDS2009-00038, AYA2009-07304 and AYA2012-32032. M.R. is supported by the 3DICE project, funded by an ERC Starting grant (grand agreement number 336474). NRAO is operated by Associated Universities, Inc. under contract with the National Science Foundation. This work was carried out in part at the Jet Propulsion Laboratory, which is operated by the California Institute of Technology for NASA. We thank the referee, E. Jenkins, for his comprehensive report which helped us to significantly improve this paper.References
- Benz et al. (2010) Benz, A. O., Bruderer, S., van Dishoeck, E. F., et al. 2010, A&A, 521, L35
- Costagliola et al. (2013) Costagliola, F., Aalto, S., Sakamoto, K., et al. 2013, A&A, 556, A66
- de Graauw et al. (2010) de Graauw, T., Helmich, F. P., Phillips, T. G., et al. 2010, A&A, 518, L6
- Draine (2011) Draine, B. T. 2011, Physics of the interstellar and intergalactic medium (Princeston series)
- Draine & Li (2007) Draine, B. T. & Li, A. 2007, ApJ, 657, 810
- Falgarone et al. (2010a) Falgarone, E., Godard, B., Cernicharo, J., et al. 2010a, A&A, 521, L15
- Falgarone et al. (2010b) Falgarone, E., Ossenkopf, V., Gerin, M., et al. 2010b, A&A, 518, L118
- Fish et al. (2003) Fish, V. L., Reid, M. J., Wilner, D. J., & Churchwell, E. 2003, ApJ, 587, 701
- Flagey et al. (2013) Flagey, N., Goldsmith, P. F., Lis, D. C., et al. 2013, ApJ, 762, 11
- Gerin et al. (2010) Gerin, M., de Luca, M., Goicoechea, J. R., et al. 2010, A&A, 521, L16
- Gerin et al. (2012) Gerin, M., Levrier, F., Falgarone, E., et al. 2012, Phil. Trans. R. Soc. A, 370, 5174
- Godard et al. (2010) Godard, B., Falgarone, E., Gerin, M., Hily-Blant, P., & de Luca, M. 2010, A&A, 520, A20
- Godard et al. (2012) Godard, B., Falgarone, E., Gerin, M., et al. 2012, A&A, 540, A87
- Godard et al. (2009) Godard, B., Falgarone, E., & Pineau Des Forêts, G. 2009, A&A, 495, 847
- Godard et al. (2014) Godard, B., Falgarone, E., & Pineau Des Forêts, G. 2014, ArXiv 1408.3716
- Goldsmith (2013) Goldsmith, P. F. 2013, ApJ, 774, 134
- Goldsmith et al. (2012) Goldsmith, P. F., Langer, W. D., Pineda, J. L., & Velusamy, T. 2012, ApJS, 203, 13
- Graciá-Carpio et al. (2011) Graciá-Carpio, J., Sturm, E., Hailey-Dunsheath, S., et al. 2011, ApJ, 728, L7
- Gry et al. (1992) Gry, C., Lequeux, J., & Boulanger, F. 1992, A&A, 266, 457
- Gusdorf et al. (2014) Gusdorf, A., Gerin, M., Goicoechea, J. R., et al. 2014, A&Asubmitted
- Gwinn et al. (1992) Gwinn, C. R., Moran, J. M., & Reid, M. J. 1992, ApJ, 393, 149
- Heiles & Troland (2003) Heiles, C. & Troland, T. H. 2003, ApJ, 586, 1067
- Immer et al. (2013) Immer, K., Reid, M. J., Menten, K. M., Brunthaler, A., & Dame, T. M. 2013, A&A, 553, A117
- Jenkins & Tripp (2011) Jenkins, E. B. & Tripp, T. M. 2011, ApJ, 734, 65
- Johnson et al. (1987) Johnson, C. T., Burke, P. G., & Kingston, A. E. 1987, Journal of Physics B: Atomic and Molecular Physics, 20, 2553
- Kalberla et al. (2005) Kalberla, P. M. W., Burton, W. B., Hartmann, D., et al. 2005, A&A, 440, 775
- Kalberla & Kerp (2009) Kalberla, P. M. W. & Kerp, J. 2009, ARA&A, 47, 27
- Kalberla et al. (2010) Kalberla, P. M. W., McClure-Griffiths, N. M., Pisano, D. J., et al. 2010, A&A, 521, A17
- Kuchar & Bania (1994) Kuchar, T. A. & Bania, T. M. 1994, ApJ, 436, 117
- Langer et al. (2010) Langer, W. D., Velusamy, T., Pineda, J. L., et al. 2010, A&A, 521, L17
- Langer et al. (2014) Langer, W. D., Velusamy, T., Pineda, J. L., Willacy, K., & Goldsmith, P. F. 2014, A&A, 561, A122
- Launay & Roueff (1977) Launay, J.-M. & Roueff, E. 1977, Journal of Physics B Atomic Molecular Physics, 10, 879
- Lehner et al. (2004) Lehner, N., Wakker, B. P., & Savage, B. D. 2004, ApJ, 615, 767
- Levrier et al. (2012) Levrier, F., Le Petit, F., Hennebelle, P., et al. 2012, A&A, 544, A22
- Lis et al. (2001) Lis, D. C., Keene, J., Phillips, T. G., et al. 2001, ApJ, 561, 823
- Lucas & Liszt (2000) Lucas, R. & Liszt, H. S. 2000, A&A, 355, 327
- McClure-Griffiths et al. (2009) McClure-Griffiths, N. M., Pisano, D. J., Calabretta, M. R., et al. 2009, ApJS, 181, 398
- Motogi et al. (2011) Motogi, K., Sorai, K., Habe, A., et al. 2011, PASJ, 63, 31
- Müller et al. (2005) Müller, H. S. P., Schlöder, F., Stutzki, J., & Winnewisser, G. 2005, Journal of Molecular Structure, 742, 215
- Müller et al. (2001) Müller, H. S. P., Thorwirth, S., Roth, D. A., & Winnewisser, G. 2001, A&A, 370, L49
- Neufeld et al. (2010) Neufeld, D. A., Sonnentrucker, P., Phillips, T. G., et al. 2010, A&A, 518, L108
- Normandeau (1999) Normandeau, M. 1999, AJ, 117, 2440
- Ott (2010) Ott, S. 2010, in Astronomical Society of the Pacific Conference Series, Vol. 434, Astronomical Data Analysis Software and Systems XIX, ed. Y. Mizumoto, K.-I. Morita, & M. Ohishi, 139
- Parvathi et al. (2012) Parvathi, V. S., Sofia, U. J., Murthy, J., & Babu, B. R. S. 2012, ApJ, 760, 36
- Persson et al. (2012) Persson, C. M., De Luca, M., Mookerjea, B., et al. 2012, A&A, 543, A145
- Persson et al. (2014) Persson, C. M., Gerin, M., Mookerjea, B., et al. 2014, A&A, 568, A37
- Pineda et al. (2013) Pineda, J. L., Langer, W. D., Velusamy, T., & Goldsmith, P. F. 2013, A&A, 554, A103
- Planck Collaboration et al. (2011) Planck Collaboration, X., Abergel, A., Ade, P. A. R., et al. 2011, A&A, 536, A24
- Poglitsch et al. (2010) Poglitsch, A., Waelkens, C., Geis, N., et al. 2010, A&A, 518, L2
- Roelfsema et al. (2012) Roelfsema, P. R., Helmich, F. P., Teyssier, D., et al. 2012, A&A, 537, A17
- Roueff & Le Bourlot (1990) Roueff, E. & Le Bourlot, J. 1990, A&A, 236, 515
- Rygl et al. (2012) Rygl, K. L. J., Brunthaler, A., Sanna, A., et al. 2012, A&A, 539, A79
- Sanna et al. (2014) Sanna, A., Reid, M. J., Menten, K. M., et al. 2014, ApJ, 781, 108
- Sato et al. (2010) Sato, M., Reid, M. J., Brunthaler, A., & Menten, K. M. 2010, ApJ, 720, 1055
- Schröder et al. (1991) Schröder, K., Staemmler, V., Smith, M. D., Flower, D. R., & Jaquet, R. 1991, Journal of Physics B: Atomic, Molecular and Optical Physics, 24, 2487
- Sheffer et al. (2008) Sheffer, Y., Rogers, M., Federman, S. R., et al. 2008, ApJ, 687, 1075
- Sofia et al. (2004) Sofia, U. J., Lauroesch, J. T., Meyer, D. M., & Cartledge, S. I. B. 2004, ApJ, 605, 272
- Sonnentrucker et al. (2010) Sonnentrucker, P., Neufeld, D. A., Phillips, T. G., et al. 2010, A&A, 521, L12
- Stacey et al. (2010) Stacey, G. J., Hailey-Dunsheath, S., Ferkinhoff, C., et al. 2010, ApJ, 724, 957
- Staemmler & Flower (1991) Staemmler, V. & Flower, D. R. 1991, Journal of Physics B: Atomic, Molecular and Optical Physics, 24, 2343
- Tatematsu et al. (1999) Tatematsu, K., Jaffe, D. T., Plume, R., Evans, II, N. J., & Keene, J. 1999, ApJ, 526, 295
- van der Tak et al. (2007) van der Tak, F. F. S., Black, J. H., Schöier, F. L., Jansen, D. J., & van Dishoeck, E. F. 2007, A&A, 468, 627
- Vastel et al. (2000) Vastel, C., Caux, E., Ceccarelli, C., et al. 2000, A&A, 357, 994
- Vastel et al. (2002) Vastel, C., Polehampton, E. T., Baluteau, J.-P., et al. 2002, ApJ, 581, 315
- Velusamy et al. (2012) Velusamy, T., Langer, W. D., Pineda, J. L., & Goldsmith, P. F. 2012, A&A, 541, L10
- Wiesenfeld & Goldsmith (2014) Wiesenfeld, L. & Goldsmith, P. F. 2014, ApJ, 780, 183
- Winkel et al. (2014) Winkel, B., Menten, K., & et al. 2014, A&A to be submitted
- Wolfire et al. (2003) Wolfire, M. G., McKee, C. F., Hollenbach, D., & Tielens, A. G. G. M. 2003, ApJ, 587, 278
- Xu et al. (2006) Xu, Y., Reid, M. J., Zheng, X. W., & Menten, K. M. 2006, Science, 311, 54
Appendix A Presentation of the Herschel Observations
The individual Herschel observations analyzed in this paper are listed in Table A.1.
| Source | Line | Obs mode | ObsID |
| W28A | [C ii] | DBS | 1342243682; 1342243683 |
| [C ii] | LC-OTF | 1342243684 | |
| [C i] | DBS | 1342216303; 1342216304; 1342216305 | |
| [C i] | LC | 1342218938 | |
| [C i] | DBS | 1342242856; 1342242857 | |
| [C i] | LC | 1342242858 | |
| [C ii] | SED-R1 | 1342217940 | |
| [O i] 63 | SED-B3A | 1342217941 | |
| W31C | [C ii] | DBS | 1342244100 ;1342244101 |
| [C ii] | LC-OTF | 1342244102 | |
| [C i] | DBS | 1342206657; 1342206658; 1342206659 | |
| [C i] | LC | 1342251659 | |
| [C i] | DBS | 1342244106; 1342244107; 1342244108 | |
| [C i] | LC | 1342244109 | |
| [C ii] | SED-R1 | 1342217945 | |
| [O i] 63 | SED-B3A | 1342228531 | |
| W33A | [C ii] | DBS | 1342229846; 1342229847 |
| [C ii] | LC-OTF | 1342229848 | |
| [C i] | DBS | 1342208038; 1342208039; 1342208040 | |
| [C i] | LC | 1342218943 | |
| [C ii] | SED-R1 | 1342239714 | |
| [O i] 63 | SED-B3A | 1342239713 | |
| G34.3+0.15 | [C ii] | DBS | 1342244578; 1342244579 |
| [C ii] | LC-OTF | 1342244580 | |
| [C i] | DBS | 1342219189; 1342219190; 1342219191 | |
| [C i] | LC | 1342231776 | |
| [C i] | DBS | 1342244110; 1342244111; 1342244112 | |
| [C i] | LC | 1342244113 | |
| [C ii] | SED-R1 | 1342209734 | |
| [O i] 63 | SED-B3A | 1342209733 | |
| W49N | [C ii] | DBS | 1342231449; 1342231450 |
| [C ii] | LC-OTF | 1342231451 | |
| [C i] | DBS | 1342206661; 1342206662; 1342206663 | |
| [C i] | LC | 1342244802 | |
| [C i] | DBS | 1342230253; 1342230254; 1342230255 | |
| [C i] | LC | 1342230256 | |
| [C ii] | SED-R1 | 1342207774 | |
| [O i] 63 | SED-B3A | 1342207775 | |
| W51 | [C ii] | DBS | 1342231446;1342231447 |
| [C ii] | LC-OTF | 1342231448 | |
| [C i] | DBS | 1342219179; 1342219180; 1342219181 | |
| [C i] | LC | 1342232813 | |
| [C i] | DBS | 1342230243; 1342230244; 1342230245 | |
| [C i] | LC | 1342230246 | |
| [C ii] | SED-R1 | 1342193698 | |
| [O i] 63 | SED-B3A | 134219697 | |
| DR21(OH) | [C ii] | DBS | 1342220468; 1342220469 |
| [C ii] | LC-OTF | 1342220470 | |
| [C i] | DBS | 1342198320; 1342198321; 1342198322 | |
| [C i] | LC | 1342219171 | |
| [C ii] | SED-R1 | 1342209401 | |
| [O i] 63 | SED-B3A | 1342209400 | |
| W3-IRS5 | [C ii] | DBS | 1342248401 |
| [C ii] | LC-OTF | 1342248400 | |
| [C i] | LC | 1342247845 | |
| [C ii] | SED-R1 | 1342229092 | |
| [C ii] | SED-B3A | 1342229093 |
DBS stands for Double Beam Switch, LC for Load chop and LC-OTF for On The Fly map in Load Chop mode. SED-R1 refers to the SED mode for the red channel of the PACS spectrometer, SED-B3A refers to the blue channel of the PACS spectrometer.
Appendix B Pointed data and spectral maps towards the individual sources
B.1 W28A

.
W28A (G5.89-0.4) is a massive star formation region at a distance of 1.3 (Motogi et al. 2011). The HIFI spectra are shown in Figure 11 and 12. W28A hosts a powerful outflow with prominent velocity wings extending from -40 to 60 Gusdorf et al. (2014). The foreground gas is associated with the absorption feature at in the [C ii] spectrum, and with the emission line at the same velocity in the [C i] spectrum. This gas is probably local. The PACS spectral maps data are presented in Figure 13.

B.2 W31C

W31C(G10.6-0.4) is a massive star forming region located in the Norma arm, at a distance of (Sanna et al. 2014). The foreground material samples the Sagittarius and Scutum-Centaurus arms, in addition to local material. The source velocity is about -2 while the foreground material is detected between and . The HIFI spectra are shown in Figures 14 and 15. The PACS spectral maps near 158m are presented in Figure 16.


B.3 W33A
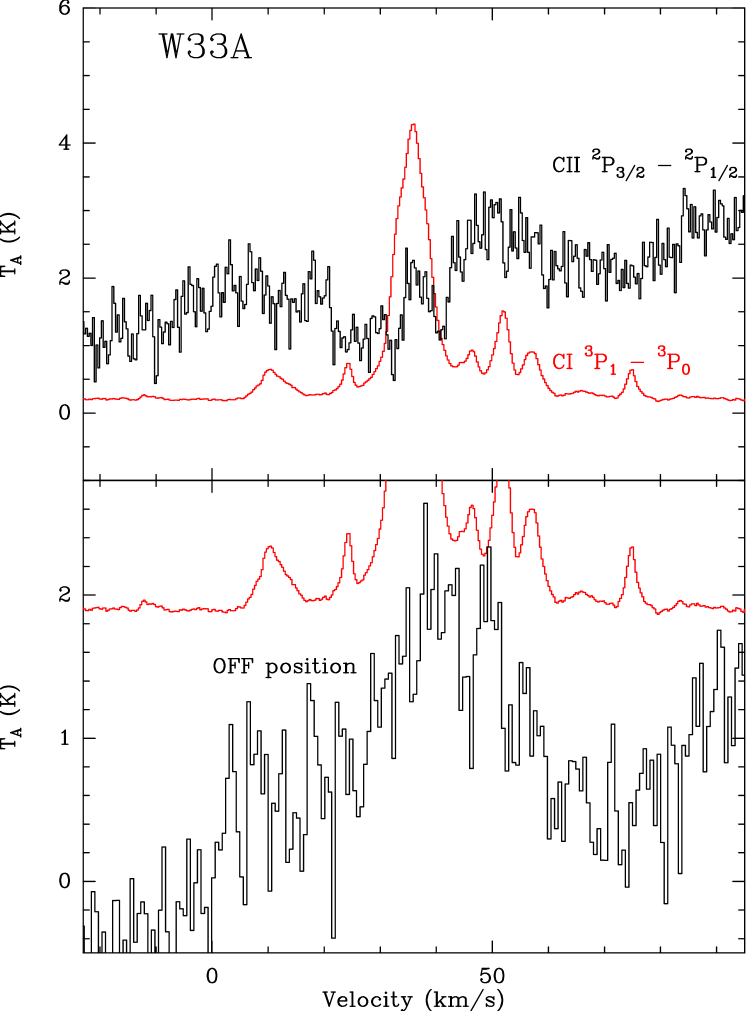

W33A(G12.9-0.3) is a highly embedded massive star at a distance of 2.4 (Immer et al. 2013), with a massive cold envelope. A weak absorption from local foreground gas has been detected in CH+ by Godard et al. (2012) but the sensitivity of the present data does not allow to detect the associated [C ii] feature. The HIFI spectra are shown in Figure 17 and 18. The [C ii] emission from W33A is weak. It is barely detected at the continuum peak but increases as one moves away from the continuum peak. Broad line wings are detected in [C ii], probably associated with a molecular outflow. The [C i] data show multiple weak emission lines from line of sight diffuse gas, including features located further away from W33A. The PACS spectral maps near 158m are presented in Figure 19.

B.4 G34.3+0.15
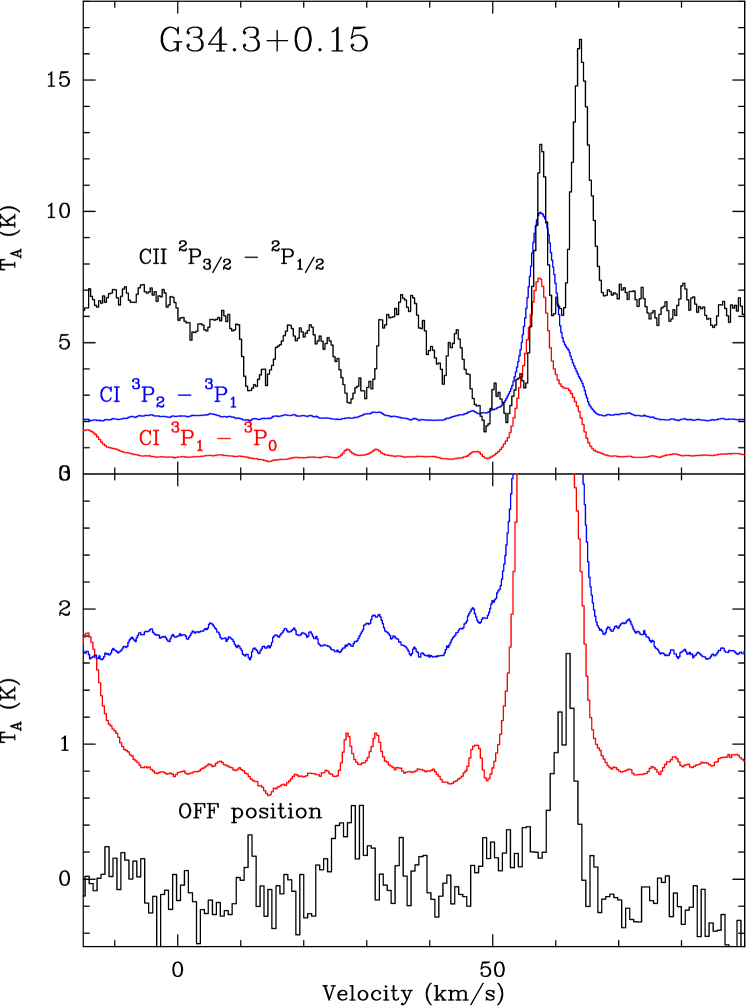

G34.3+0.15 is an ultra compact HII region located at about 3.3 (Kuchar & Bania 1994). The line of sight crosses the Sagittarius arm at velocities between and , and also samples the local interstellar medium for LSR velocities lower than 20 . The HIFI spectra are shown in Fig. 20 and 21. The [C ii] line is strongly self-absorbed towards G34.3+0.15 and presents an asymmetric spatial distribution. The [C i] emission is weak in the foreground gas. The tiny absorption at is due to a low level contamination in the reference position used in the Load Chop observations. The emission features in the [C i] spectra are excited molecular lines associated with the G34.3+0.15 hot cores. The PACS spectral maps near 158m are presented in fig 22.

B.5 W49N
W49N is one of the most luminous star forming region in the Galaxy. It is located in the Perseus arm at a distance of 11.4 (Gwinn et al. 1992). The line of sight crosses the Sagittarius arm twice along this very long line of sight.
B.6 W51
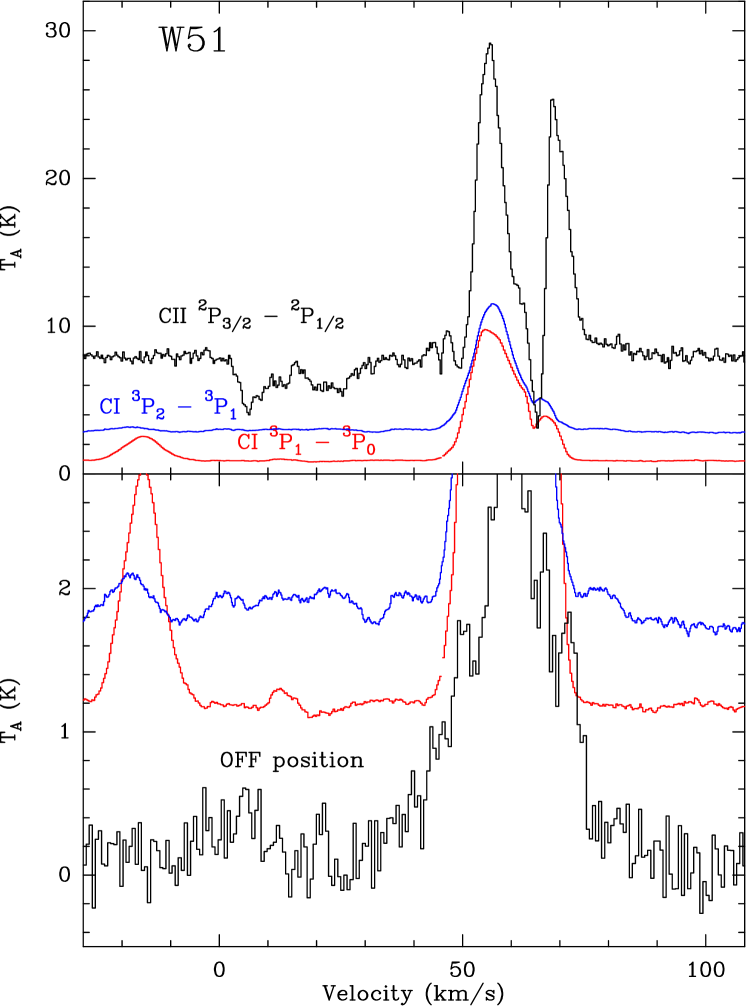

W51 is a very massive star formation complex in the Sagittarius arm at a distance of (Sato et al. 2010). The line of sight crosses the local interstellar medium, and also probes relatively diffuse material in the foreground of W51 at velocities and . The HIFI spectra are shown in Fig. 23 and 24. The [C ii] spectra show extended wings associated with the CO molecular outflow. The spectra are self reversed over a significant fraction of the map. Despite the high sensitivity reached in these data, we could not detect [C i] either in absorption nor in emission associated with the prominent features at and . The weak emission features in the [C i] and spectra are unrelated molecular lines associated with the W51 E1/E2 hot cores. The PACS spectral maps near 158m are presented in Figure 25.


B.7 DR21(OH)
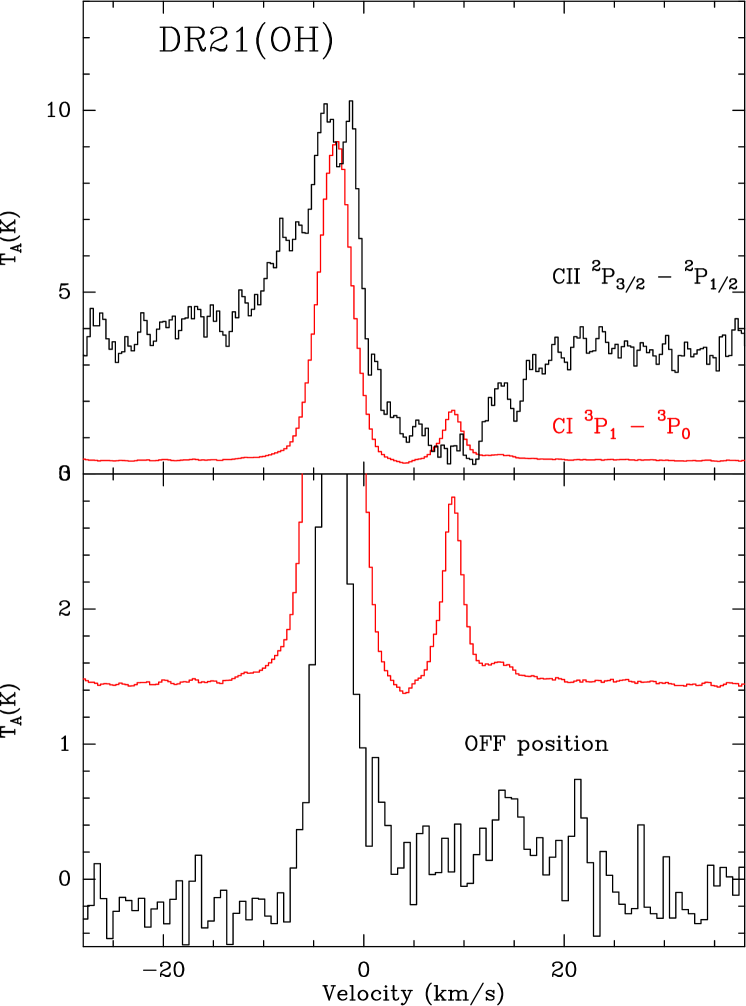

DR21(OH) is one of the most massive cores in the Cygnus molecular cloud complex. At a distance of (Rygl et al. 2012), the line of sight mostly probes the material in the Cygnus region. While the material directly associated with DR21(OH) appears at slightly negative LSR velocities, the foreground gas is seen near 10 and could be associated with W75N a few arc-minutes North East. The HIFI spectra are shown in Fig. 26 and 27. The PACS spectral maps near 158m are presented in Figure 28.
As DR21(OH) is a very weak continuum source at 1.4 GHz, the HI data also make use of the absorption towards the stronger continuum source DR 21, 3 arc-minutes South.
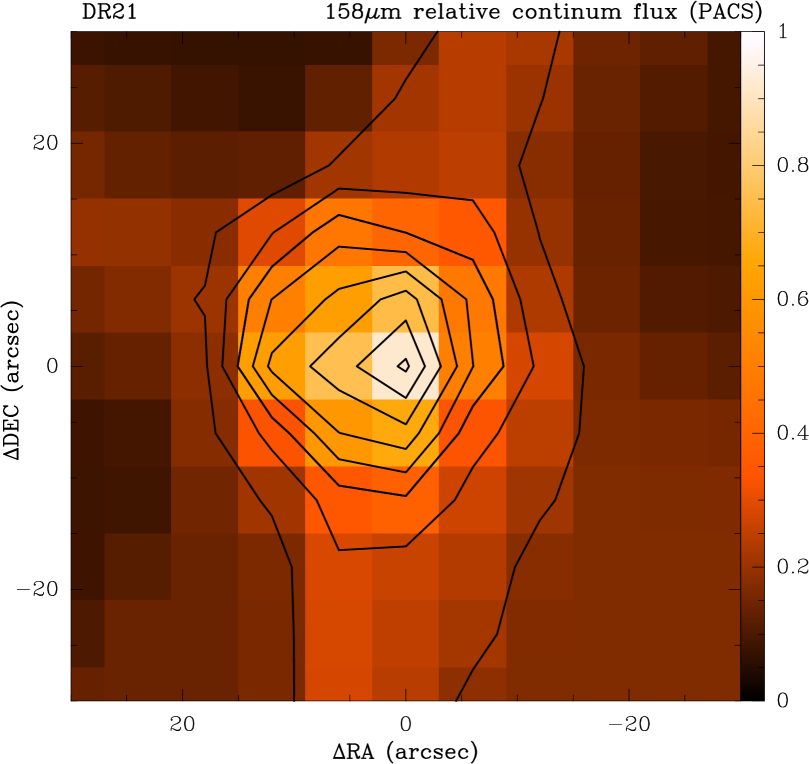
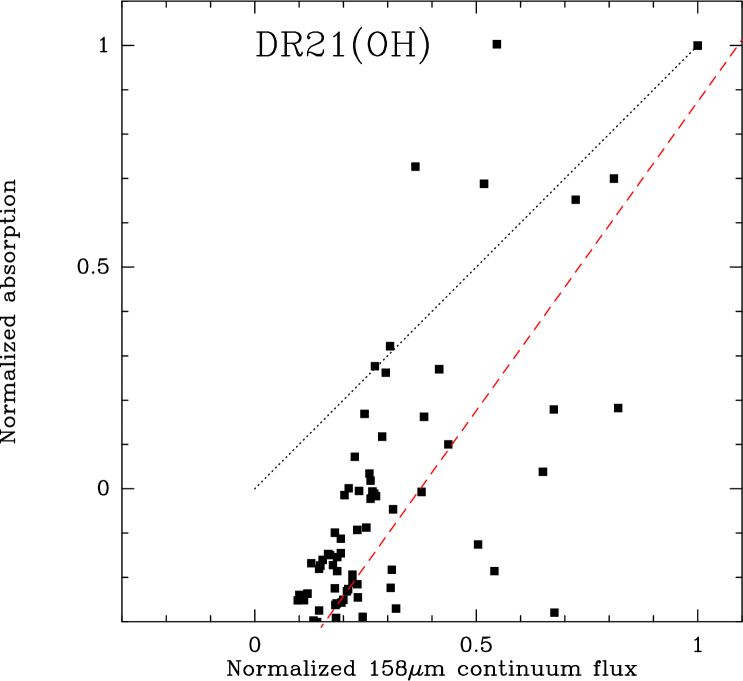

B.8 W3-IRS5
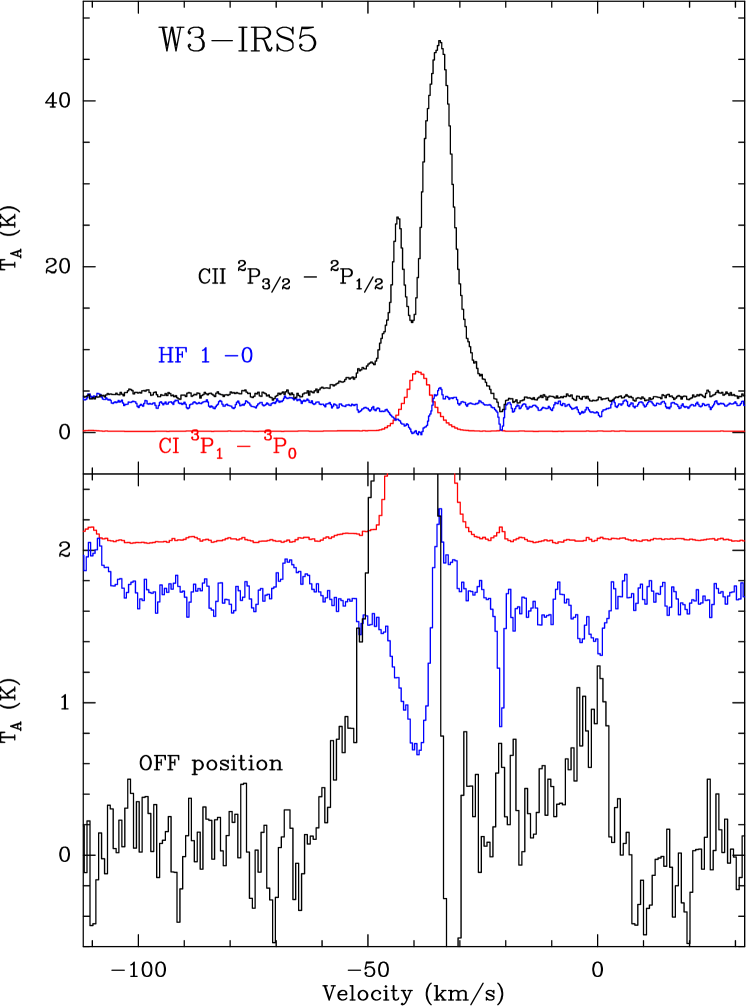

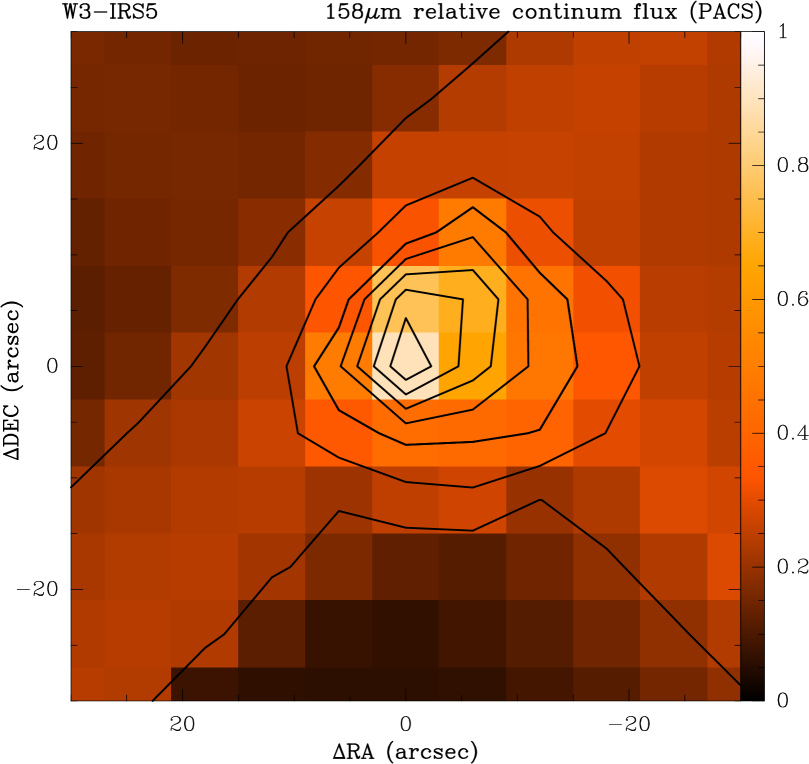
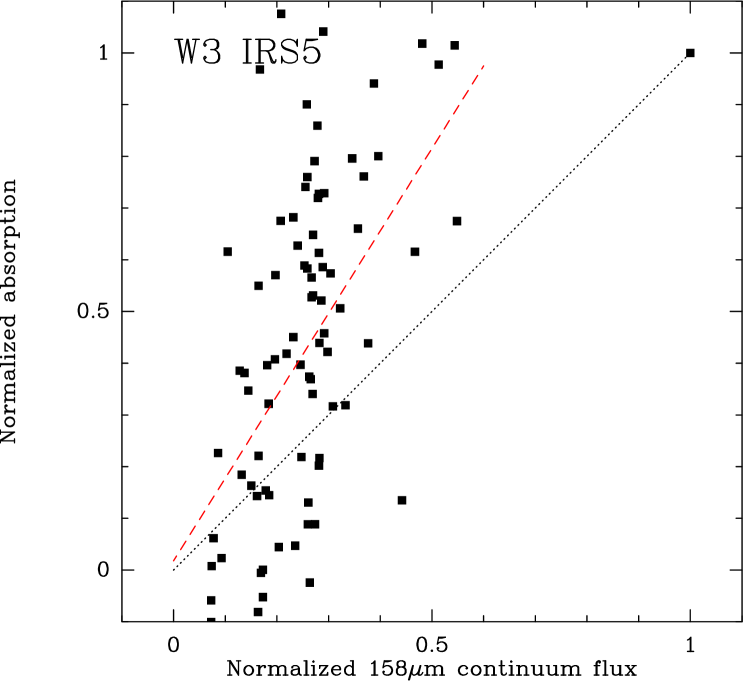

W3-IRS5 is a massive protostar in the W3 star forming complex at a distance of (Xu et al. 2006). Located in the second Galactic quadrant, the line of sight towards W3-IRS5 is probing the outer Galaxy. The HIFI spectra are shown in Figs 29 and 30. They include the ground state transition of HF at 1.2 THz. A deep and narrow velocity component is detected at , and a broader one near 0 . The H2 column densities have been derived from the HF data using [HF]/[H2] = (Sonnentrucker et al. 2010).