Multichannel photodiode detector for ultrafast optical spectroscopy
Abstract
Construction and characterization of a multichannel photodiode detector based on commercially available components with high signal to noise of and a rapid frame rate, suitable for time resolved femtosecond spectroscopy with high repetition femtosecond sources, is presented.
I introduction
In recent years femtosecond spectroscopy has been established as a standard tool to investigate physics of novel solid-state materials such as nonconventional superconductors, electronic crystals and related collectively ordered systems.Chekalin et al. (1991); Demsar et al. (1999a, b); Lobad et al. (2000); Kaindl et al. (2000); Dvorsek et al. (2002); Demsar et al. (2002); Segre et al. (2002); Tomimoto et al. (2003); Kaindl et al. (2005); Gedik et al. (2003); Prasankumar et al. (2005); Yusupov et al. (2008); Liu et al. (2008); Giannetti et al. (2009); Mertelj et al. (2009a, b); Schäfer et al. (2010); Torchinsky et al. (2010); Gadermaier et al. (2010); Mansart et al. (2010); Kusar et al. (2011); Giannetti et al. (2011); Kim et al. (2012); Mansart et al. (2012) Majority of the published work was done using narrowband optical probe pulses. There are several reasons for use of narrowband probes. Apart from simplicity of a setup, the main reason is the necessity to use lockin modulation techniques to reject the laser noise in order to detect small changes in optical responses. On the other hand, use of broadband optical pulsesGadermaier et al. (2010); Giannetti et al. (2011); Pogrebna et al. (2014); Kim et al. (2012); Mansart et al. (2012) can provide additional spectral information which is time consuming to obtain by means of wavelength-tunable narrowband optical pulses Ogasawara et al. (2001); Tomimoto et al. (2003); Okamoto et al. (2010).
Since many low temperature ordered states are easily destroyed by rather weak photoexcitation.Ogasawara et al. (2001); Kusar et al. (2008); Giannetti et al. (2009); Yusupov et al. (2010) the energy of the probe pulses must be kept low enough. In the case of broadband probe pulses this requires very efficient multichannel detection system that is fast enough to enable employment of the lockin-like modulation techniquesPolli et al. (2007); Smith et al. (2010) to suppress the laser noise. Such systems have been implemented recently in a kHz systemPolli et al. (2007) and cavity dumped fast repetition systemCilento et al. (2010) with the signal to noise ratio (SNR) enabling detection of photoinduced relative changes of optical constants.
Here we present construction and characterization of a multichannel photodiode detection system built from commercially available components with enabling lockin-like modulation techniques with modulation frequency up to 3 kHz appropriate for experiments using high repetition ( kHz) pulsed laser sources.
II Statement of the problem
In time resolved pump-probe experiments a relatively small changes of the reflectivity or transmittance of the sample are measured,
| (1) |
where stands either for reflectivity, , or transmittance, , and represents the light intensity in the channel . In a photodetector the SNR of a single channel is fundamentally limited by the number of acquired photoelectrons, . For the is required. In the shot-noise limit photoelectrons need to be acquired corresponding to a charge of nC. Assuming 100% quantum efficiency, this corresponds to nJ of optical energy (at 800-nm photon wavelength) per channel. Taking a typical convenient laser spot size111The spot size is often limited by the sample size. of m this leads to 5 mJ/cm2 of reflected/transmitted optical energy per channel. Limiting the single probe pulse fluence to 10 J/cm2 and assuming 50 channels the required number of probe pulses is resulting in the minimum s acquisition time per spectrum for a kHz laser system. With high repetition lasers this time can be considerably shorter, below one second. The is therefore feasible, provided that noise from other sources, especially the laser source noise, can be eliminated.
Modern spectroscopic CCDs have output register well capacity of ( pC) electrons and can achieve kHz readout rate (see for example ANDOR datasheets) leading to impractical222To measure time evolution spectra at different delays usually requires several tens of spectra per scan. accumulation times of333Here we assume that by a proper optical setup columns can be joined into a single spectral channel leading to an effective channel detector. s per spectrum. Commercially available CMOS and NMOS linear image sensors, on the other hand, offer on-chip effective well capacities in excess of 10 pC (see for example Hammamatsu data sheets), but mainly offer sequential readout only, which introduces dead-time and exposure-control problems444With a kHz laser a single optical pulse per scan, which is well defined in time, implements its own shutter. With high repetition laser an external shutter is needed to prevent exposure during the readout. when used in conjunction with high repetition lasers.
Recently, a custom CMOS detector was presented,Smith et al. (2010) incorporating four independent storage capacitors per pixel with the effective well capacity of ( pC) photoelectrons, capable of operating with up to kHz frame rate, enabling a multichannel pseudo-lockin detection at up to kHz modulation frequency. To our best knowledge this detector is not yet commercially available so a similar solution based on commercially available components is desirable.
III Our solution
Our solution is based on a multichannel Texas Instruments DDC-series current-input analog-to-digital (A/D) converter, that offers up to 150 pC effective well capacity with up to 6.25 kHz frame rate. Thus, photoelectrons can be accumulated on a timescale of second. Due to the dual switched integrator front-end the integration window of each input is synchronous, enabling precise exposure control with almost no dead time, the condition which is required in the case of high repetition lasers.
Different types of photodiode arrays can be coupled to the AD converter. We chose a 46-channel Hamamatsu S4111 series silicon photodiode array and a 16-channel Hamamatsu G7150-16 InGaAs PIN photodiode array for visible and near infrared spectral regions, respectively. The rather small number of channels is not a disadvantage since the high SNR requirement together with the probe pulse energy limitation inherently constrain the channel number.
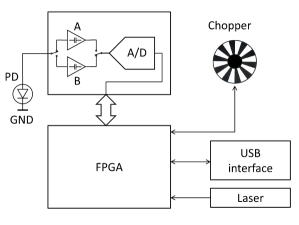
The digital interface to the AD converter (see Fig. 1) was implemented in a field programmable gate array (FPGA) providing control logic, clocks, synchronization with a chopper and laser, frame averaging as well as data transfer to an USB interface circuit.
Since for transient reflectivity/transmittance measurements a full phase sensitive detection is not necessary two spectra are acquired during each pump modulation period. The photoinduced intensity is calculated by,
| (2) |
where and correspond to intensities measured during opening and blocking periods of the chopped pump beam, respectively. To avoid exposure during the integrator switching time the detector and chopper are synchronized to the laser source by the FPGA circuitry. 555For the cases presented here a high repetition (250 kHz) optical regenerative amplifier (Coherent REGA) was employed.
IV Results
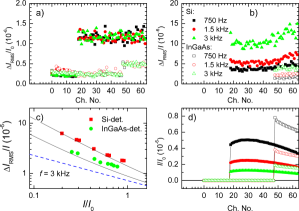
In Fig. 2 we show results of a basic characterization of the detector. In addition to the photoelectron shot noise the integrators input noise, the photodiode-capacitance thermal noise and other electronic noise picked from environment are present, while the digitization noise should be negligible with respect to the shot-noise due to the 20-bit resolution of the on-chip ADCs.
In Fig. 2 (a) we show the dark noise of the detector measured under typical experimental conditions by averaging 2000 readouts corresponding to s total integration time per single spectrum. The unconnected channels666Channels 0 to 18 for the Si detector and 0 to 48 for InGaAs detector. show noise of , where corresponds to the saturation intensity at the full effective-well capacity of pC. The connected channels show additional noise of and for the Si and InGaAs detectors, respectively.
The CW-illuminated-detector777A 20 W halogen lamp driven by a stabilized DC power supply was used as a source. noise at different modulation frequencies is shown in Fig. 2 (b). Due to the fixed number of readouts (2000) the total integration time and consequently the total photelectron counts are inversely proportional to the modulation frequency, , resulting in a higher signal noise floor at higher modulation frequencies.
In Fig. 2 (c) we show the illumination-intensity dependence of the signal-noise floor at kHz. The measured signal-noise floor is well described by the combination of the intensity-independent dark-noise from Fig. 2 (a) and the shot noise floor shown in Fig. 2 (c) with the blue dashed line. It can be seen that the detector is capable of operation near the shot-noise limit with the signal-noise floor of at s acquisition time.
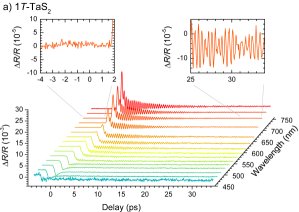
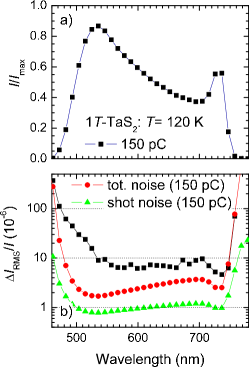
In Fig. 3 we show two actual data examples measured by the Si photodiode array, where the visible broadband supercontinuum pulses were generatedBradler et al. (2009) in a 2.5-mm thick sapphire window from 800-nm -J 50-fs pulses from a high repetition rate optical regenerative amplifier. The IR part of the supercontinuum ( nm) was rejected by a combination of Shott glass and interference filters. The reflected probe beam was coupled to an in-house built 300-mm focal-length spectrometer by means of a 0.6-mm core-diameter fiber. A 300 grooves/mm transmissive optical grating was chosen to maximize throughput in the nm spectral region.
The total integration time for each delay was 2 s resulting in min acquisition time for the case of the coherent oscillationsDemsar et al. (2002) in -TaS2 [Fig. 3 (a)] with delay points. Using 150 pC effective-well depth we obtained the RMS noise floor of in the least noisy part of the spectrum (see Fig. 4). The most significant contribution to the noise floor is clearly not due to the shot noise and the detector noise but due to the supercontinuum source noise, which strongly increases at shorter wavelengths.
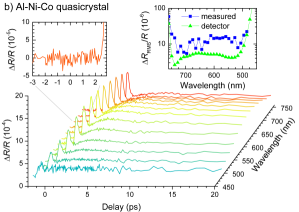
A smaller effective-well depth of 50 pC was used for measurement in an Al-Ni-Co quasi-crystalMertelj et al. (2009a) together with a lower supercontinuum probe-pulse energy of pJ per pulse, resulting in J/cm2 fluence with (100m)2 probe spot size. Due to the lower probe-pulse energy the noise floor is somewhat larger () as shown in Fig. 3 (b).
V Conclusions
A high signal-to-noise (106) multichannel photodetector for femtosecond transient optical spectroscopy in visible and NIR was constructed from commercially available components. The 6-kHz synchronous sampling rate enables lockin-like modulation detection to suppress the optical source noise enabling transient reflectivity/transmittance RMS signal-noise floor in a broad spectral range as shown by two example measurements.
Acknowledgements.
Work at Jozef Stefan Institute was supported by ARRS (Grant No. P1-0040).References
- Chekalin et al. (1991) S. V. Chekalin, V. M. Farztdinov, V. V. Golovlyov, V. S. Letokhov, Y. E. Lozovik, Y. A. Matveets, and A. G. Stepanov, Phys. Rev. Lett. 67, 3860 (1991).
- Demsar et al. (1999a) J. Demsar, B. Podobnik, V. V. Kabanov, T. Wolf, and D. Mihailovic, Phys. Rev. Lett. 82, 4918 (1999a).
- Demsar et al. (1999b) J. Demsar, K. Biljaković, and D. Mihailovic, Phys. Rev. Lett. 83, 800 (1999b).
- Lobad et al. (2000) A. I. Lobad, A. Taylor, C. Kwon, S. Trugman, and T. Gosnell, Chemical Physics 251, 227 (2000).
- Kaindl et al. (2000) R. Kaindl, M. Woerner, T. Elsaesser, D. Smith, J. Ryan, G. Farnan, M. McCurry, and D. Walmsley, Science 287, 470 (2000).
- Dvorsek et al. (2002) D. Dvorsek, V. V. Kabanov, J. Demsar, S. M. Kazakov, J. Karpinski, and D. Mihailovic, Phys. Rev. B 66, 020510 (2002).
- Demsar et al. (2002) J. Demsar, L. Forró, H. Berger, and D. Mihailovic, Phys. Rev. B 66, 041101 (2002).
- Segre et al. (2002) G. P. Segre, N. Gedik, J. Orenstein, D. A. Bonn, R. Liang, and W. N. Hardy, Phys. Rev. Lett. 88, 137001 (2002).
- Tomimoto et al. (2003) S. Tomimoto, S. Miyasaka, T. Ogasawara, H. Okamoto, and Y. Tokura, Phys. Rev. B 68, 035106 (2003).
- Kaindl et al. (2005) R. A. Kaindl, M. A. Carnahan, D. S. Chemla, S. Oh, and J. N. Eckstein, Phys. Rev. B 72, 060510 (2005).
- Gedik et al. (2003) N. Gedik, J. Orenstein, R. Liang, D. Bonn, and W. Hardy, Science 300, 1410 (2003).
- Prasankumar et al. (2005) R. P. Prasankumar, H. Okamura, H. Imai, Y. Shimakawa, Y. Kubo, S. A. Trugman, A. J. Taylor, and R. D. Averitt, Phys. Rev. Lett. 95, 267404 (2005).
- Yusupov et al. (2008) R. V. Yusupov, T. Mertelj, J.-H. Chu, I. R. Fisher, and D. Mihailovic, Phys. Rev. Lett. 101, 246402 (2008).
- Liu et al. (2008) Y. H. Liu, Y. Toda, K. Shimatake, N. Momono, M. Oda, and M. Ido, Phys. Rev. Lett. 101, 137003 (2008).
- Giannetti et al. (2009) C. Giannetti, G. Coslovich, F. Cilento, G. Ferrini, H. Eisaki, N. Kaneko, M. Greven, and F. Parmigiani, Phys. Rev. B 79, 224502 (2009).
- Mertelj et al. (2009a) T. Mertelj, A. Ošlak, J. Dolinšek, I. R. Fisher, V. V. Kabanov, and D. Mihailovic, Phys. Rev. Lett. 102, 086405 (2009a).
- Mertelj et al. (2009b) T. Mertelj, V. Kabanov, C. Gadermaier, N. Zhigadlo, S. Katrych, J. Karpinski, and D. Mihailovic, Physical Review Letters 102, 117002 (2009b).
- Schäfer et al. (2010) H. Schäfer, V. V. Kabanov, M. Beyer, K. Biljakovic, and J. Demsar, Phys. Rev. Lett. 105, 066402 (2010).
- Torchinsky et al. (2010) D. H. Torchinsky, G. F. Chen, J. L. Luo, N. L. Wang, and N. Gedik, Phys. Rev. Lett. 105, 027005 (2010).
- Gadermaier et al. (2010) C. Gadermaier, A. S. Alexandrov, V. V. Kabanov, P. Kusar, T. Mertelj, X. Yao, C. Manzoni, D. Brida, G. Cerullo, and D. Mihailovic, Phys. Rev. Lett. 105, 257001 (2010).
- Mansart et al. (2010) B. Mansart, D. Boschetto, A. Savoia, F. Rullier-Albenque, F. Bouquet, E. Papalazarou, A. Forget, D. Colson, A. Rousse, and M. Marsi, Phys. Rev. B 82, 024513 (2010).
- Kusar et al. (2011) P. Kusar, T. Mertelj, V. V. Kabanov, J.-H. Chu, I. R. Fisher, H. Berger, L. Forró, and D. Mihailovic, Phys. Rev. B 83, 035104 (2011).
- Giannetti et al. (2011) C. Giannetti, F. Cilento, S. Dal Conte, G. Coslovich, G. Ferrini, H. Molegraaf, M. Raichle, R. Liang, H. Eisaki, M. Greven, et al., Nature Communications 2, 353 (2011).
- Kim et al. (2012) K. W. Kim, A. Pashkin, H. Schäfer, M. Beyer, M. Porer, T. Wolf, C. Bernhard, J. Demsar, R. Huber, and A. Leitenstorfer, Nature Materials 11, 497 (2012).
- Mansart et al. (2012) B. Mansart, M. J. G. Cottet, T. J. Penfold, S. B. Dugdale, R. Tediosi, M. Chergui, and F. Carbone, Proceedings of the National Academy of Sciences 109, 5603 (2012), http://www.pnas.org/content/109/15/5603.full.pdf+html .
- Pogrebna et al. (2014) A. Pogrebna, N. Vujičić, T. Mertelj, T. Borzda, G. Cao, Z. A. Xu, J.-H. Chu, I. R. Fisher, and D. Mihailovic, Phys. Rev. B 89, 165131 (2014).
- Ogasawara et al. (2001) T. Ogasawara, T. Kimura, T. Ishikawa, M. Kuwata-Gonokami, and Y. Tokura, Phys. Rev. B 63, 113105 (2001).
- Okamoto et al. (2010) H. Okamoto, T. Miyagoe, K. Kobayashi, H. Uemura, H. Nishioka, H. Matsuzaki, A. Sawa, and Y. Tokura, Phys. Rev. B 82, 060513 (2010).
- Kusar et al. (2008) P. Kusar, V. Kabanov, J. Demsar, T. Mertelj, S. Sugai, and D. Mihailovic, Physical Review Letters 101, 227001 (2008).
- Yusupov et al. (2010) R. V. Yusupov, T. Mertelj, P. Kusar, V. Kabanov, S. Brazovskii, J.-H. Chu, I. R. Fisher, and D. Mihailovic, Nature Physics 6, 681 (2010).
- Polli et al. (2007) D. Polli, L. LÃŒer, and G. Cerullo, Review of Scientific Instruments 78, 103108 (2007).
- Smith et al. (2010) R. J. Smith, R. A. Light, S. D. Sharples, N. S. Johnston, M. C. Pitter, and M. G. Somekh, Review of Scientific Instruments 81, 024901 (2010).
- Cilento et al. (2010) F. Cilento, C. Giannetti, G. Ferrini, S. Dal Conte, T. Sala, G. Coslovich, M. Rini, A. Cavalleri, and F. Parmigiani, Applied Physics Letters 96, 021102 (2010).
- Note (1) The spot size is often limited by the sample size.
- Note (2) To measure time evolution spectra at different delays usually requires several tens of spectra per scan.
- Note (3) Here we assume that by a proper optical setup columns can be joined into a single spectral channel leading to an effective channel detector.
- Note (4) With a kHz laser a single optical pulse per scan, which is well defined in time, implements its own shutter. With high repetition laser an external shutter is needed to prevent exposure during the readout.
- Note (5) For the cases presented here a high repetition (250 kHz) optical regenerative amplifier (Coherent REGA) was employed.
- Note (6) Channels 0 to 18 for the Si detector and 0 to 48 for InGaAs detector.
- Note (7) A 20 W halogen lamp driven by a stabilized DC power supply was used as a source.
- Bradler et al. (2009) M. Bradler, P. Baum, and E. Riedle, Applied Physics B 97, 561 (2009).