Disorder-perturbed Landau levels in high electron mobility epitaxial graphene
Abstract
We show that the Landau levels in epitaxial graphene in presence of localized defects are significantly modified compared to those of an ideal system. We report on magneto-spectroscopy experiments performed on high quality samples. Besides typical interband magneto-optical transitions, we clearly observe additional transitions that involve perturbed states associated to short-range impurities such as vacancies. Their intensity is found to decrease with an annealing process and a partial self-healing over time is observed. Calculations of the perturbed Landau levels by using a delta-like potential show electronic states both between and at the same energies of the Laudau levels of ideal graphene. The calculated absorption spectra involving all perturbed and unperturbed states are in very good agreement with the experiments.
The experimental and theoretical study of graphene, the first 2D crystal ever observed in nature, has become a major issue of condensed matter physics, both because of its remarkable fundamental physical properties goerbig2011 ; castroneto2009 and its promising technological applications novoselov2012 . Thermal decomposition of SiC allows to obtain multilayer epitaxial graphene (MEG) with a low doping level and high carrier mobility. The graphene layers appear decoupled as MEG essentially displays electronic properties similar to that of an isolated graphene monolayer. A rotational stacking of the graphene sheets is most frequently proposed to explain this decoupling between adjacent layers hass2008 ; deheer2011 . In fact, C-SiC graphene films are typically comprised of small domains that vary in layer thickness and stacking order johansson2011 . The decoupled graphene layers are quasi neutral with a Fermi level close to the Dirac point with only a few layers close to the interface MEG/SiC being highly doped sadowski2006 .
The electronic properties of epitaxial multilayer graphene have been widely investigated by infrared magneto-optical spectroscopy orlita2010 ; orlita2008 . The Landau level structure, the mobility of the Dirac fermions as a function of temperature and the nature of the layer stacking have been accurately determined in MEG samples containing up to 100 layers. Nevertheless, it is well-known that lattice defects, either localized (impurities or vacancies) or extended (dislocations, grain boundaries…), are always present in graphene and that the electronic properties can be significantly modified compared with that of the perfect system castroneto2009 . It is therefore important to investigate the magneto-optical signature of the defects in MEG. Surprisingly, hardly any studies about the lattice defects has been reported using magneto-optical measurements. For example the study of the cyclotron resonance linewidth and the investigation of the dynamical magneto-conductivity have concluded that the dominant scattering mechanism is very likely due to short-range potentials or to electron-electron interactions orlita2008 ; orlita2011 .
In this paper, we present magneto-spectroscopy measurements performed on high-quality MEG samples with intentionally few layers ( 8–10) and high electron mobility of about . Besides the usual magneto-optical transitions previously observed in MEG corresponding to a single graphene layer (with a characteristic -dependence) or to a graphene bilayer (with a quasi linear -dependence), we clearly observe additional transitions, which also display a -energy dependence. In the following we show that these transitions involve perturbed states associated to short-range impurities such as C-vacancies. Their intensity is found to decrease with an annealing process or a few weeks after the growth, indicating a partial self-healing of the layers. To interprete our data we have calculated the perturbed MEG Landau levels in the framework by modeling the short-range impurities by delta-like potentials. The important result is that one obtains impurity-related states (i) in between and (ii) at the same energies as the unperturbed Landau levels of the ideal graphene. We then calculate the magneto-optical interband absorption between all the perturbed and unpertubed states. The calculated transmission spectra are in good agreement with the experiments.
The investigated MEG films were prepared by thermal decomposition from the C-terminated surface of semi-insulating 4H-SiC substrate deheer2011 ; pallecchi2014 . The SiC substrate was first etched in a hydrogen flux at at for 15 min in order to remove any damage caused by surface polishing and to form a step-ordered structure on the surface. The graphene layers were grown in a closed RF induction furnace at a temperature around at . Thicknesses of 8–10 layers were intentionally chosen and determined by STEM analysis. Each sample was divided into two parts, one of them being exposed to pure hydrogen flux at during 10 minutes in order to check the effect of an H2 annealing pallecchi2014 ; pallecchi2012 . Three different sets of samples were investigated which give similar results. The samples were measured right after the growth and one month later in order to check the self-healing of the defects. The graphene layers are quasi-neutral with only some layers close to the interface being significantly doped. To measure the magneto-transmission in the range 5–700 meV, samples (typically ) were placed in a superconducting coil at and exposed to the radiation of a mercury lamp. The transmitted light was analyzed by a Fourier transform spectrometer, using a Si composite bolometer directly below the sample for detection. The samples are partially or fully opaque in the energy range 85–210 meV because of the phonon-related absorption of the SiC substrate. The transmission at a given magnetic field was normalized by the zero-field transmission .
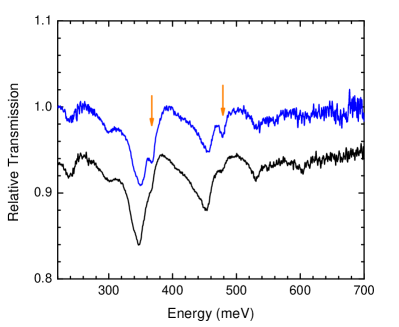
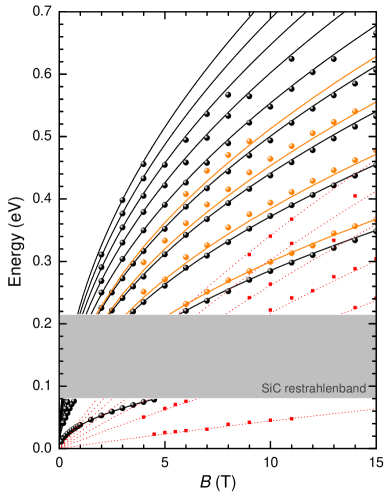
Typical transmission spectra measured at magnetic field are shown in Fig. 1 for photon energies above the SiC restralhen (). The black spectrum is measured on the H2-annealed part of the sample while the blue one corresponds to the non-annealed part of the same sample. The energy positions of the transmission minima are identical for both spectra but the lines occurring at 365 and (indicated by the arrows) are clearly more pronounced in the blue one. Similar experiments have been performed for magnetic fields in the range and the position of the transmission minima are shown on Fig. 2. The dominant absorption lines (shown by the black symbols on Fig. 2) clearly display the characteristic -dependence and correspond to transitions between holes and electrons states in a pure graphene monolayer. Landau levels (LL) of pure graphene in the presence of a perpendicular magnetic field are described by replacing in the lowest order ( approximation) tight-binding hamiltonian, with the potential vector. This generates the well known LL discrete series around the Dirac point at ( and corresponds respectively to conduction and valence band states; is the Fermi velocity). The selection rules for interband absorption within these states in the dipole approximation correspond to . The LL can contribute both as initial or final level for the magneto-absorption, depending on the sample doping. The black solid lines on Fig. 2 are the calculated transitions energies for the first ten interband transitions (i.e.: involving LLs to 10) using . The agreement is excellent even for the largest transition energies () for which the initial or final LL-energy is above and below the Dirac point. The lowest transition is measured in the energy range 0–85 meV below the SiC restralhen. It is noticeable that it can be observed for magnetic field as small as , which demonstrates the high quality of the MEG samples with a Fermi energy and an electron mobility .
We also observed weaker lines which correspond to a nearly linear -dependence as shown by the red symbol on Fig. 2. The intensity of these lines is found to be independent of the hydrogen annealing process (see for instance the two lines at 240 and on Fig. 1). This quasi-linear dependence, characteristic of massive particles, is associated to graphene bilayers within the MEG. These stacking faults in the rotationally ordered MEG are observed in most epitaxial graphene samples orlita2011b . It has been reported that the ratio between bilayers and monolayers is typically . The LL energies of a graphene bilayer can be easily calculated by using a four band model taking into account the most relevant coupling constants koshino2008 and the red dashed lines on Fig. 2 are the calculated energies of the five first transitions using and the coupling constant . The agreement with the experiments (red symbols) is good.
Finally, the major point of this study, additional transmission minima are observed at all magnetic fields with energy shown by the orange symbols on Fig. 2. They display a -dependence and correspond to magneto-optical transitions with energies above that of the transitions of ideal graphene (see Fig. 2). Their intensities are found to be dependent on the annealing process (see for instance the lines indicated by the arrows in Fig. 1 which are much stronger for the blue spectrum than for the black one). We discuss now the origin of these transitions and we show that they can be associated to short-range impurities (such as C-vacancies) in the graphene layers. The effect of defects on the magneto-states has been previously theoretically discussed in the literature ando1998 ; shon1998 ; peres2006 . Of particular importance are localized perturbations, owing for instance to a C-vacancy or one isoelectronic substitution (e.g. one Si atom in place of one C atom) on a sublattice A or B site. These have been previously modeled in the framework by short-range (delta-like) potentials in real space. We have correspondingly considered the perturbation potential , where the origin is taken at one site of, say, the A sublattice. The constant , which gives the strength of the localized perturbation, is taken as a parameter to best-fit the experiments. Finally, we use in the calculations the symmetric gauge to describe the magnetic field, so that for each Landau level of a given valley there is only one unperturbed Landau state affected by the defect potential. Namely the one with vanishing angular momentum in the A-component of its spinor (the only states for which the wavefunctions have non-vanishing amplitude at ).
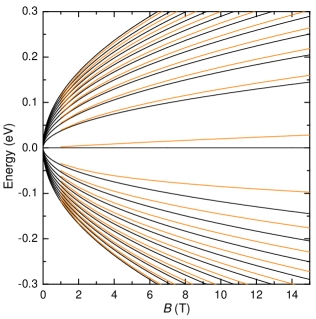
We show in Fig. 3 the fan chart of perturbed states for , obtained after diagonalization of in a truncated basis of unperturbed Landau states (a cutoff value is chosen for this calculation, so that 21 LLs are taken into account in the basis). It is interesting to note the presence of two kinds of states in the presence of defects: states placed (i) in between and (ii) at the same energies as the unperturbed Landau levels. The first (in orange in Fig. 3) is ubiquitous for the perturbation of a general discrete series of levels: the defect introduces new cyclotron orbits with different energies for the electrons. The second (in black in Fig. 3), on the other hand, results from two specificities of a localized perturbation of Landau states in graphene, i.e., that it effectively mixes states from the same, as well as from different, Dirac cones (while intervalley coupling vanish for extended potentials), and, additionally, the intra- and inter-valley coupling strengths are identical and equal to , where is the cyclotron radius. The structure of the spectrum can therefore be understood as follows. At the lowest order in perturbation (i.e., by retaining only the two unperturbed resonant states with same but issued each from a different valley), the eigenvalue equation to solve is: , with the unit matrix, the real non-diagonal Pauli matrix. The solutions are : . One has thus one state at the same energy as the original Landau level, and another either below or above it, depending on the sign of .
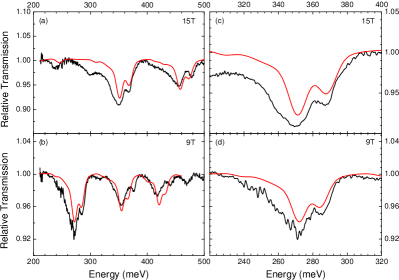
For this same picture does not apply, since the spinors have either A or B components, and states related to the B sublattice remain unaffected by the perturbation. These lowest order trends obtained for fixed n are also obtained when all (intra- and inter-, for the same or different valleys) couplings are accounted for in the complete diagonalization procedure, resulting in the existence of defect-related states in-between the non-perturbed Landau levels as well as at the energies , as shown in Fig. 3. Magneto-optical interband absorption involves perturbed as well as unperturbed states. The measured transmission spectrum is dominated by the interband transitions between unperturbed LLs. In the presence of defects new lines appear, for which the selection rules for an ideal graphene layer no longer apply, because of the disorder-induced state mixing. We obtain that transitions involving only the perturbed states do not contribute to the absorption. We associate the weaker lines to transitions between unperturbed and defect-related states. Indeed, we show in Fig. 4 the calculated absorption probability spectra for two magnetic fields ( and ), for electrons initially in unperturbed valence states (LLs with ) and towards all accessible excited perturbed states (i.e., with , the level playing as for the ideal case the twofold role of initial and final level). We see that the calculation agrees with the experimental data measured in a non-annealed sample right after the growth. It is worth stressing a few points related to the theory-experiment comparison in Fig. 4. Firstly the energy positions of the weak shoulders are mostly dependent upon the value of the potential strength . Secondly the relative intensities of the main and weaker lines are mostly dependent upon the density of defects. Indeed, total optical spectrum contains both ”LL-to-LL” and ”LL-to-defect” contributions. The intensity of a defect-related contribution is proportional to the number of defects in the sample, whereas the strength of an intrinsic peak is proportional to the sample surface. The relative amplitudes between defect-related and intrinsic contributions are thus proportional to the defect’s area density , a quantity unknown in our sample and thus considered as a fitting parameter. Moreover, owing to the fact (discussed above) that some defect-related states have the same energy as the unperturbed Landau orbits, each main line contains both one LL-to-LL and one LL-to-defect contributions, the latter being proportional to . We obtain from the best fit shown in Fig. 4 for the non-annealed sample. A similar fit for an H2 annealed sample (see for instance the black spectrum in Fig. 1) gives . Thirdly in the calculations we replaced the Dirac-lines in the Fermi golden rule by gaussian ones with energy-independent broadening: and . Indeed, we clearly see in Fig. 4 that the main lines are broader than the weaker ones. The spectra have been calculated in the whole magnetic field range and the position of the transmission minima associated to the defects is shown by the black and the orange solid lines on Fig. 2. Again, the agreement with the experimental results (black and orange symbols) is satisfying.
Let us finally comment on the parameters of the model extracted from the fit in Fig. 4. The potential strength is usually written as , where is the area of the graphene unit cell ando1998 . In this case one obtains . A short-range potential with large strength has been associated to vacancies in the literature basko2008 ; fischer2011 . Additionally, one finds that for the non annealed sample and for the annealed sample, where is the areal density of carbon atoms. Note that a similar defect healing is obtained in the non annealed samples measured one month after the growth, indicating a partial self-healing of the defect even at room temperature. This healing could be explained by a migration at the C-vacancies towards the domain boundaries cockayne2012 ; lee2005 . In any case, the values found for corresponds to very diluted concentration of defects in the graphene layer, consistent with the high electron mobility deduced from the low cyclotron resonance ( transition) measurements. Moreover the mobility evaluated (following Ref. shon1998 ) with the disorder parameters is reasonably consistent with the measured one. Finally, the different broadenings (with ) might be due to the fact that the width of the LL-to-LL transitions results from the convolution of two nearly equally broadened LLs, whereas we do not expect an important broadening for a spatially localized state in the gap between two LLs.
In conclusion, we have observed the magneto-optical signature of short-range impurities in high electron mobility MEG samples. Interband transitions and magneto-absorption between perturbed and unperturbed states were successfully modeled by using a delta-like potential in the framework. This good agreement demonstrates that the presence of short-range impurities in MEG, even with a very diluted concentration, must be taken into account for analyzing the magneto-optical data. Such defects are found to be present with a density of a few , even in high electron mobility samples, and give states both between and at the same energies of the Landau levels of ideal graphene.
References
- (1) M. O. Goerbig, Rev. Mod. Phys. 83, 1193 (2011)
- (2) A. H. Castro Neto, F. Guinea, N. M. R. Peres, K. S. Novoselov, A. K. Geim, Rev. Mod. Phys. 81, 109 (2009)
- (3) K. S. Novoselov, V. I. Fal ko, L. Colombo, P. R. Gellert, M. G. Schwab, K. Kim, Nature 490, 192 (2012)
- (4) J. Hass, F. Varchon, J. E. Milla n-Otoya, M. Sprinkle, N. Sharma, W. A. de Heer, C. Berger, P. N. First, L. Magaud, E. H. Conrad, Phys. Rev. Lett. 100, 125504 (2008)
- (5) W. A. de Heer, C. Berger, M. Ruan, M. Sprinkle, X. Li, Y. Hu, B. Zhang, J. Hankinson, E. H. Conrad, Proc. Natl. Acad. Sci. 108, 16900 (2011)
- (6) L. I. Johansson, S. Watcharinyanon, A. A. Zakharov, T. Iakimov, R. Yakimova, C. Virojanadara, Phys. Rev. B 84, 125405 (2011)
- (7) M. L. Sadowski, G. Martinez, M. Potemski, C. Berger, W. A. de Heer, Phys. Rev. Lett. 97, 266405 (2006)
- (8) M. Orlita, M. Potemski, Semicond. Sci. Technol. 25, 063001 (2010)
- (9) M. Orlita, C. Faugeras, P. Plochocka, P. Neugebauer, G. Martinez, D. K. Maude, A.-L. Barra, M. Sprinkle, C. Berger, W. A. de Heer, M. Potemski, Phys. Rev. Lett. 101, 267601 (2008)
- (10) M. Orlita, C. Faugeras, R. Grill, A. Wysmolek, W. Strupinski, C. Berger, W. A. de Heer, G. Martinez, M. Potemski, Phys. Rev. Lett. 107, 216603 (2011)
- (11) E. Pallecchi, F. Lafont, V. Cavaliere, F. Schopfer, D. Mailly, W. Poirier, A. Ouerghi, Sci. Rep. 4, 4558 (2014)
- (12) E. Pallecchi, M. Ridene, D. Kazazis, C. Mathieu, F. Schopfer, W. Poirier, D. Mailly, A. Ouerghi, Appl. Phys. Lett. 100, 253109 (2012)
- (13) M. Orlita, C. Faugeras, J. Borysiuk, J. M. Baranowski, W. Strupi nski, M. Sprinkle, C. Berger, W. A. de Heer, D. M. Basko, G. Martinez, M. Potemski, Phys. Rev. B 83, 125302 (2011)
- (14) M. Koshino, T. Ando, Phys. Rev. B 77, 115313 (2008)
- (15) T. Ando, T. Nakanishi, J. Phys. Soc. Jpn 67, 1704 (1998)
- (16) N. H. Shon, T. Ando, J. Phys. Soc. Jpn 67, 2421 (1998)
- (17) N. M. R. Peres, F. Guinea, A. H. Castro Neto, Phys. Rev. B 73, 125411 (2006)
- (18) D. M. Basko, Phys. Rev. B 78, 115432 (2008)
- (19) A. M. Fischer, R. A. Römer, A. B. Dzyubenko, Phys. Rev. B 84, 165431 (2011)
- (20) E. Cockayne, Phys. Rev. B 85, 125409 (2012)
- (21) G. D. Lee, C. Z. Wang, E. Yoon, N. M. Hwang, D. Y. Kim, K.M. Ho, Phys. Rev. Lett. 95, 205501 (2005)