Low- structures in elastic scattering at the LHC
Abstract
Possible low- structures in the differential cross section of elastic scattering at the LHC are predicted. It is argued that the change of the slope of the elastic cross section near GeV2 has the same origin as that observed in 1972 at the ISR, both related to the branch point in the -channel of the scattering amplitude. Apart from that structure, tiny oscillations at small may be present on the cone at low .
11.55.Jy, 13.85.Dz, 12.40.Nn
1 Introduction
Followed by the first publications on elastic scattering at TeV in the broad range GeVGeV2 [1, 2], the TOTEM Collaboration recently made public [3, 4, 5, 6] their new results at still lower values of at TeV.
Contrary to earlier statements [2], considerable deviation from the linear exponential cone was found. Namely, a change of the local slope ln at TeV by about GeV-2 around GeV2 was observed.
In the present paper we argue that this structure is a recurrence of the similar phenomenon observed in 1972 at the ISR, both related to -channel unitarity effects of the scattering amplitude. Anticipating the relevant TOTEM publication, below we present a method of handling possible structures in the diffraction cone and make predictions based on an a Regge-pole model-based extrapolation from the ISR energy region to that of the LHC. 333Preliminary results of this paper were presented in June, 2014 at the Protvino Conference on High-Energy Physics [7].
2 The ”break” phenomenon; preliminaries
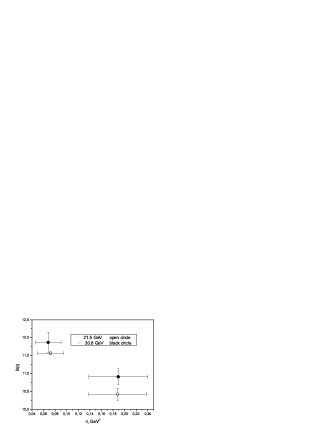
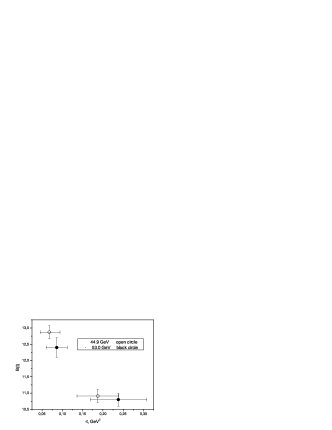
The change of the local slope around by about GeV-2, called the ”break” (in fact, a smooth curvature in ), at GeV) was first observed and discussed in Ref. [8] (see Table I in [8], quoted below and illustrated in Fig.1).
| E c.m., | - range, | B, | err. | B, | err. |
| GeV | |||||
| 21.5 | 0.05 - 0.094 | 11.57 | 0.030 | ||
| 0.138 - 0.2380 | 10.42 | 0.17 | 1.15 | 0.20 | |
| 30.8 | 0.046 - 0.090 | 11.87 | 0.28 | ||
| 0.138 - 0.240 | 10.91 | 0.22 | 0.96 | 0.50 | |
| 44.9 | 0.046 - 0.089 | 12.87 | 0.20 | ||
| 0.136 - 0.239 | 10.83 | 0.20 | 2.04 | 0.40 | |
| 53.0 | 0.060 - 0.112 | 12.40 | 0.30 | ||
| 0.168 - 0.308 | 10.80 | 0.20 | 1.6 | 0.50 |

| range, | B, ) | err. | |
|---|---|---|---|
| I | 0.03 - 0.10 | 15.3 | 0.3 |
| II | 0.03 - 0.15 | 15.2 | 0.2 |
| III | 0.15 - 0.32 | 14.2 | 0.4 |
| IV | 0.21 - 0.32 | 13.6 | 0.8 |
| V | 0.21 - 0.50 | 13.4 | 0.3 |
The magnitude of the slope break at different ISR energies, calculated in a simple exponential approximation for nearly the same range of momentum transfer GeV and GeV varies within the range GeV2. Using the data from Table II on the slope parameter for the SPS energy GeV for antiproton-proton scattering, one can obtain different values for the slope break depending on the choice of bin pairs. For example, the largest value of the slope break can be obtained by choosing a couple (adjacent bins) made of the farthest values I, V, and the smallest one for the pairs I and III, , taking into account two adjacent intervals. A different approach to the choice of the individual t-bins was used in the recent paper [2], where constancy of the slope was stated, at least until GeV2.
Note that the break found at 8 TeV can be obtained even with simpler methods where two single exponential are fitted in non-overlapping t-ranges, the relevant differing by more than 7. The overall behaviour of B(t) as a function of energy is illustrated in [10] and [11].
The ‘break’ phenomenon has a clear physical interpretation: it results from the channel branch point at GeV2 imposed by unitarity. The ”break” due to the two pion threshold is related to the pionic atmosphere (cloud) of the nucleon [12] (for more details see next Section).
(see also Table 6. in [2]).
An immediate conclusion is that in the calculation of the result depends on the bins in chosen. Generally speaking, the bins can be chosen arbitrarily: small (containing at least three data points) or large. They may be chosen in a touching sequence or overlap. The latter option (so-called overlapping bins method (OBM)) was studied in details in a number of papers [11, 10, 13, 14, 15], whose ideas and results are quoted in the Appendix.
Below we discuss in more details all these results and make predictions for TeV. A preliminary version of this study was presented [7] at the Protvino Conference on High-Energy Physics in June, 2014.
To start with, we recalculate the local slope with account for both the statistical and systematic errors. To this end we will choose the compiled data from [16]. At the LHC we include only data from the first cone [2, 3] for .
For the ISR data we have chosen the Amaldi et al. data [17] for center of mass energies 23.5, 30.8 and 44.7 GeV. The results are quoted in Table III.
| E c.m., | -range, | B, | err. | B, | err. |
| GeV | |||||
| 23.5 | 0.05 - 0.102 | 11.5 | 0.7 | ||
| 0.138 - 0.238 | 10.2 | 0.4 | 1.22 | 1.1 | |
| 32.0 | 0.05 - 0.094 | 11.6 | 0.4 | ||
| 0.138 - 0.240 | 10.9 | 0.3 | 0.7 | 0.7 | |
| 44.7 | 0.05 - 0.096 | 13.3 | 0.3 | ||
| 0.138 - 0.238 | 10.6 | 0.2 | 2.7 | 0.5 |
There is a gap between adjacent bins in the ISR data, seemingly increasing the ‘break’ of the slope (see Fig. 1). For example, the choice of the bins adopted in Ref. [8] is not unique. For example, by selecting the location of the second bin at CME= 23.5 GeV as , the averaged slope within this bin will be , implying , which is more reliable than the results of Table III.
However, it is more natural to calculate the ‘break’ for neighbouring bins in the vicinity of , close to the ”break” we are scrutinizing. The local slopes calculated for the ISR and SPS data [9, 17] (compiled in [16]) for bin intervals being near the same as in [8] are shown in Table III.
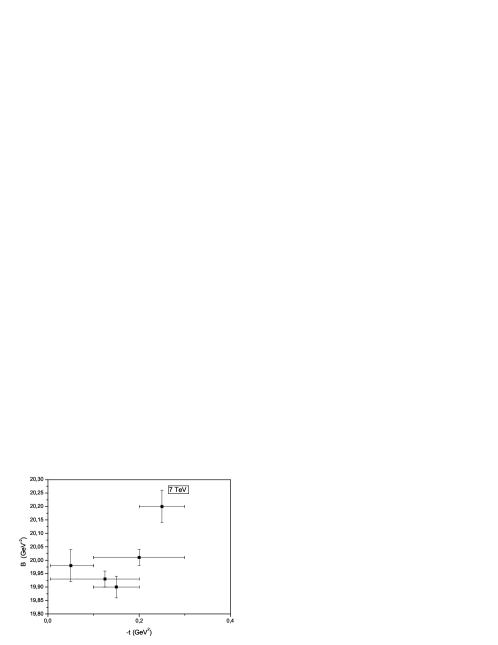
It is interesting to study whether this effect (the ‘break’ of the local slope) persists up to the LHC energies. To this end we construct a similar plot for the slopes (and compare it with Table 6. of [2]) for the differential cross sections measured at = 7 TeV in the interval (Fig. 3).
For clarity sake we performed the calculations of local slopes in adjacent bins around for nearly the same length as in [8]: the first bin is ; the second one is As a result, the value of the ‘break’ varies within GeV-2 for the ISR and TOTEM energies (see Table IV).
| E c.m., GeV | -bin, | B, | err. | B, | err. |
|---|---|---|---|---|---|
| 0.05-0.094 | 11.5 | 0.7 | |||
| 23.5 | 0.094-0.138 | 10.2 | 0.9 | 1.3 | 1.6 |
| 0.05-0.094 | 11.6 | 0.4 | |||
| 30.7 | 0.090-0.138 | 11.2 | 0.6 | 0.4 | 1.0 |
| 0.05- 0.094 | 13.1 | 0.3 | |||
| 44.7 | 0.094-0.136 | 12.3 | 0.5 | 0.8 | 0.8 |
| 0.05- 0.10 | 15.3 | 1.2 | |||
| 546. | 0.10-0.138 | 13.9 | 1.5 | 1.4 | 2.7 |
| 0.046-0.091 | 19.8 | 0.7 | |||
| 7000 | 0.091-0.137 | 19.3 | 0.9 | 0.5 | 1.6 |
| 0.05-0.095 | 19.8 | 0.2 | |||
| 8000 | 0.095-0.137 | 18.8 | 0.4 | 1.0 | 0.6 |
| 0.05-0.095 | 19.8 | 0.2 | |||
| 8000 | 0.095-0.189 | 19.1 | 0.3 | 0.7 | 0.5 |
This estimate of the ”‘break”’ is less reliable, but shows the trend with energy. One concludes from Table IV that the break does not diminish with energy.
3 Physics of the ”break” phenomenon
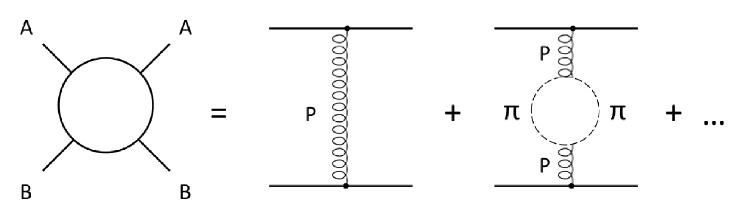
The physics of the phenomenon was explained in Ref. [12]. The ”break” (in fact a smooth concave over the linear exponential, approximated by two linear exponentials (cf. [3] ). This structure is due to the lowest two-pion exchange in the channel required by channel unitarity [18], see Fig. 4. The threshold appears at GeV2, which is the mirror (with opposite sign of ) position of the ”break” of the cone. We recall that any analytic function (here, the scattering amplitude) is sensitive to ”mirror reflection” of its singularities (here, the branch point in the amplitude).
According to the ideas of duality [18, 19], the singularities enter the amplitude through Regge trajectories. Below, following Ref. [12], we present a model amplitude realizing this principle and reproducing the observed ”break”.
.
The channel threshold shown in Fig. 4 may enter both through leading (Pomeron, Odderon) or non-leading () trajectories. While at the LHC, the low- are dominated completely by the Pomeron contribution (whatever it be!) [11], at the ISR energies, secondary Reggeons are not negligible, at least in nearly forward scattering.
| (1) |
In the next Section we extrapolate in the forward cone from the ISR to the LHC energies. This is not a trivial task since a detailed fit requires the inclusion at ”low”, ISR energies the contribution from at least four trajectories, namely that of the Pomeron, evetntually the Odderon, and two secondary Reggeons, and . Postponing this discussion to a forthcoming detailed analyses, here we use a single ”effective” trajectory that at the low-energy part mimics all contributions mentioned (at LHC energies it is the Pomeron alone, see Ref. [11]).
4 Extrapolating from the ISR to the LHC
To extrapolate the cross-section (or just the slope) from ”low” (ISR) energies to those at the LHC, we use a simple single Regge pole amplitude with an ”effective” trajectory that is close to the Pomeron dominating the high-energy region. The intercept of the trajectory , following the Donnachie and Landshoff approach [20] to high-energy phenomenology, will be set slightly above .The relevant scattering amplitude reads
| (2) |
| (3) |
We use a representative Pomeron trajectory, namely that with a two-pion square-root threshold, Eq. (1), required by channel unitarity and accounting for the small- ‘break’ [12].
The normalized ‘experimental’ points of are defined as:
| (4) |
where
| (5) |
The theoretical values of are calculated from
| (6) |
Those for correspond to the solid curve in Fig. 5 calculated as the best fit to the experimental differential cross sections for a given energy with the free parameters , , and fixed and ; , where is the pion mass.
For all energies, the value of clearly demonstrates concavity at -t = 0.1 , which is in qualitative agreement with the ”experimental” one in .
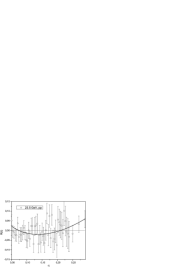
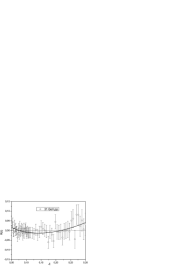
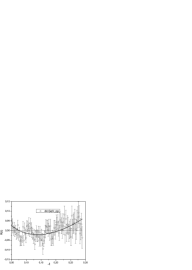
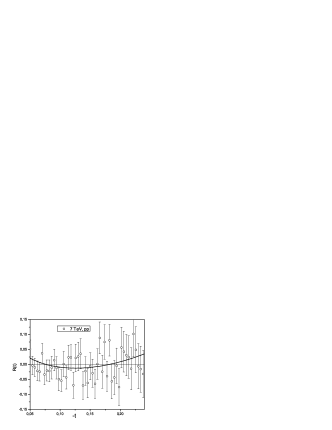
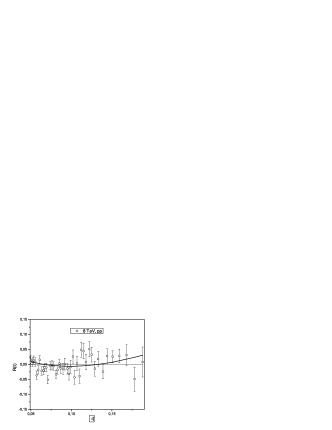
The value around GeV2 means that the experimental data are not compatible with a simple exponential.
5 Tiny oscillations?
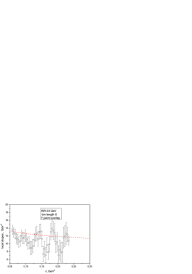
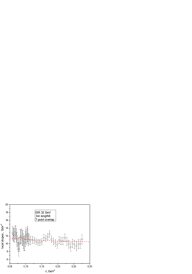
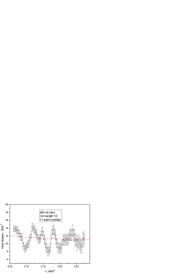
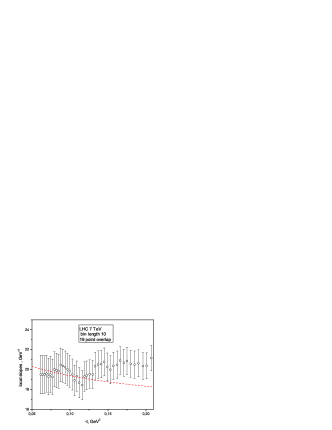
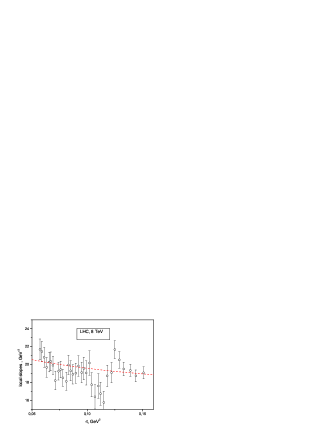
Besides the ”break” discussed above, small- oscillations on the smooth exponential cone may also be present. They were discussed in a number of papers - theoretical and experimental [14], [22, 23, 24, 25, 26]. Since the amplitude of the possible oscillations appear to be close to the error bars, it is still not clear whether this is an experimental fact or an artefact. In Refs. [13, 14] the low- data were fitted to a model which, apart from the cut, contains also an oscillating term (in the cross section or in the slope ):
| (7) |
where and are fitted parameters. The result is shown in Figs. 8 and 9. The dashed curve are calculated from Eqs. (1)-(6) and they correspond to the smoothed part of (7), see Ref. [14]. Note that, since the derivative of an oscillating function is also oscillating, it makes little difference whether one is fitting the cross sections or the slope.
The overlapping bins method (see Appendix) may be extremely usefu in performing this delicate analysis. Since the earlier (theoretical and experimental) results are still inconclusive, new measurements (e.g. those by the Denisov group in Protvino [25]) are very important to shed new light on this phenomenon.
The physics behind the possible low-, small amplitude oscillations may be related to those at large impact parameters. As discussed in Ref. [33], large-distance residual Van der Waals forces may be responsible for these oscillations.
6 Conclusions
We conclude that the ”break” observed [3, 5, 6] by TOTEM near GeV2 at GeV is a ”recurrence” of a similar structure seen in 1972 at the ISR.
Note that the break was not seen at the Tevatron at TeV. Possible reasons for the non-appearance of the break in may be relaled to the Odderon contribution masking it.
While the change of the slope near appears to be a universal and well established phenomenon (although its energy (in)dependence needs better understanding), the status of the tiny oscillations is still ambiguous. It may be that the ”break” near GeV2 is part of the oscillations [14].
Acknowledgements
Useful discussions and correspondence with Mirko Berretti, Tamás Csörgő, Simone Giani and Jan Kaspar are acknowledged. We thank Andrii Salii for his help in preparing the manuscript.
7 APPENDIX: The overlapping bins method (OBM)
The fine structure of the diffraction peak in the differential and elastic cross section was first observed in [21] at the ISR [8], followed by the UA4/2 experiment [9] by normalizing the differential cross-section to the smoothly varying background in the impact parameter representation [23]. In [22] an attempt was made to relate the observed structure near to the variation of the opacity in space, probably reflecting the density oscillation in matter. The possible existence of oscillations with even smaller periods was discussed by several authors [29].
In ref. [13] an entirely different method of identifying the fine structure in the and elastic scattering was proposed. The method, unlike the that of [30], is based on the use of overlapping bins of local slopes. Small oscillations, over the exponential done, with a charactiristic period were discovered. It is obvious that, in order to determine the nature and periods of the oscillations, one first has to improve the reliability of the initial information contained in the experimental data by suppressing the influence of statistical fluctuations. This problem can be settled by means of the well known method of maximum entropy [34], used in many areas of physics. Recently it has been applied [35] to the hadron scattering data.
The method is based on the use of overlapping bins of local slopes.
To check the expected behaviour of the slope
| (8) |
over one must operate with its ”experimental” value.
Provided that
| (9) |
has been measured for a given at -points lying in some interval , we adopt the following procedure. First, we divide this interval into subintervals or elementary ”bins” (with measurements in each of them, assumed for simplicity to be the same for all bins). Once the first bin is chosen, the second bin is obtained from the first one by shifting only one point of measurement (of course, one could shift it by any number of points less or equal to , the shift of one point is the minimal one giving rise to the maximal number of overlapping bins). The third bin is obtained from the second bin by shifting of one data point etc. Thus, we define overlapping bins for a given . For each (-th) bin, must be large enough and its width (in ) - small enough to allow fitting with the simplest form directly involving the -slope (9).The parameter represents the value of the -slope ”measured” at and ”weighted average” . This yields the ”experimental” values of with the corresponding standard errors determined in the fit of (9) to the data. Then the procedure is to be repeated for all bins and ultimately for the other ’s at which the have been measured. A regular structure in the local slope of diffraction cone was found by procedure of the overlapping bins described above and applied to experimental data [13]. However if one has the bins of points and shifts them at each step by one only, the overlap my be so strong that the information from the neighbors is extremely correlated and one can ascribe the regular tendency of the final plot increase (or decrease) in many neighboring bins to thus correlation.
To resolve these doubts, the local slopes were re-evaluated with the help of the Overlapping Bins Metod (OBM) by the LSQ method with so called ”non-independent ’s” [32].
Rather than minimizing the functional
| (10) |
the form
| (11) |
can be used.
In the framework of the OBM calculus
| (12) |
Calculations using correlation over Eq. (12) for the same set of points indicate that the errors are reduced and oscillations are revealed more distinctly, i.e. the relation between the value of errors and the amplitude of oscillation can be improved.
References
- [1] TOTEM Collab., G. Antchev et al., arXiv: 1110.1395.
- [2] TOTEM Collab., G. Antchev et al., Europhys. Lett. 101 (2013) 21002.
- [3] Mirko Berretti, TOTEM results, presented at ”Diffracion 2014”, Primosten, Sept. 2014, to be publ. in the Conference Proceedings.
- [4] Simone Giani, Contribution at the Xth Workshop on Particle Correlations and Femtoscopy (WPCF-2014), Gyongyos, Hungary, Sept. 2014.
- [5] Jan Kašpar, TOTEM results on elastic scattering and total cross sections, presented at the International Workshop on High-Energy Physics, Protvino, June 2014: to be published in the Conference Proceedings.
- [6] Fabrizio Ferro, TOTEM elastic scattering etc., Contribution at the ”Low-x” Meeting in Kyoto, 2014.
-
[7]
L. Jenkovszky, presentation at the HEPFT2014 conference:
https://indico.cern.ch/event/269671/other-view?view=cdsagenda,
to be published in the Proceeings. - [8] B. Barbiellini et al, Phys. Lett. B 39 (1972) 663.
- [9] M.Bozzo at al, Phys. Lett. B 147 (1984) 385
- [10] P. Desgrolard, J. Kontros, A.I. Lengyel, E.S. Martynov. Nuovo Cim. 110A, 615 (1997).
- [11] L.L. Jenkovszky, A.I. Lengyel, D.I. Lontkovskyi, The Pomeron and Odderon in elastic, inelastic and total cross sections at the LHC, Int. J. Mod. Phys. A26 (2011) 4755-477; arXiv:1105.1202.
- [12] G. Cohen-Tannoudji et al., Lettere Nuovo Cim. 5 (1972) 957.
- [13] J. Kontros, A. Lengyel, in Strong Interaction at Long Distances, L.L. Jenkovszky, Ed. (Hadronic Press, Palm Arbor) (1995) 67.
- [14] J.E. Kontros, A.I. Lengyel, Ukr. J. Phys., 40 263 (1995); ibid. 41 290 (1996).
- [15] J.R. Cudell, A. Lengyel, E. Martynov. Phys.Rev.D 73 (2006) 034008.
-
[16]
File with the data ”alldata-2.zip” is available at the address:
http:/www.thwo.phys.ulg.ac.be/alldata-v2.zip. - [17] R. Amaldi et al. Nucl. Phys. B166 (1979) 301.
- [18] P.D.B. Collins, An introduction to Regge pole & high energy physics, Cambridge University Press, 1977.
- [19] G. Cohen-Tannoudji et al., Fortschritte der Physik, 21 (1972) 427.
- [20] A. Donnachie, P.V. Landshoff. Nucl. Phys. B 267, 690 (1986).
- [21] J.N. White, Nucl. Phys. B 51 (1973) 23.
- [22] S. Saul Barshay, Patrick Heiliger, Dieter Rein. Z.Phys.C. 56, 77 (1992); A. Arnold, S. Barshay, Nuovo Cim. 35A (1976)457;
- [23] S. Barshay, P. Heiliger, Z. Physik C 64 (1994)675 and references herein.
- [24] O.V. Selyugin, Oscillation of the hadronic amplitude at small transfer momenta in the Proceedings of the conference ”Hadrons-95”, edited by G. Bugrij et al., Kiev, 1994, p. 65; Phys.Lett. B333, 345 (1994).
- [25] Yu.M. Antipov et al., - and Elastic Scattering in the Momentum Range 29-65 GeV/ñ, Serpukhov, 1976, p.44. (IHEP 76-95 preprint).
- [26] V. Ezhela et al. Diffraction 2002: Proceedings of the NATO Advanced Research Workshop, Edited by R. Fiore et al., Lluwer Academic Publishers, v.101, 2002, p. 47.
- [27] C. Bourrely, J. Soffer, T.T. Wu, Phys. Lett. B 313 (1993) 195.
- [28] C. Augier et al, UA4/2 Collaboration, Phys. Lett. B 316 (1993) 448. 30
- [29] P. Gauron et al, Phys. Lett. B 397 (1997) 305. 21
- [30] A. Schiz et al. Phys. Rev. 172, 1413 (1968).
- [31] CERN Computer Center Program Library, D506.
- [32] Review of Particle Physics, Phys. Rev. D, 54 (1996) 161.
- [33] E.A. Kuraev, P. Ferro and L. Trentadue, Possible manifestation of long range forces in high-energy hadron collision, JINR Preprint E3-97-95 (Dubna) 1997.
- [34] B. Buck and V.A. Macaulay (eds), Maximum Entropy in Action, (Oxford: Clarendon) (1991).
- [35] O. Dumbrajs, J. Kontros, A. Lengyel, J. Phys. G26 20001321.