BEAM–BEAM EFFECTS IN SPACE CHARGE DOMINATED ION BEAMS ††thanks: Work supported under Contract Number DE-AC02-98CH10886 with the auspices of the US Department of Energy
Abstract
During low-energy operations below the regular injection energy in the Relativistic Heavy Ion Collider (RHIC), significant beam lifetime reductions due to the beam–beam interaction in conjunction with large space charge tune shifts have been observed. We report on dedicated experiments aimed at understanding this phenomenon as well as preliminary simulation results, and propose alternative working points to improve the beam lifetime in future low-energy RHIC runs.
1 INTRODUCTION
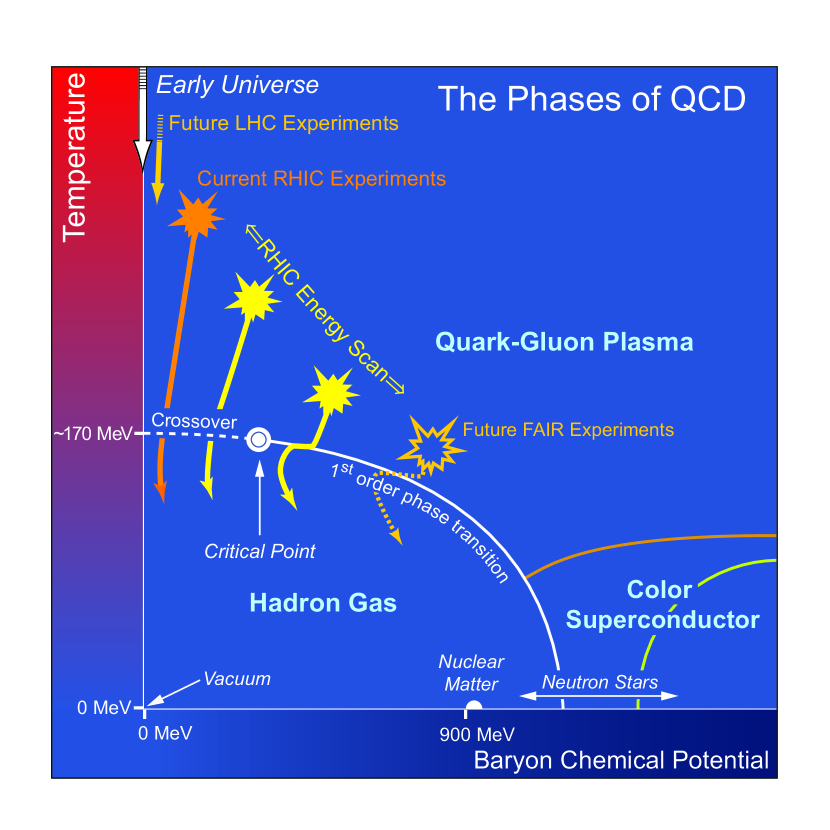
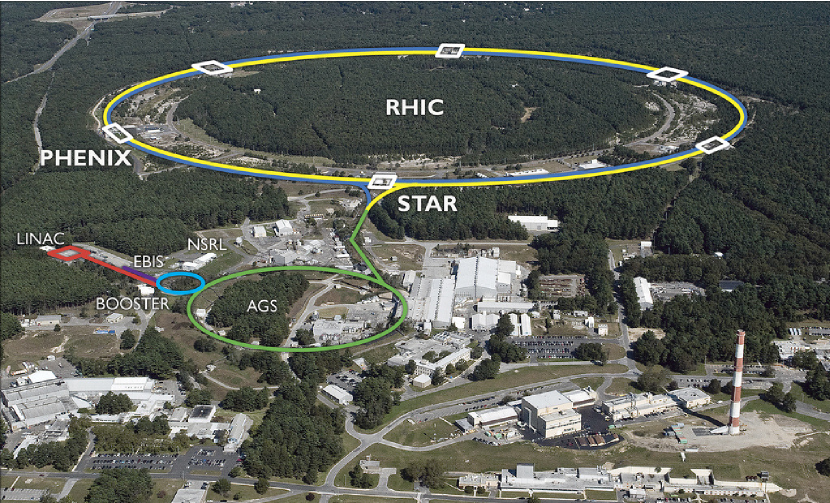
One of the major physics programmes at the RHIC for the next 5–10 years is the search for the critical point in the Quantum ChromoDynamics (QCD) phase diagram (Fig. 1), which is expected to occur at centre-of-mass energies in the range of = 5–30 GeV/n. This requires colliding gold beams with energies between 2.5 and 15 GeV/nucleon, which is well below the nominal energy range of 10–100 GeV/n in the RHIC (Fig. 2). In conjunction with the circumference of 3.8 km, this low energy results in a significant direct space charge tune shift up to which is more than ten times larger than the total beam–beam parameter encountered during low-energy operation [1]. Experiments with a large beam–beam parameter comparable with the space charge tune shift have been performed using protons and are reported elsewhere [2]. Table 1 lists space charge and beam–beam parameters achieved in the RHIC for different Au beam energies. However, in spite of the large difference in magnitude of these two effects, and the similar functional dependence of the associated forces on transverse particle coordinates, we have observed a significant deterioration of beam lifetimes once beams are brought into collision.
To gain a better understanding of this phenomenon, we have performed a series of beam experiments and developed a simulation code. In the following sections, we describe our experimental observations during regular low-energy operations with Au ions, as well as those dedicated Au beam experiments. Furthermore, we report on first results obtained from simulations.
| E [GeV/n] | [s] | ||
|---|---|---|---|
| 9.8 | 0.03 | 0 | 2000 |
| 9.8 | 0.03 | 0.002 | 600 |
| 5.75 | 0.05 | 0 | 1600 |
| 5.75 | 0.05 | 0.0015 | 400 |
| 5.75 | 0.09 | 0 | 700 |
| 5.75 | 0.09 | 0.0027 | 260 |
| 3.85 | 0.11 | 0 | 70 |
| 3.85 | 0.08 | 0.003 | 70 |
2 EXPERIMENTAL OBSERVATIONS
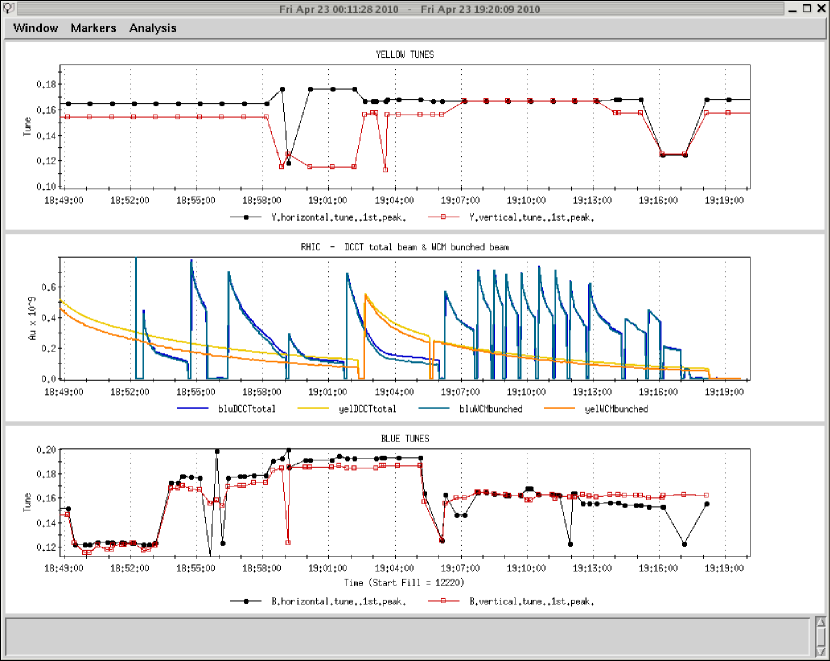
When the RHIC was operated at a beam energy of a tune scan was performed to maximize the beam lifetime. Starting at the regular RHIC heavy ion working point of the tunes were lowered and the beam lifetime in collision was observed (see Fig. 3). This resulted in a new working point of ; during the course of the run this was further lowered to This latest working point was subsequently used at as well.
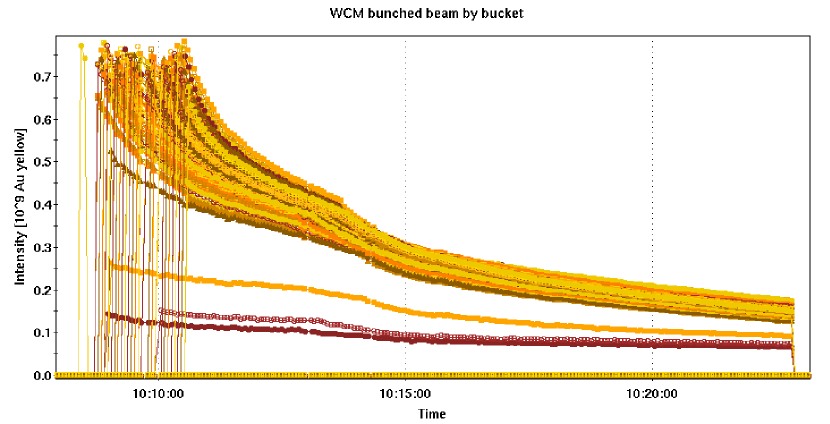
During the course of the run, a strong effect of beam–beam interactions on the lifetime of the space charge dominated beams was consistently observed, as illustrated in Figs. 4–6. Figure 4 shows the intensity of individual bunches in the Yellow RHIC ring at a beam energy of Although the initial intensity drops rather quickly for the first couple of minutes while beams are not colliding, there is a sudden, sharp decrease in beam lifetime, to roughly the same level as at the beginning of store, as soon as the two beams begin colliding. Since the intensity of the Yellow bunch at this time is only about half the initial value, which reduces the space charge tune shift by the same factor of 2, this lifetime deterioration cannot simply be explained by the total tune shift; that is, the sum of the space charge and beam–beam tune shift. Moreover, a significant beam–beam effect is observed for bunches with a much smaller intensity, as can be seen in Fig. 4.
As a second example, we discuss the evolution of the total intensity of the Yellow beam at while the Blue ring is being filled (Fig. 5). In this case, there is no transverse separation of the two beams during the injection process, so the injection of each individual Blue bunch results in a Yellow bunch starting to experience beam–beam collisions. As a result, the total Yellow beam lifetime slowly deteriorates the more bunches undergo collisions with the newly injected Blue bunches.

Finally, we focus on the beam decay rate at the end of a Au store with beam energy (Fig. 6). When the beam–beam force on the Blue beam disappears due to dumping of the oncoming Yellow beam, its decay rate improves dramatically.

Based on operational experience and the desire to improve beam lifetimes and therefore integrated luminosities in future RHIC low-energy runs, a dedicated beam experiment aimed at searching for a better working point was performed. Since the spacing of non-linear resonances is largest in the vicinity of the integer resonance, fractional tunes below were proposed as the most promising candidates. These studies were performed at the regular RHIC injection energy of with a space charge tune shift of and a beam–beam tune-shift parameter of
As already observed during low-energy operations, the beam lifetime deteriorated substantially when the two beams were brought into collision at the regular RHIC working point of (Fig. 7).

However, when the experiment was repeated at a near-integer working point of in Yellow and in Blue, there was no discernable effect on the Blue lifetime, while the Yellow lifetime still deteriorated somewhat when beams were brought into collision, as shown in Fig. 8.

The cause of the differing behaviour in the two rings is not yet understood. It may be attributable to parameters such as chromaticity, coupling control, or the different working point above the diagonal, which may have been less than optimal in the Yellow ring during the experiment. However, this result is very encouraging for future low-energy operations, although the space charge tune shift during this injection energy experiment was a factor of 2–3 smaller than at the lower energies.
3 SIMULATIONS
To investigate the root cause of the lifetime deterioration, we performed tracking simulations with a space charge tune shift of and a beam–beam parameter in each of the two RHIC interaction points of Using these parameters, tune scans as well as a frequency map analysis at a fixed working point were applied.
3.1 The Model
Space charge simulations are usually very CPU-time consuming because of frequent recalculations of the particle distribution and the associated electromagnetic fields. In the particular problem studied here, however, we can take advantage of the fact that the evolution of the particle distribution is comparatively slow. This is indicated by the beam lifetime of several minutes to tens of minutes. Typical simulations track particles only over a number of turns that corresponds to seconds of real time, so we can safely assume that the distribution of our test particles does not change appreciably over the course of the simulation. This approach, which is equivalent to the weak–strong simulation technique applied in numerical beam–beam studies, significantly speeds up the computation. In addition, no artificial noise is introduced into the simulation by the finite number of particles, since recalculation of the electromagnetic fields from the actual particle distribution is avoided. Instead, we assume that the distribution remains Gaussian during the entire simulation process. The r.m.s. width of this Gaussian distribution is calculated from the beam emittance and the local function, including the dynamic -beat introduced by the space charge and beam–beam forces around the machine. The accelerator model is based on the RHIC lattice as described in MAD. So far, no lattice non-linearities except the chromaticity correction sextupoles and the sextupole error in the main dipoles have been included. Particles are tracked element by element, and space charge kicks are applied at every quadrupole around the machine. Two beam–beam interaction points are included in IPs 6 and 8. Synchrotron oscillations are included, and the modulation of the space charge kick due to the resulting longitudinal position oscillations is taken into account.
3.2 Results
To study the emittance growth as a function of tune, we launch 1000 particles with a Gaussian distribution in all six phase space coordinates and track them over 20 000 turns. At the end of each turn , we calculate the 4-D transverse emittance:
| (5) |
where indicates the average over all particles. The emittance growth rate
| (6) |
is then computed as a function of tune by a linear fit to this 4-D emittance evolution.
For the initial tune scan, depicted in Fig. 9, we varied the tunes in steps of with In the absence of the beam–beam interaction, the 4-D emittance growth rate at fractional tunes below 0.2 is significantly lower than above, which qualitatively agrees with experimental observations. Once beam–beam interactions are added, the emittance growth rate increases over most of the tune range; however, the resulting growth rate is, within error bars, independent of tune.

To determine the tune footprint and the tune diffusion frequency, map analysis [3, 4] was applied at a fixed working point of for the two cases with and without beam–beam interaction. For this purpose, we track a single test particle over turns and apply fast Fourier transforms to calculate the horizontal and vertical tunes and for the first and second turns. To increase the tune resolution, we apply an interpolation technique [5].
The tune diffusion is measured as
| (7) |
The resulting tune footprint and tune diffusion is plotted in Fig. 10. While the tune footprint overlaps the coupling resonance with as well as without beam–beam interaction, the presence of the beam–beam force significantly enhances the tune diffusion around that resonance.

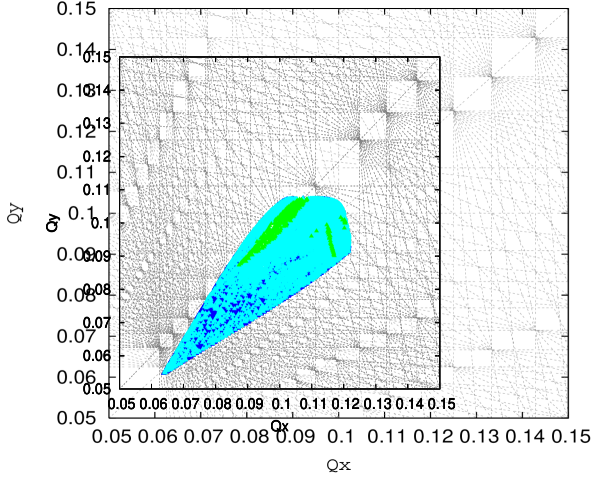
Plotting the same data in the amplitude space (Fig. 11) reveals that this enhanced tune diffusion occurs for amplitudes in the region and


As shown above, the largest tune diffusion occurs around the coupling resonance. This behaviour suggests that it might be beneficial to increase the tune split between the two planes, thus selecting a working point further away from the coupling resonance. To study this hypothesis, we performed a tune scan with and determined the 4-D emittance growth rates. As shown in Fig. 12, the effect of the beam–beam interaction on the emittance growth rate is significantly reduced.

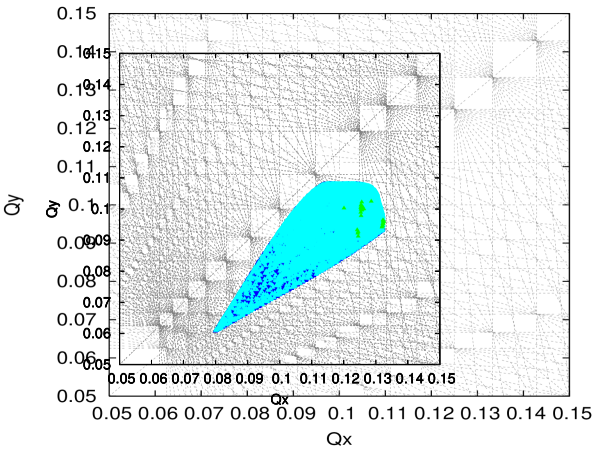


This observation is supported by the results of a frequency map analysis for the working point (Figs. 13 and 14), which shows little effect of the beam–beam interaction on tune diffusion.
While this result is certainly very encouraging in terms of improving the machine performance, it is worthwhile repeating that our model so far does not include any magnet non-linearities beyond sextupoles, which may lead to increased tune diffusion around the associated non-linear resonances in the presence of the beam–beam interaction.
4 Summary
We have studied the effects of beam–beam interactions in colliding beams with large direct space charge parameters up to both experimentally and through simulations. During RHIC low-energy operations as well as dedicated experiments, we have consistently observed a strong effect of the beam–beam interaction on the lifetime of the stored beam, although the associated beam–beam parameter was about an order of magnitude smaller than the space charge tune shift.
To provide the maximum tune space between non-linear resonances, we have operated the RHIC at a near-integer working point. In this case, we observed no discernable lifetime reduction in the Blue ring, while Yellow still suffered. The root cause of this difference between the two rings is still unknown, and may be related to parameters such as chromaticity and coupling control, or the particular working point during the experiment. However, this result is very encouraging for future low-energy runs, although the corresponding space charge tune shift of was comparably modest.
Although a quantitative comparison of our simulation results with experimental observations in the RHIC is difficult due to the lack of effects such as intra-beam scattering in the simulation code, the tracking model presented here qualitatively reproduces the main experimental result, namely the strong effect of the beam–beam interaction in the presence of a large space charge tune shift. Based on these simulation results, an alternative working point further away from the coupling resonance which appears to be the main source of emittance growth in our simulations, may be beneficial. However, it is of utmost importance to repeat these simulations after higher-order multipole errors have been added to the tracking model, which may lead to a further reduction of the usable tune space.
References
- [1] A. Fedotov et al., “Beam Lifetime and Limitations during Low-Energy RHIC Operation,” Proc. PAC’11.
- [2] A. Fedotov et al., “Interplay of Space Charge and Beam–Beam Effects in a Collider,” Proc. HB2010 (Morschach, Switzerland, 2010), p. 634.
- [3] J. Laskar, Physica D 67 (1993) 257.
- [4] J. Laskar and D. Robin, Part. Accel. 54 (1996) 183.
- [5] A. Bazzani et al., Part. Accel. 147 (1996) 147.