High-Energy Properties of the Enigmatic Be Star Cassiopeiae
Abstract
We present the results of a broad-band X-ray study of the enigmatic Be star Gamma Cassiopeiae (herein Cas) based on observations made with both the Suzaku and INTEGRAL observatories. Cas has long been recognized as the prototypical example of a small subclass of Be stars with moderately strong X-ray emission dominated by a hot thermal component in the 0.5-12 keV energy range (). This places them at the high end of the known luminosity distribution for stellar emission, but several orders of magnitude below typical accretion powered Be X-ray binaries. The INTEGRAL observations spanned an 8 year baseline and represent the deepest measurement to date at energies above keV. We find that the INTEGRAL data are consistent within statistics to a constant intensity source above 20 keV, with emission extending up to 100 keV and that searches for all of the previously reported periodicities of the system at lower energies led to null results. We further find that our combined Suzaku and INTEGRAL spectrum, which we suggest is the most accurate broad-band X-ray measurement of Cas to date, is fitted extremely well with a thermal plasma emission model with a single absorption component. We found no compelling need for an additional non-thermal high-energy component. We discuss these results in the context of a currently favored models for Cas and its analogs.
1 INTRODUCTION
Classical Be stars are B stars whose spectra contain emission lines from H I while also showing evidence for rapid rotation and equatorially concentrated circumstellar disks [see Rivinius, Carciofi, & Martayan (2013) for a recent review of Be stars]. Cas, also known as HD 5394, was the first known Be star (Secchi 1867). It is of spectral type B0.5 IVe (Tokovinin 1997) and is at a distance of 188 pc (Chevalier & Ilovaisky 1998) with a mass that has been estimated to be in the range 13-18 M⊙ (Zorec et al. 2005; Harmanec et al. 2000; Gontcharov et al. 2000; Tokovinin 1997). In addition to being the prototypical member of its subclass and one of the brightest, it has been source of extensive study due to its unexpected X-ray properties.
Cas has previously been studied in the X-ray band and found to have luminosities in the range and (e.g. Smith et al. 2012, 2004; Owens et al. 1999). This is significantly larger than the typical X-ray luminosity for single O and B stars (Nazé 2009; Oskinova 2005; Helfand & Moran 2001; Pallavicini et al. 1981) yet smaller than the X-ray luminosity of Be-neutron star binary systems which during quiescence typically exceed and during outburst can exceed (e.g. Negueruela 1998). There are two classes of models for producing the observed X-rays in Cas. The currently favored one invokes a magnetic star-circumstellar disk interactions (Robinson et al. 2002) while others involve accretion onto a putative white dwarf binary companion. There are now as many as 10, and possibly 12, similar stars identified in the literature e.g. (Nebot, et. al. 2013; Rauw 2013; Motch 2009; Lopes de Oliveira et. al. 2006; Safi-Harb et. al. 2007) sometimes called Cas analogs. Each are Be stars of similar spectral type (B0.5 - B1.5) with similar X-ray luminosities. Three are apparently in clusters and it has been suggested that they may be blue stragglers which is another possible clue as to their underlying nature (Marco et. al. 2007).
The soft X-ray spectrum (below 12 keV) of Cas is thermal in nature, being well approximated by optically thin thermal plasma models (Smith et al. 2012, 2004; Owens et al. 1999; Kubo et al. 1998; Smith et al. 1998) and it apparently consists of multiple components (Smith et al. 2012; Lopes de Oliveira et al. 2010). Above 10 keV, it is roughly similar in terms of luminosity and spectral energy distribution to hard-X-ray selected cataclysmic variables (CVs) which are primarily intermediate polars (Landi et al. 2009; Revnivtsev et al. 2008). The presence of a white dwarf binary companion has often been suggested as the source of the X-ray emission. However, those objects typically exhibit significant flux and spectral variability above 20 keV on measurable timescales, e.g. Scaringi et. al. (2010); Landi et al. (2009). Furthermore, there is no compelling evidence in Cas for the presence of the periodicities that are predominant in CV power density spectra.
Recently, Torrejón et al. (2012) have presented a comprehensive broad-band X-ray spectral study of the -Cas analog HD 110432; also see Lopes de Oliveira et al. (2007). They found that multiple temperature components, possibly including a very hot thermal or non-thermal powerlaw, are needed to adequately fit their data. This result helped motivate us to further explore the brighter and more extensively studied Cas and in particular to make use of the unprecedented body of high-energy observational data now available from Suzaku and INTEGRAL. In particular, the Cassiopeia sky region received extensive INTEGRAL exposure during the first 8 years of the mission driven largely by nuclear astrophysics studies of the Cas-A remnant.
Previous temporal analysis of the X-ray emission from Cas has revealed the presence of two components (Smith et al. 1998): 1) a “basal” component that varies on timescales of hours and contributes 70% of the X-ray flux, and 2) a “shot” component characterized by fluctuations on timescales of seconds to minutes. Henry & Smith (2012) recently established a revised and more accurate value for the optical signal modulation that they attribute to the stellar rotation period. Their new value is days, obtained using a comprehensive photometric history spanning a 14-year baseline. If the high-energy emission is, for example, associated with putative magnetic regions on the Be star modulation at this period could occur. However, that would require a field topology that is stable on much longer time scales than the period. Cas is also known to have a binary companion in a 203.55-day nearly circular orbit(, e.g. (Nemravová et al. 2012), which is considered unlikely to be associated with the X-ray emission (Smith et al. 2012). We note that Henry & Smith (2012) can rule out photometric modulation at the binary period at the level of 5 mmag.
Other variability patterns are evident as well. Henry & Smith (2012) have identified cycles of amplitudes 0.02-0.03 mag with typical 2-3 month durations. These are in turn superimposed on the smaller amplitude 1.21-day signal attributed to the stellar rotation period. Color dependence was also evident as the V -band cycles to be 30% - 40% larger than the B-band cycles. Corresponding variability patterns in the high-energy emission could reveal deeper insight into its origin. Thus, searches for periodic and/or stochastic variations in our data were made.
In this paper we consider the hard-X-ray properties of Cas in the context of this emerging multi-wavelength picture. Our goals are to address the flux history and possible spectral evolution on a range of timescales and interpret our results in the context of current models for the high-energy emission. Of particular interest is the presence, or not, of a non-thermal high-energy component. In Section 2 we discuss our data collection and basic analysis. In Section 3 we present results of our imaging, temporal, and spectral analyses. We consider the high-energy spectral energy distribution in greater detail, combining the INTEGRAL data with X-ray data obtained with Suzaku, and in particular offer arguments in support of our assertion that in addition to the broad thermal X-ray continuum, a high-energy component is not required to fit the data. In Section 4 we discuss the possible implications of this spectral component along with the apparent lack of high-energy variability and offer our conclusions.
2 OBSERVATIONS AND DATA ANALYSIS
In this paper we present the results of the accumulated INTEGRAL hard X-ray/-ray observations of Cas that span about 8 years. In addition, we have obtained 52 ksec of Suzaku observations with XIS and HXD instruments providing a high-quality spectral determination over the nominal range of keV.
2.1 INTEGRAL
The INTEGRAL imager, IBIS, is a coded mask instrument which has a wide field of view (FOV) of 29∘ 29∘ (9∘ 9∘ fully coded) with a point spread function (PSF) of 12′ (FWHM) and is sensitive over the energy range 15 keV to 10 MeV. For a complete description of the INTEGRAL spacecraft and mission refer to Winkler et al. (2003). There are two IBIS detector layers: ISGRI, an upper CdTe layer with peak sensitivity between 15 and 200 keV, and PICsIT, a bottom CsI layer, with a peak sensitivity above 200 keV (Ubertini et al. 2003). In this paper we have used only ISGRI data.
We have analyzed the public data from all spacecraft pointings, or ”Science Windows”, herein “SCWs”, obtained between December 2002 and February 2011 for which Cas (J2000 = 14.177, = 60.717) was within of the pointing direction. The resulting dataset consisted of 2610 SCWs. Data reduction was performed using the standard OSA 9.0 analysis software package available from the INTEGRAL Science Data Center. Spectral and timing analyses were performed using the XSPEC and XRONOS data analysis packages, respectively.
2.2 Suzaku
The Suzaku satellite (Mitsuda et al. 2007) observed Cas on 2011 July 13. During our Suzaku observations (obsid: 406040010), two sets of instruments were used: the X-ray Imaging Spectrometer (XIS, Koyama et al. 2007) on the focal plane of the thin-foil X-Ray Telescope (XRT, Serlemitsos et al. 2007) and the Hard X-ray Detector (HXD, Takahashiet al. 2007; Kokubun et al. 2007). These instruments operate simultaneously on every observation: the net exposures of the XIS and the HXD are 55.4 ksec and 52.3 ksec, respectively. A detailed description of the Suzaku spacecraft and mission can be found in the Suzaku technical description111http://heasarc.nasa.gov/docs/Suzaku/prop_tools/Suzaku_td/.
The XIS comprises four X-ray CCD cameras, XIS03, three of which (XIS0, 2 and 3) use front-illuminated (FI) CCD chips and one (XIS1) does the back-illuminated (BI) chip. The FI has good harder X-ray sensitivity, covering 0.510 keV, while the BI has sensitivity down to 0.3 keV. The XIS2 was fatally damaged on 2006 Nov 9 by a micro-meteorite, so that during the observations, three instruments (XIS0, 1, 3) were in operation. Each CCD was operated using the Spaced Charge Injection (SCI) technique, which improves the spectral resolution with a sacrifice of the effective imaging area. The XRT has a butterfly-shaped point spread function (PSF) with the half power diameter (HPD) of 2′. The HXD comprises two types of detectors, the PIN with the sensitivity between 1570 keV and the GSO between 40600 keV. Since Cas is not bright enough between 40600 keV for the GSO, we only analyzed the PIN data. The PIN detector has a collimator with a 34′34′ fov, on the bottom of which are PIN Si diodes installed. There is no other known hard X-ray source in the PIN fov nor is any seen in the INTEGRAL image that could contaminate to the Cas spectrum.
Cas was put at the XIS on-axis (XIS nominal) position. The XIS was operated with the normal mode (no window option) because the count rate of Cas on each XIS, 6.6 counts s-1, was lower than the pile-up threshold. However, the XIS pileup estimator (Yamadaet. al. 2012) derived small pile-up of 3% at the PSF core, which flattens the XIS spectrum above 9 keV. We therefore excluded XIS spectra above 9 keV for these observations. In the data analysis, we used the HEASoft version 6.15 and the CALDB version HXD (20110913), XIS (20130916), XRT (20110630).
3 RESULTS
3.1 INTEGRAL Imaging Analysis
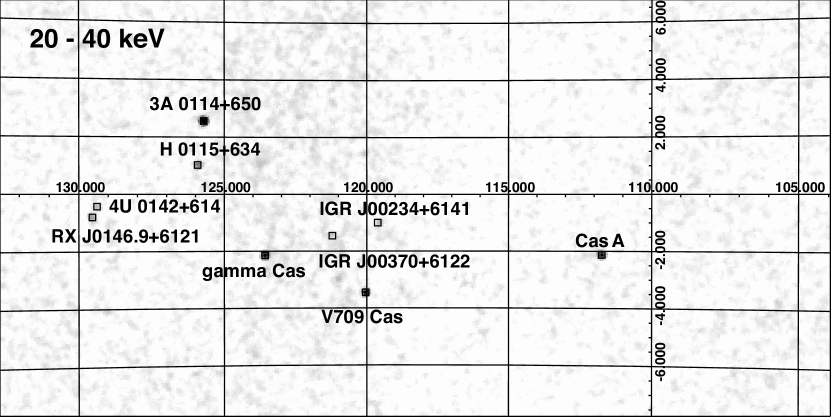
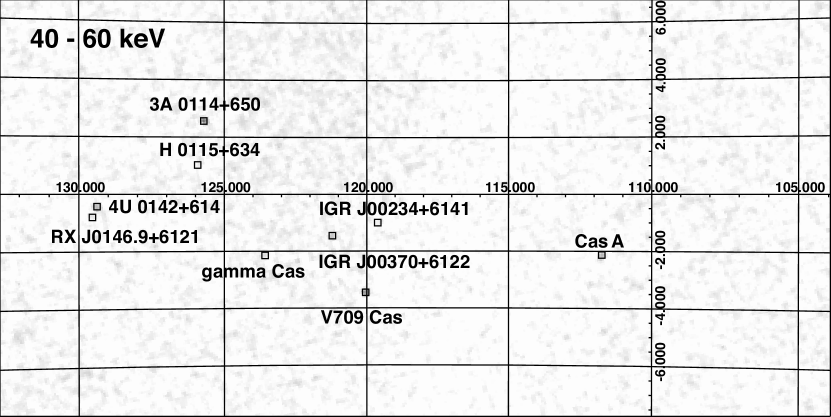
We used the OSA 9.0 software to produce mosaic images of the Cas region in 3 broad energy bands: 20-40 keV, 40-60 keV, and 60-100 keV. In Figure 1 we show the 20-40 keV and 40-60 keV significance maps including all 2601 science windows. They clearly indicate an unambiguous detection of the source and its association with Cas. The detection significance using the full dataset is 63.5 and 13.3 in these hard bands. It is thus evident that Cas has a relatively steep spectrum in this energy range.
Mosaic maps from subsets of the total dataset were inspected to determine a list of sources to include during the spectral and timing analysis steps. This was done to ensure that low duty cycle, transient sources would be accounted for. The datasets consisted of all SCWs from 100 orbit blocks of data. i.e. from orbits 1-100, 101-200, etc. We found 16 sources in the region around Cas that we detected at the 5 level or greater during at least one subset. These sources, that are labeled in Fig. 1, were included in our coded mask solution, leading to the background subtracted image of Fig. 1, as well as in our and spectral extraction procedure. Fourteen of these other sources are associated with previously known X-ray sources and the two new IGR sources have subsequently been associated with a CV (IGR J00234+6141) and a high-mass X-ray binary (IGR J00370+6122) (Bird et al. 2010).
3.2 INTEGRAL Timing Analysis
As noted earlier, Cas has been shown to exhibit photometric variations with a 203.55 day periodicity which has been speculatively associated with the orbital motion of a 1 M⊙ companion in a near circular orbit (Harmanec et al. 2000). In addition, a 1.2-day modulation has been seen in the B- and V-band photometric monitoring of Henry & Smith (2012), also see Smith et al. (2006); Harmanec et al. (2000), which is believed to be due to the rotation of the Be star. Previous studies have suggested the possible association of a 1-day modulation with a white dwarf companion (Apparao 2002), although that was based on the inaccurate period determination of Smith et al. (1998) and the stellar rotation interpretation is now favored.
The INTEGRAL data set is perfectly suited to produce a long-term lightcurve in order to search for modulations associated with these periodicities and other possible periodicities as well as for stochastic variability. If, for example, the hard-X-ray emission is associated with particle acceleration resulting from a magnetic disk-star interaction scenario, it is not unreasonable to expect the 1.21-day period to emerge, or at least variations at comparable timescales.
We constructed light curves based on single science windows flux determinations in the 20-40 keV and 40-60 keV energy intervals. We then binned the resulting series into sample sizes appropriate for a general variability searches and for period searches, focusing on the published X-ray and optical-UV period determinations.
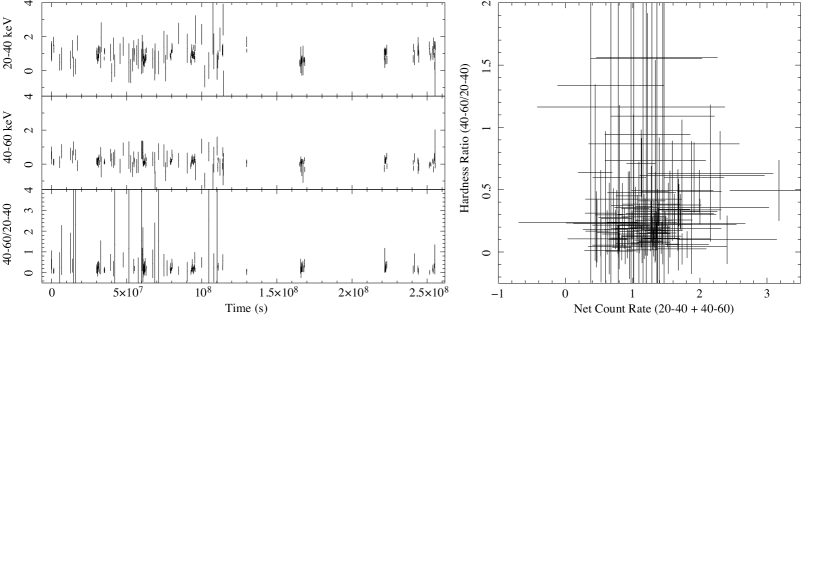
The flux history of Cas is shown in Figure 2 where we show the 20-40 keV, 40-60 keV, and ratio light curves rebinned into 48 hour time bins from the intrinsic 2000s single-science window time samples (which defines our maximum time resolution) reflecting the typical length of an INTEGRAL pointing. We also present the hardness-intensity diagram derived from these measurements in the right hand panel. From Figure 2 we can see by visual inspection that there is no evidence for large flares but, since some time periods are sparsely sampled, the possibility of low-amplitude flaring cannot be ruled out. We thus formally tested whether light curves, from this time series as well as with several more coarsely binned ones, were consistent with being constant using the chi-square statistic and computing the mean and expected variance for the assumption of a steady source. We did this for different ranges of timescales by binning the data into relatively short (0.5-day) and long (30-day) time intervals. The results in all cases were consistent within statistics to the light curves being derived from a constant intensity source. For example, for 0.5-day bins using the higher signal-to-noise 20-40 keV band, the observed variance was about one third of the mean and equivalent to the expected variance within about 20%. The corresponding null-hypothesis probability was .
We also performed periodicity searches and general tests for variability on the INTEGRAL light curves. We computed the power-density spectra (PDS) for a variety of cases, using the 20-40-keV light curve and the 20-60-keV light curves. We also tried this for the single SCW case, i.e. our maximum time resolutions and for light curves binned at e.g. 8000-s, 1- and 2-day intervals. In none of the resulting PDS did we find excess power at a statistical significance of greater than 2 between the minimum resolvable timescales and 100’s of days.
Additional variability searches were accomplished using a chi-square test on epoch-folded light curves at and around known periods of the system; specifically the 1.21-day and the 202-day periods associated with Be-star rotation and companion-orbital frequencies. We searched several hundred possible periods on intervals about those values and performed a chi-square test for each case, again testing the constant-source null hypothesis. The results were all negative. For example, we used 20-40-keV band 10-phase light-curve bins to search for 128 possible periods centered on 203.55 days. We found the data to be consistent with having such a 203.55-day periodic component to be only at the 41% level of confidence. For a 1.215767-day period search the corresponding confidence level was only 9%. No periodicities were found in the data above a level of 81%.
3.3 Suzaku Timing Analysis
As noted in Section 1, soft X-ray variability on multiple timescales has been well documented. Here we examined our 56-ksec Suzaku integration to search for similar or other unanticipated temporal behavior.
The XIS image shows only one very bright X-ray source, which is Cas. In the XIS data analysis, we defined a source region with a 3′ radius circle centered at Cas, which includes 95% of X-ray photons from the star. We extracted the background from an annulus region with a 5′ inner radius and a 7.5′ outer radius centered at Cas. The HXD/PIN data include significant contamination from non X-ray background (NXB) and cosmic ray background (CXB). The NXB can be estimated at 1.3% uncertainty (1) using the tuned background model (JX-ISAS-SUZAKU-MEMO-2007-09222ftp://legacy.gsfc.nasa.gov/Suzaku/data/background/pinnxb_ver2.0_tuned/). The CXB is estimated from the typical CXB emission (Boldt 1987), which may fluctuate by 30% from region to region (Miyaji et al. 1998).
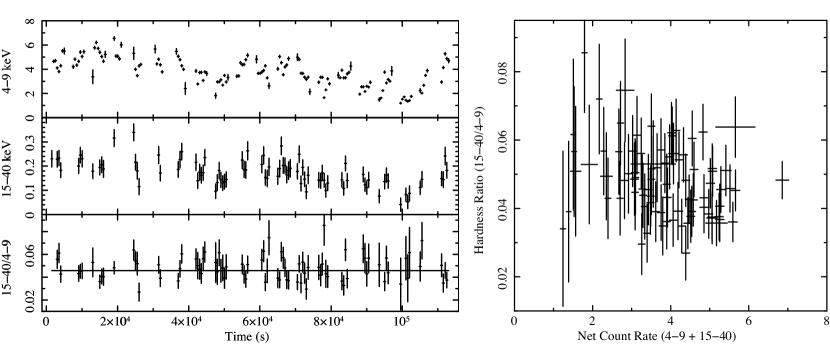
We produced light curves of the XIS FI sensors (XIS0 and XIS3) between 49 keV and the HXD/PIN light curves between 1540 keV. Each XIS sensor collected 0.8 counts s-1 while the HXD/PIN collected 0.16 counts s-1. The combined XIS light curve showed strong spiky variation by 50% on timescales of 1 ksec (Figure 3), which is similar to what was observed with XMM-Newton (Lopes de Oliveira et al. 2010). We also depict the hardness-intensity space behavior based on the same data in the right hand panel of that figure. The flux went down gradually during the observation, reached the lowest flux at 105 sec after the observation start, then recovered to the original flux level. We note that given the relatively short duration of the observation, compared to the INTEGRAL data set we could not address the presence or absence of the reported optical-UV periodicities in this band. We found that the variation fraction in the Suzaku data on 5 ksec timescale is less than a factor of 2.
Since the background uncertainty is more significant in the HXD data, the HXD/PIN light curve generated with the HEASoft tool hxdpinxblc only includes bins with fractional exposures more than 99%. Therefore, some bins in the XIS light curve are not present in the HXD/PIN light curve. The HXD/PIN count rate was nearly constant for the first 7104 sec with a small dip at 5104 sec. This was followed by a steep decline by a factor of 3 between 7104 sec and 105 sec, and then recovery to the original level by the end of the observation. The variation was very similar to that in the XIS 49 keV band. The hardness ratio (HR) defined by the ratio of the HXD/PIN 1540 keV count rate over the XIS 49 keV count rate (bottom panel of Figure 3) does not show any remarkable variation. The HR curve can be accepted by a fit with a constant model at above 90% confidence (reduced = 1.16, d.o.f. = 83).
3.4 INTEGRAL Spectral Analysis
As a first step to explore the INTEGRAL data set we modeled this spectrum independently of the Suzaku data.
We extracted the IBIS/ISGRI hard X-ray time-integrated spectrum for the entire 8-year span using the INTEGRAL OSA tools. Previous analyses of broadband X-ray spectra of Cas have generally found that the spectra were thermal in nature, typically modeled by optically-thin, thermal plasmas, (Smith et al. 2012; Owens et al. 1999; Smith et al. 1998; Kubo et al. 1998; Horaguchi et al. 1994; Murakami et al. 1986) but in some cases a power-law (or cut-off power-law) model plus a Gaussian line also provided an adequate fit (den Hartog et al. 2006; Smith et al. 1998; Kubo et al. 1998; Parmar et al. 1993). We also note the recent analysis of the Cas analog HD 110432 by Torrejón et al. (2012), where the possible presence of a hard, non-thermal spectral component is identified.
A primary objective here is to characterize the shape of INTEGRAL spectrum and given the apparently flat hard X-ray light curves we focused on the time-integrated dataset. This will offer the best opportunity for the foreseeable future to explore possible deviations from the broad-thermal spectral forms currently established. Towards this end, we first fit the keV continuum using a cutoff powerlaw form. Integrated over the 20-100-keV band our best fit model corresponds to a flux of 4.9 ergs/cm2/sec. In order to best test the hypothesis that an additional hard component, perhaps non-thermal in nature, is superposed on the broad thermal emission we first fitted models to the INTEGRAL data alone. We also tried thermal Comptonization spectral forms. In all of these scenarios we found evidence of positive residuals above keV. We thus concluded that the addition of a hard powerlaw component, presumably representing a non-thermal contribution to spectrum, led to a nominal improvement in the quality of the fit. However, an F-Test applied to the two results indicated a probability of only 0.42 that the cutoff powerlaw / thermal Comptonization model fits were improved through the inclusion of the hard tail. Furthermore, that result was strongly dependent on the highest energy channels where the data becomes signal-to-noise limited, and the powerlaw component contributes only about 5% of the flux. In any case our objective was to assess how this scenario would hold up to the further scrutiny of fitting the combined broad band data sets, for which a global continuum model can be more meaningfully constrained.
3.5 Suzaku Spectral Analysis
Cas has been observed by a number of current major X-ray observatories covering the 0.2-10 keV domain including both Chandra and XMM-Newton. Its X-ray spectrum consists of a strong thermal continuum with keV, plus some broad ( km -1) and symmetric X-ray lines which have been modelled by optically thin plasmas (e.g. Smith et al. (2012) . Models have included as many as 4 components, with temperatures ranging from 0.15 to 12 keV, and fluorescence K features from iron and silicon. It should be noted though that the hottest of these putative gas phases is typically the predominant component of the emission contributing more than the combined cooler phases.
In the context of the photoionized plasma models, different iron abundances were inferred between the measurements with the K-shell line that originates from 140 MK plasma and Fe L-shell line complex from the 1-6 MK plasma. Smith et. al. (2004) suggest that these harder X-rays are seen through the dense regions of the circumstellar disk, while most of the X-ray emission is absorbed only by the stellar wind or the outer, less dense regions of the disk. The presence of fluorescence features indeed suggests the presence of gas close to the X-ray emission regions likely associated with the circumstellar medium. These findings are confirmed by analysis of RGS XMM-Newton spectra by Lopes de Oliveira (2010). Those authors report FeXXV and Fe XXVI Ly K line strengths consistent with their inferred 12-14-keV plasma temperature, but with a subsolar Fe abundance of about 0.2 to 0.4. This is puzzling because the chemical abundances of typical B stars within 1 kpc of the Sun are consistent with solar values (Przybilla et. al. 2008).
Figure 4 shows the XIS0+3 and HXD/PIN spectra of Cas above 0.6 keV. The spectrum below 10 keV is similar to those in the earlier Chandra and XMM-Newton observations: hard spectra with three weak emission lines from Hydrogen-like and Helium-like iron and iron fluorescence (Smith et al. 2004; Lopes de Oliveira et al. 2010; Smith et al. 2012). The HXD/PIN spectrum clearly extends up to 40 keV.
Smith et al. (2012) discussed the presence of a deeply embedded (NH 71023 cm-2) hard X-ray component, whose continuum emission is 1/10 of the observed spectrum in the hard energy band. They discussed that an optically thick ejecta from Cas may block a part of the hard X-ray emission, but the Compton reflection of the incident X-ray emission at a surface, which should be accompanied by the iron fluorescence line at 6.4 keV, can produce such a deeply embedded hard X-ray spectrum. We briefly estimated this contribution using the pexmon model in xspec, then the reflection continuum flux can be as high as 1/10 of the direct emission from Cas around 6 keV when the elemental abundance of the reflecting material at 0.32 solar, viewing angle of 30∘ and the reflection scaling factor of 0.3, for example.
Because this reflection component contributes up to a few tens of percent at the energies of interest, we fit the spectrum by a bremsstrahlung model for the continuum and 5 Gaussians for the iron, sulfur and neon emission lines. In this model fit, the model normalization for the HXD/PIN spectra were multiplied by 1.15, according to the Suzaku Data Reduction Guide333http://heasarc.gsfc.nasa.gov/docs/Suzaku/analysis/abc/. The best-fit model (Table 1 and Figure 4) reproduced the spectra well (reduced chi-square of =1.04, d.o.f =890). The derived plasma temperature, kT 14.40.4 keV, is similar to those in earlier observations (Smith et al. 2004, 2012). The EWs of the iron emission lines are also similar to those measured with Chandra (Smith et al. 2004), but a factor of two higher than those in the XMM-Newton observation in 2004 (Lopes de Oliveira et al. 2010).
3.6 Combined Spectral Analysis
The hardness ratios of both the Suzaku 59 keV/1540 keV bands and INTEGRAL 2040 keV/4060 keV bands did not show any significant temporal variations. This suggests that the Suzaku and INTEGRAL time-integrated spectra can be jointly fitted by normalizing them at the overlapping energy band between 2040 keV.
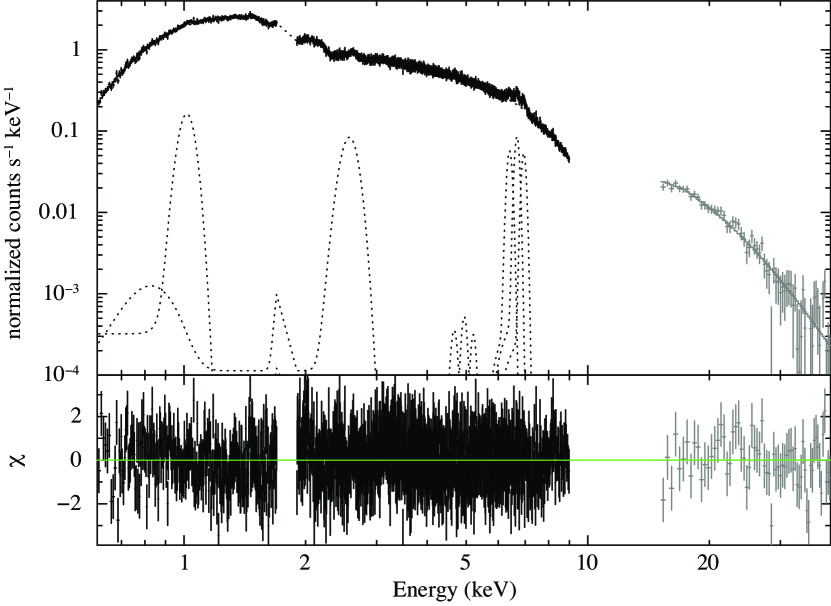
For the combined data set we found that the collisionally ionized plasma emission model, apec in the XSPEC package, along with a single absorption term and a Gaussian line component at keV provided an excellent fit to the full data set as was the case with the Suzaku data only. The inferred plasma temperature was about keV, comparable to what others have found for Cas (e.g. Smith et al. (2004)) and less than that the hot component of HD 110432 of Torrejón et al. (2012). Significantly, the combined fit provides strong evidence that the thermal emission extends up to keV. The inferred luminosity over the keV band is . Surprisingly, the continuum extended smoothly into the higher energy INTEGRAL band without requiring a significant instrumental cross-calibration correction. The reduced chi-square statistic for our best overall fit to that model was 1.28 for 1539 degrees of freedom.
We tried adding a powerlaw component to the model, and found that a similar quality of fit could be obtained. However, that was the case only when the hard powerlaw, index , made negligible contribution to the overall flux (). Formally, and more dramatically than the INTEGRAL only case, an F-test indicated only a probability of that the additional component led to a more accurate representation of the data. Thus, we suggest that a purely thermal plasma emission model is the most realistic representation of the data and the addition of a separate hard component is not justified by our observations.
The best-fit results for our combined model are presented in (Table 2).
4 Discussion and Conclusions
The ultimate question of how one resolves the long standing Cas enigma remains but some new clues about this system are slowly emerging. The broadband X-ray emission from the Be stars Cas can contribute to this endeavor. There is, at this point in time, a fairly broad consensus that the standard Be star X-ray binary model does not provide a plausible description of Cas. This is in part the case given the lack of orbital modulation and episodic variability as well as the discrepant X-ray luminosity compared to quiescent Be X-ray binaries. Most notable from the perspective of this paper is the nature of the high-energy continuum which in Be X-ray binaries generally displays non-thermal emission components. In transients this can be the case over a range of luminosities; for a recent example see Kühnel et al. (2013).
Scenarios involving a white dwarf companion remain possible but have long been considered problematic and no clear X-ray signatures of binarity have been revealed. One difficulty however with the Be-white dwarf binary scenario for these stars is the problem of forming such a system given the estimated mass ranges for Cas of 13-18 M⊙ (Harmanec et al. 2000; Zorec et al. 2005; Gontcharov et al. 2000; Tokovinin 1997). In order for a white dwarf to form in a Be system, it had been long believed white dwarf progenitor must initially be more massive than the Be star progenitor. Evolutionary models by Raguzova (2001) suggest that the maximum initial mass of a white dwarf progenitor in a Be binary system is 10-11 M⊙ although variations of the traditional shared envelope binary evolution scenarios, involving for example non-conservative mass transfer, could plausibly circumvent this. In the context of this constraint Cas would then have needed to be initially 10 M⊙ for a white dwarf companion to have formed, but the accretion of 3 - 8 M⊙ or more from the companion to reach its current mass seems unlikely. A putative third body could also alter this picture, but that scenario is highly speculative and improbable.
From purely an observational perspective, while the INTEGRAL CV sample, e.g. (Landi et al. 2009; Revnivtsev et al. 2008), is characterized by a mean (log) luminosity of which is similar to Cas, the short-timescale variability characteristics are distinct. The INTEGRAL (and Swift) CV sample is dominated by intermediate polars (IPs) characterized by spin and orbital pulsations and aperiodic fluctuations, none of which is evident here. The CVs typically exhibit softer spectra over that band than what we find for Cas, on average , however CV spectra vary significantly in both a phase dependent and an episodic manner.
While an accreting neutron star scenario can be largely ruled out, we point out a curious similarity between of Cas and the -ray binary LS I+61 303, e.g. (Chernyakova, Neronov, & Walter 2006). That system, which consists of a similar B0Ve primary, but has a similar mean 20-60 keV X-ray luminosity (although its 2-10 keV luminosity is nearly an order of magnitude larger). It is believed, in one class of models at least, to consist of a non-accreting companion, a fast-spinning highly magnetized neutron star and the Be primary, thus in essence a pulsar-wind nebula embedded in the Be star wind. This interpretation requires that pulsations be cloaked by the massive star wind. Could the high-energy emission from Cas also be powered by a non-accreting companion? There are however clear observational differences between these systems as well. LSI +61 303 exhibits orbital modulation in X-rays, and is a radio source which is also periodically modulated. Additionally, it is a 100-MeV gamma-ray source (Nolan et al. 2012) as well as a TeV gamma-ray source. Cas on the other hand is apparently radio quiet, it is not seen down to the 2.5 mJy flux limit of the NVSS for example rendering this idea less tenable (although see Drake (1990) who found a sub-5 (250.06 mJy) source coincident with Cas, so variability may be an issue. In any case its putative mean radio luminosity would be times lower than that of LSI +61 303 which is about 10 times more distant and 10 times brighter). To further explore this idea though we searched for 100-MeV gamma-ray emission from Cas, which is not listed as a detection in the Fermi 2FGL source catalog (Nolan et al. 2012), using the archives of the Fermi Gamma-Ray Space Telescope. Our searches, both deep, long baseline integrations and epoch-folding analyses on the known periods revealed non detections. Thus, unless a scheme for hiding radio and gamma-ray emission can be concocted, this idea seems untenable.
A very different concept to explain the X-ray emission is the so called “magnetic star-disk interaction” model which was proposed by e.g. Smith et al. (2004); Robinson et al. (2002); Robinson & Smith (2000); Smith & Robinson (1999); Smith et al. (1998); also see Smith et al. (2012). In this model it is suggested that many characteristics of the X-ray emission of Cas can be explained by the dynamical interactions between putative magnetic fields on the star and its circumstellar disk. This seems to be the favored modeling scenario in the current literature, however there are still some puzzling issues; not the least of which is the origin of the magnetic field.
In this scenario short-timescale X-ray variations, as well as correlated UV and optical activity is associated with matter in the proximity of the star being acted upon by magnetic lines of force. This mechanism involves a cyclical magnetic dynamo driven by a BalbusHawley instability located within the circumstellar disk (Robinson et al. 2002). According to that model, variations in the magnetic field strength emanating from the star lead to Keplerian shear and turbulent motions within the disk through the magnetorotational instability of Balbus & Hawley (1991). That mechanism is expected to operate to some extent whenever a magnetic field is embedded in a Keplerian disk. This could result in a positive feedback in which turbulence amplifies the magnetic field, which, in turn, increases the level of turbulence.
The more slowly rotating circumstellar disk drags the field lines causing them on occasion to get entangled. The resulting stretching and reconnection of the field lines leads to particle acceleration, some of which may be directed towards the Be star surface. These streams of plasma then locally heat the photosphere leading to flaring. The heated matter can then expand to lower density regions and continues to glow as the so called ”basal” emission component, e.g. (Smith et al. 1998).
The model has been applied to the flux variations that were found on several time scales utilizing optical, UV, and X-ray monitoring of Cas as detailed in Smith et al. (2004). It was discovered that there was a cyclical variation in both the UV and X-ray data with a 1.21 day period but that the light curves in the two bands were out of phase (Robinson & Smith 2000; Smith et al. 1998). Rapid X-ray fluctuations on timescales of seconds to minutes, termed “shots” or “bursts”, have also been noted, e.g. Smith et al. (1998); Robinson et al. (2002). The number and amplitude of these shots were found to increase during the UV minimum. More recently a longer timescale was identified. Robinson et al. (2002) found that the optical and X-ray emission from -Cas exhibited cyclical variations superimposed on the 1.21-day stellar rotation period with periods that changed from 55 to 93 days. This has subsequently been revised with improved measurement to 50-91 days by Henry & Smith (2012). In this case the optical and X-ray fluxes showed a strong positive correlation.
It was proposed that the shots were generated in magnetic structures near the stellar surface and that the 1.21 day period is due to rotation of the star (Robinson & Smith 2000; Smith et al. 1998). A possible signature of such models may be magnetically induced flaring, which would likely be pronounced in the hard X-ray band (i.e. above 10 keV). It would seem highly likely that the high-energy emission would be variable over observable timescales in such scenarios. In the sun for example, where we know for certain that magnetic reconnection events occur they are known to cause particle acceleration leading to rapid and energetic flaring. The disruption and reconfiguration of magnetic field structures associated with the model could also provide a natural explanation for a non-thermal high-energy emission component (although it could also underlie the emergent thermal emission through radiative transfer processes), but we fail to convincingly identify such a component.
If magnetic fields emanating from the star, as opposed to from a dynamo within the disk, are involved with the X-ray production the question of how fields are generated in early-type stars is another issue one must ultimately resolve. It has been suggested by some that Be stars could be the end product of a merger event. For example, de Mink, et. al. (2013) suggest that these putative magnetic fields may play a role in the binary evolution or merger events leading to the high rotation rates seen in Be stars. If -Cas had gone through a previous phase involving a relatively recent merger a remnant magnetic field could exist at present. However, the presence of a companion star, orbiting at the aforementioned 203-day period, would then require the merger scenario to have occurred in a triple star system.
There is some observational evidence for large-scale magnetic fields in at least a small fraction of O and B stars. Based on a survey of 550 Galactic O and B stars designed to search for stellar magnetic fields Wade et al. (2013) find that about of their sample objects are detected. However, their survey included 98 classical Be stars, among which they failed to obtain any detections despite a magnetic sensitivity similar to that of their larger sample. Based on the detection rate they measured for the non-Be B-type stars, those authors expected to detect magnetic stars amongst the Be stars. Thus, this seems to be a statistically significant result and it argues against the notion that Be star circumstellar disks are unlikely to be of magnetic origin.
There are some B-stars with spectral types similar to Cas known to possess substantial magnetic fields. The X-ray properties of these were studied in detail by Oskinova et al. (2011) . It was shown that the X-ray properties of these massive B-type magnetic stars are diverse.
An interesting case is an B0.5IV star CMa whose spectral type is the same as Cas. CMa rotates somewhat slower (=2 d,) Hubrig et al. (2011) than Cas. It does not exhibit characteristics of a disk and has an exceptionally strong, 5 kG, magnetic field. The detailed study of X-ray emission from CMa revealed X-ray pulsations coherent with optical pulsations but with a larger amplitude (Oskinova, et al. 2014). However, despite the confirmed presence of strong magnetic field, the X-ray spectrum of CMa is much softer than in Cas. Comparison between those two objects shows that the very special X-ray properties of Cas cannot be explained by only its putative magnetic field. The presence of a disk or a hypothetical close companion is apparently required to explain Cas and its analogs.
The lack of an obvious hard, non-thermal component in our analysis of , which might imply that particle acceleration is occurring within the star-disk system, is consistent with the lack of radio emission. However the star-disk interaction model details remain to be worked out, although for now it seems to be the favored explanation for the long-standing Cas enigma.
To summarize, we have examined more than 8 years of non-uniformly but reasonably well-sampled INTEGRAL observations with fields of view containing Cas. We do not find significant flux variations in INTEGRAL band, either stochastic or periodic. Our frequency searches included some known periods of the system. We also present our analysis of a 52 ksec Suzaku observation. Temporal analysis of those data considered with the INTEGRAL analysis suggest a decreasing variability with energy. Our multi-instrument spectral analysis suggests a spectral energy distribution which is purely thermal in nature over the broad keV band. While this result is generally consistent with the favored magnetic field - circumstellar disk interaction model it potentially imposes new constraints as the magnetic reconnection mechanism that model invokes could quite possibly entail both high-energy flaring and particle acceleration leading to non-thermal emission.
References
- Apparao (2002) Apparao, K. M. V. 2002, A&A, 382, 554
- Balbus & Hawley (1991) Balbus, S. A. & Hawley, J. F. 1991, ApJ, 376, 214
- Bird et al. (2010) Bird, A. J., Bazzano, A., Bassani, L., Capitanio, F., Fiocchi, M., Hill, A. B., Malizia, A., McBride, V. A., Scaringi, S., Sguera, V., Stephen, J. B., Ubertini, P., Dean, A. J., Lebrun, F., Terrier, R., Renaud, M., Mattana, F., Götz, D., Rodriguez, J., Belanger, G., Walter, R. and Winkler, C., 2010, ApJS, 186, 1
- Boldt (1987) Boldt, E. 1987, in IAU Symposium, Vol. 124, Observational Cosmology, ed. A. Hewitt, G. Burbidge, & L. Z. Fang, 611–615
- Chernyakova, Neronov, & Walter (2006) Chernyakova, M., Neronov, A. and Walter, R., MNRAS, 2006, 372, 1585.
- Chevalier & Ilovaisky (1998) Chevalier, C. & Ilovaisky, S. A. 1998, A&A, 330, 201
- de Mink, et. al. (2013) de Mink, S. E., Langer, N., Izzard, R. G., Sana, H. and de Koter, A., ApJ, 2013, 764, 166.
- den Hartog et al. (2006) den Hartog, P. R., Hermsen, W., Kuiper, L., Vink, J., in’t Zand, J. J. M. and Collmar, W., 2006, A&A, 451, 587
- Drake (1990) Drake, S. A., 1990, AJ, 100, 572
- Gontcharov et al. (2000) Gontcharov, G. A., Andronova, A. A., & Titov, O. A. 2000, A&A, 355, 1164
- Harmanec et al. (2000) Harmanec, P., Habuda, P., Štefl, S., Hadrava, P., Korčáková, D., Koubský, P., Krtička, J., Kubát, J., Škoda, P., Šlechta, M. and Wolf, M., 2000, A&A, 364, L85
- Helfand & Moran (2001) Helfand, D. J., & Moran, E. C. 2001, ApJ, 554, 27
- Henry & Smith (2012) Henry, G. W., & Smith, M. A. 2012, ApJ, 760, 10
- Horaguchi et al. (1994) Horaguchi, T., Kogure, T., Hirata, R., Kawai, N., Matsuoka, M., Murakami, T., Doazan, V., Slettebak, A., Huang, C. C., Cao, H., Guo, Z., Huang, L., Tsujita, J., Ohshima, O. and Ito, Y., 1994, PASJ, 46, 9
- Hubrig et al. (2011) Hubrig, S., Ilyin, I., Schöller, M., Briquet, M., Morel, T., & De Cat, P., ApJ, 726, 5
- Kokubun et al. (2007) Kokubun, M., Makishima, K., Takahashi, T., Murakami, T., Tashiro, M., Fukazawa, Y., Kamae, T., Madejski, G. M., Nakazawa, K., Yamaoka, K., Terada, Y., Yonetoku, D., Watanabe, S., Tamagawa, T., Mizuno, T., Kubota, A., Isobe, N., Takahashi, I., Sato, G., Takahashi, H., Hong, S., Kawaharada, M., Kawano, N., Mitani, T., Murashima, M., Suzuki, M., Abe, K., Miyawaki, R., Ohno, M., Tanaka, T., Yanagida, T., Itoh, T., Ohnuki, K., Tamura, K.-I., Endo, Y., Hirakuri, S., Hiruta, T., Kitaguchi, T., Kishishita, T., Sugita, S., Takahashi, T., Takeda, S., Enoto, T., Hirasawa, A., Katsuta, J., Matsumura, S., Onda, K., Sato, M., Ushio, M., Ishikawa, S.-N., Murase, K., Odaka, H., Suzuki, M., Yaji, Y., Yamada, S., Yamasaki, T., Yuasa, T., & The Hxd Team. 2007, PASJ, 59, 53
- Koyama et al. (2007) Koyama, K., Tsunemi, H., Dotani, T., Bautz, M. W., Hayashida, K., Tsuru, T. G., Matsumoto, H., Ogawara, Y., Ricker, G. R., Doty, J., Kissel, S. E., Foster, R., Nakajima, H., Yamaguchi, H., Mori, H., Sakano, M., Hamaguchi, K., Nishiuchi, M., Miyata, E., Torii, K., Namiki, M., Katsuda, S., Matsuura, D., Miyauchi, T., Anabuki, N., Tawa, N., Ozaki, M., Murakami, H., Maeda, Y., Ichikawa, Y., Prigozhin, G. Y., Boughan, E. A., Lamarr, B., Miller, E. D., Burke, B. E., Gregory, J. A., Pillsbury, A., Bamba, A., Hiraga, J. S., Senda, A., Katayama, H., Kitamoto, S., Tsujimoto, M., Kohmura, T., Tsuboi, Y. and Awaki, H., 2007, PASJ, 59, 23
- Kubo et al. (1998) Kubo, S., Murakami, T., Ishida, M. and Corbet, R. H. D., PASJ, 50, 417
- Kühnel et al. (2013) Kühnel, M., Müller, S., Kreykenbohm, I., Fürst, F., Pottschmidt, K., Rothschild, R. E., Caballero, I., Grinberg, V., Schönherr, G., Shrader, C., Klochkov, D., Staubert, R., Ferrigno, C., Torrejón, J.-M., Martínez-Núñez, S. & Wilms, J., 2013, A&A, 555, 95
- Landi et al. (2009) Landi, R., Bassani, L., Dean, A. J., Bird, A. J., Fiocchi, M., Bazzano, A., Nousek, J. A. and Osborne, J. P., 2009, MNRAS, 392, 630
- Lopes de Oliveira et. al. (2006) Lopes de Oliveira, R., Motch, C., Haberl, F., Negueruela, I. & Janot-Pacheco, E., A&A, 2006, 454, 265
- Lopes de Oliveira et al. (2007) Lopes de Oliveira, R., Motch, C., Smith, M. A., Negueruela, I., & Torrejón, J. M. 2007, A&A, 474, 983
- Lopes de Oliveira et al. (2010) Lopes de Oliveira, R., Smith, M. A., & Motch, C. 2010, A&A, 512, A22
- Marco et. al. (2007) Marco, A., Negueruela, I. and Motch, C., 2007, Astronomical Society of the Pacific Conference Series, Volume 361, 388
- Miyaji et al. (1998) Miyaji, T., Ishisaki, Y., Ogasaka, Y., Ueda, Y., Freyberg, M. J., Hasinger, G., & Tanaka, Y. 1998, A&A, 334, L13
- Mitsuda et al. (2007) Mitsuda, K., & et al. 2007, PASJ, 59, 1
- Motch (2009) Motch, C., Lopes de Oliveira, R., Negueruela, I., Haberl, F. & Janot-Pacheco, E., 2007, 361, 117, Ed. Okazaki, A. T., Owocki, S. P., & Stefl, S.
- Murakami et al. (1986) Murakami, T., Koyama, K., Inoue, H., & Agrawal, P. C. 1986, ApJ, 310, L31
- Nazé (2009) Nazé, Y., A&A, 2009, 506, 1055
- Nebot, et. al. (2013) Nebot Gómez-Morán, A., Motch, C., Barcons, X., Carrera, F. J., Ceballos, M. T., Cropper, M., Grosso, N., Guillout, P., Hérent, O., Mateos, S., Michel, L., Osborne, J. P., Pakull, M., Pineau, F.-X., Pye, J. P., Roberts, T. P., Rosen, S. R., Schwope, A. D., Watson, M. G. and Webb, N., 2013, A&A, 553, A12.
- Negueruela (1998) Negueruela, I. 1998, A&A, 338, 505
- Nemravová et al. (2012) Nemravová, J., Harmanec, P., Koubský, P., et al. 2012, A&A, 537, A59
- Nolan et al. (2012) Nolan, P. L., Abdo, A. A., Ackermann, M., et al. 2012, ApJS, 199, 31
- Oskinova (2005) Oskinova, L. M., 2005, MNRAS, 361, 679
- Oskinova et al. (2011) Oskinova L.M.,Todt, H., Ignace, R., Brown, J.C., , Cassinelli, J.P., & Hamann, W.-R., 2011, MNRAS, 416, 1456
- Oskinova, et al. (2014) Oskinova, L. M., Nazé, Y., Todt, H., Huenemoerder, D. P., Ignace, R., Hubrig, S., & Hamann, W.-R., Nature Communications, 5, 4024
- Owens et al. (1999) Owens, A., Oosterbroek, T., Parmar, A. N., et al. 1999, A&A, 348, 170
- Pallavicini et al. (1981) Pallavicini, Golub, Rosner, Vaiana, Ayres, T., & Linsky, J., 1981, ApJ, 248, 279
- Parmar et al. (1993) Parmar, A. N., Israel, G. L., Stella, L., & White, N. E. 1993, A&A, 275, 227
- Przybilla et. al. (2008) Przybilla, N., Nieva, M.-F. and Butler, K., ApJ, 2008,688, L103
- Raguzova (2001) Raguzova, N. V. 2001, A&A, 367, 848
- Rauw (2013) Rauw, G., Nazé, Y., Spano, M., Morel, T. and ud-Doula, A., 2013, A&A, 555, L9
- Rivinius, Carciofi, & Martayan (2013) Rivinius, T., Carciofi, A. C. and Martayan, C., 2013, A&A Rev., 21, 69.
- Revnivtsev et al. (2008) Revnivtsev, M., Sazonov, S., Krivonos, R., Ritter, H., & Sunyaev, R. 2008, A&A, 489, 1121
- Robinson & Smith (2000) Robinson, R. D., & Smith, M. A. 2000, ApJ, 540, 474
- Robinson et al. (2002) Robinson, R. D., Smith, M. A., & Henry, G. W. 2002, ApJ, 575, 435
- Safi-Harb et. al. (2007) Safi-Harb, S., Ribó, M., Butt, Y., Matheson, H., Negueruela, I., Lu, F., Jia, S., & Chen, Y., ApJ, 2007, 659, 407
- Scaringi et. al. (2010) Scaringi, S. and Bird, A. J. and Norton, A. J. and Knigge, C. and Hill, A. B. and Clark, D. J. and Dean, A. J. and McBride, V. A. and Barlow, E. J. and Bassani, L. and Bazzano, A. and Fiocchi, M. and Landi, R., MNRAS, 2010, 401
- Secchi (1867) Secchi, A. 1867, Astronomische Nachrichten, 68, 63
- Serlemitsos et al. (2007) Serlemitsos, P. J., Soong, Y., Chan, K.-W., Okajima, T., Lehan, J. P., Maeda, Y., Itoh, K., & Mori, H. 2007, PASJ, 59,9
- Smith et al. (2004) Smith, M. A., Cohen, D. H., Gu, M. F., et al. 2004, ApJ, 600, 972
- Smith & Robinson (1999) Smith, M. A. & Robinson, R. D. 1999, ApJ, 517, 866
- Smith et al. (1998) Smith, M. A., Robinson, R. D., & Corbet, R. H. D. 1998a, ApJ, 503, 877
- Smith et al. (1998) Smith, M. A., Robinson, R. D., & Hatzes, A. P. 1998b, ApJ, 507, 945
- Smith et al. (2006) Smith, M. A., Henry, G. W., & Vishniac, E. 2006, ApJ, 647, 1375
- Smith et al. (2012) Smith, M. A., Lopes de Oliveira, R., & Motch, C. 2012a, ApJ, 755, 64
- Smith et al. (2012) Smith, M. A., Lopes de Oliveira, R., Motch, C., Henry, G. W., Richardson, N. D., Bjorkman, K. S., Stee, P., Mourard, D., Monnier, J. D., Che, X., Bücke, R., Pollmann, E., Gies, D. R., Schaefer, G. H., ten Brummelaar, T., McAlister, H. A., Turner, N. H., Sturmann, J., Sturmann, L. and Ridgway, S. T., 2012, A&A, 540, A53
- Takahashiet al. (2007) Takahashi, T., Abe, K., Endo, M., Endo, Y., Ezoe, Y., Fukazawa, Y., Hamaya, M., Hirakuri, S., Hong, S., Horii, M., Inoue, H., Isobe, N., Itoh, T., Iyomoto, N., Kamae, T., Kasama, D., Kataoka, J., Kato, H., Kawaharada, M., Kawano, N., Kawashima, K., Kawasoe, S., Kishishita, T., Kitaguchi, T., Kobayashi, Y., Kokubun, M., Kotoku, J., Kouda, M., Kubota, A., Kuroda, Y., Madejski, G., Makishima, K., Masukawa, K., Matsumoto, Y., Mitani, T., Miyawaki, R., Mizuno, T., Mori, K., Mori, M., Murashima, M., Murakami, T., Nakazawa, K., Niko, H., Nomachi, M., Okada, Y., Ohno, M., Oonuki, K., Ota, N., Ozawa, H., Sato, G., Shinoda, S., Sugiho, M., Suzuki, M., Taguchi, K., Takahashi, H., Takahashi, I., Takeda, S., Tamura, K.-I., Tamura, T., Tanaka, T., Tanihata, C., Tashiro, M., Terada, Y., Tominaga, S., Uchiyama, Y., Watanabe, S., Yamaoka, K., Yanagida, T. and Yonetoku, D., 2007, PASJ, 59, 35
- Tokovinin (1997) Tokovinin, A. A. 1997, A&AS, 124, 75
- Torrejón & Orr (2001) Torrejón, J. M., & Orr, A. 2001, A&A, 377, 148
- Torrejón et al. (2012) Torrejón, J. M., Schulz, N. S., & Nowak, M. A., 2012, ApJ, 750, 75
- Ubertini et al. (2003) Ubertini, Lebrun, Di Cocco, Bazzano, Bird, Broenstad, Goldwurm, La Rosa, Labanti, Laurent, Mirabel, Quadrini, Ramsey, Reglero, Sabau, Sacco, Staubert, Vigroux, Weisskopf, & Zdziarski, 2003, A&A, 411, L131
- Wade et al. (2013) Wade, G. A., Grunhut, J., Alecian, E., Neiner, Auriere, Bohlender, David-Uraz, Folsom, Henrichs, Kochukhov, Mathis, Owocki, & Petit, 2013, arXiv:1310.3965
- Winkler et al. (2003) Winkler, Courvoisier, Di Cocco, Winkler, C., Courvoisier, T. J.-L., Di Cocco, G., Gehrels, Giménez, Grebenev, Hermsen, Mas-Hesse, Lebrun, Lund, Palumbo, Paul, Roques, Schnopper, Schönfelder, Sunyaev, Teegarden, Ubertini, Vedrenne, & Dean, 2003, A&A, 411, L1
- Yamadaet. al. (2012) Yamada, S., Uchiyama, H., Dotani, T., Tsujimoto, M., Katsuda, S., Makishima, K., Takahashi, H., Noda, H., Torii, S., Sakurai, S., Enoto, T., Yuasa, T., Koyama, S. and Bamba, A., 2012, PASJ, 64, 53
- Zorec et al. (2005) Zorec, J., Frémat, Y., & Cidale, L. 2005, A&A, 441, 235
| Parameters | unit | Value |
|---|---|---|
| Bremsstrahlung | ||
| kT | (keV) | 14.06 (13.81,14.30) |
| E.M. | (1055 cm-3) | 3.856 (3.841,3.869) |
| Fluorescence iron line | ||
| Line Center | (keV) | 6.405 (6.390,6.423) |
| (eV) | 33 (74) | |
| Flux | (10-5 ph cm-2 s-1) | 5.8 (4.8,6.9) |
| EW | (eV) | 52 |
| Helium-like iron line | ||
| Line Center | (keV) | 6.680 (6.669,6.692) |
| (eV) | 0 (40) | |
| Flux | (10-5 ph cm-2 s-1) | 8.7 (7.8,9.4) |
| EW | (eV) | 84 |
| Hydrogen-like iron line | ||
| Line Center | (keV) | 6.944 (6.930,6.959) |
| (eV) | 0 (38) | |
| Flux | (10-5 ph cm-2 s-1) | 5.9 (5.2,6.7) |
| EW | (eV) | 62 |
| Helium-like iron line | ||
| Line Center | (keV) | 2.564 (2.542,2.586) |
| (eV) | 100 (78,122) | |
| Flux | (10-4 ph cm-2 s-1) | 1.4 (1.1,1.7) |
| EW | (eV) | 28.7 |
| Hydrogen-like iron line | ||
| Line Center | (keV) | 1.013 (0.998,1.025) |
| (eV) | 25 (48) | |
| Flux | (10-4 ph cm-2 s-1) | 1.5 (1.0,2.1) |
| EW | (eV) | 8.6 |
| NH | ||
| NH | (1020 cm-2) | 5.1 (4.7,5.4) |
Note. —
| Parameters | unit | Value |
|---|---|---|
| Collisionally ionized thermal plasma (apec) | ||
| kT | (keV) | 15.370.18 |
| Abundance | solar | 0.260.18 |
| Normalization | 7.76e-23.11e-4 | |
| Gaussian | ||
| Line Center | (keV) | 6.40 |
| (keV) | 7.49e-22.72e-2 | |
| Normalization | 5.16e-57.99e-6 | |
| Absorption (TBabs) | ||
| NH | 1022cm | 2.56e-23.82e-3 |
| ChiSquare per DoF | ||
| 1709.14 / 1427 | ||
Note. — Example of a thermal plasma emission model fitted to the broad-band multi-instrument data set. The continuum appears to be well represented by a purely thermal from below a keV up to nearly 100 keV. An empirically determined instrumental cross calibration correction term was included in the model fit.