copyrightbox
Spotting Suspicious Link Behavior with fBox: An Adversarial Perspective
Abstract
How can we detect suspicious users in large online networks? Online popularity of a user or product (via follows, page-likes, etc.) can be monetized on the premise of higher ad click-through rates or increased sales. Web services and social networks which incentivize popularity thus suffer from a major problem of fake connections from link fraudsters looking to make a quick buck. Typical methods of catching this suspicious behavior use spectral techniques to spot large groups of often blatantly fraudulent (but sometimes honest) users. However, small-scale, stealthy attacks may go unnoticed due to the nature of low-rank eigenanalysis used in practice.
In this work, we take an adversarial approach to find and prove claims about the weaknesses of modern, state-of-the-art spectral methods and propose fBox, an algorithm designed to catch small-scale, stealth attacks that slip below the radar. Our algorithm has the following desirable properties: (a) it has theoretical underpinnings, (b) it is shown to be highly effective on real data and (c) it is scalable (linear on the input size). We evaluate fBox on a large, public 41.7 million node, 1.5 billion edge who-follows-whom social graph from Twitter in 2010 and with high precision identify many suspicious accounts which have persisted without suspension even to this day.
I Introduction
In an online network, how can we distinguish honest users from deceptive ones? Since many online services rely on machine learning algorithms to recommend relevant content to their users, it is crucial to their performance that user feedback be legitimate and indicative of true interests. “Fake” links via the use of sockpuppet/bot accounts can enable arbitrary (frequently spammy or malicious) users and products of varying nature seem credible and popular, thus degrading the online experience of users. Unsurprisingly, numerous sites such as buy1000followers.co, boostlikes.com and buyamazonreviews.com exist to provide services such as fake Twitter followers, Facebook page-likes and Amazon product reviews for typically just a few dollars per one-thousand fake links.
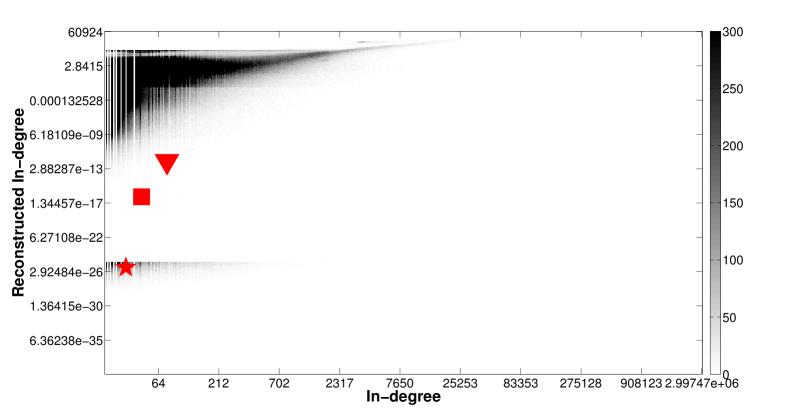
Here we focus exactly on the link-fraud problem. We take an adversarial approach to illustrate when and how current methods fail to detect fraudsters and design a new complementary algorithm, fBox, to spot attackers who evade these state-of-the-art techniques. Figure 1 showcases several suspicious accounts spotted by fBox– we elaborate on three of them, marked using the triangle, square and star glyphs. All three are identified as outliers in the fBox Spectral Reconstruction Map (SRM) shown in Figure 1b. The corresponding Twitter profiles are shown in Figure 1c, and further manual inspection shows that all three accounts exhibit suspicious behavior:
-
•
triangle: it has only 2 tweets but over 1000 followers
-
•
square: it is part of a 50-clique with suspicious names
-
•
star: it posts tweets advertising a link fraud service
Our main contributions are the following:
-
1.
Theoretical analysis: We prove limitations of the detection range of spectral-based methods.
-
2.
fBox algorithm: We introduce fBox, a scalable method that boxes-in attackers, since it spots small-scale, stealth attacks which evade spectral methods.
-
3.
Effectiveness on real data: We apply fBox to a real, 41.7 million node, 1.5 billion edge Twitter who-follows-whom social graph from 2010 and identify many still-active accounts with suspicious follower/followee links, spammy Tweets and otherwise strange behavior.
Reproducibility: Our code is available at http://www.cs.cmu.edu/~neilshah/code/. The Twitter dataset is also publicly available as cited in [11].

II Background and Related Work
We begin by reviewing in detail several of the current state-of-the-art methods in web fraud and spam detection. Table I shows a qualitative comparison between various link fraud detection methods.
II-A Spectral methods
| P r o p e r t i e s | M e t h o d s | ||||
|---|---|---|---|---|---|
| SpokEn | Spectral Subspace Plotting | CopyCatch | OddBall | fBox | |
| Detects stealth attacks | ✘ | ✘ | ✘ | ✘ | ✔ |
| Camouflage resistant | ✘ | ✔ | ✔ | ✘ | ✔ |
| Offers visualization | ✔ | ✔ | ✘ | ✘ | ✔ |
We classify techniques that analyze the latent factors produced in graph-based eigenanalysis or matrix/tensor decomposition as spectral methods. These algorithms seek to find patterns in the graph decompositions to extract coherent groups of users or objects. Prakash et al’s work on the EigenSpokes pattern [19] and Jiang et al’s work on spectral subspaces of social networks [9] are two such approaches that we will primarily focus on and which have been employed on real datasets to detect suspicious link behavior. [21] uses a similar analysis of spectral patterns, but focuses on random link attacks (RLAs), which have different properties than link fraud and therefore produce different patterns.
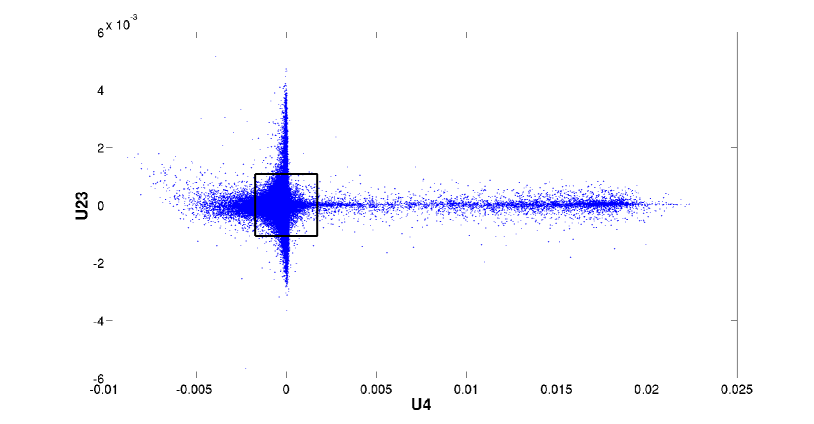
These works utilize the Singular Value Decomposition (SVD) of the input graph’s adjacency matrix in order to group similar users and objects based on their projections. Recall that the SVD of a matrix A is defined as , where U and V are and matrices respectively containing the left and right singular vectors, and is a diagonal matrix containing the singular values of A. Both papers note the presence of unusual patterns (axis-aligned spokes, tilting rays, pearl-like clusters, etc.) when plotting the singular vectors and for some , where is the SVD decomposition rank, indicative of suspicious lockstep behavior between similar users. The authors use these patterns to chip out communities of similar users from input graphs.
Beyond directly searching for suspicious behavior, spectral methods have been used for a variety of applications. [14] builds off the above work to use tensor decomposition for network intrusion detection. [2] proposes a robust collaborative filtering model that clusters latent parameters to limit the impact of fraudulent ratings from potential adversaries. [17] and [8] propose using eigenvectors of graph decompositions for graph partitioning and community detection.
Although spectral methods have shown promise in finding large communities and blatantly suspicious behavior in online networks, they are universally vulnerable given knowledge of the decomposition rank used in a given implementation. All techniques operating on large graphs use such a parameter in practical implementations given that matrix decompositions are very computationally expensive [10]. Previous spectral methods have generally chosen small values of for purposes of computability. As we will show in Section III, knowledge of or the associated singular value threshold (inferrable from sample datasets online) enables an intelligent adversary to engineer attacks to fall below the detection threshold.
II-B Graph-traversal based methods
A wide variety of algorithms have been proposed to directly traverse the graph to find or stop suspicious behavior. [20] offers a random walk algorithm for detecting RLAs. [6] proposes a PageRank-like approach for penalizing promiscuous users on Twitter, but is unfortunately only shown to be effective in detecting already caught spammers rather than detecting new ones. [18] uses belief propagation to find near-bipartite cores of attackers on eBay.
However, most similar in application is Beutel et al’s CopyCatch algorithm to find suspicious lockstep behavior in Facebook Page Likes [3]. CopyCatch is a clustering method that seeks to find densely connected groups in noisy data through restricted graph traversal, motivated with the intuition of fraud taking the form of naïvely created bipartite cores in the input graph. The algorithm uses local search in the graph to find dense temporally-coherent near-bipartite cores (TNBCs) given attack size, time window and link density parameters.
Clustering methods like CopyCatch are able to avoid detection problems caused by camouflage (connections created by attackers to legitimate pages or people for the purposes of appearing like honest users) given that they ignore such links if the attacker is party to any TNBC. However, identifying the appropriate “minimal attack” parameters is nontrivial. Non-conservative parameter estimates will result in many uncaught attackers whereas excessively conservative estimates will result in numerous false positives. From an adversarial point-of-view, we argue that the cost of incurring false positives and troubling honest users is likely not worth the added benefit of catching an increased number of attackers after some point. Therefore, an alternative approach to catch stealth attacks falling below chosen thresholds is necessary.
II-C Feature-based methods
Spam and fraud detection has classically been framed as a feature-based classification problem, e.g. based on the words in spam email or URLs in tweets. However, [7] focuses on malicious Tweets and finds that blacklisting approaches are too slow to stem the spread of Twitter spam. OddBall [1] proposes features based on egonets to find anomalous users on weighted graphs. [4] and [13] take a game theoretic approach to learning simple classifiers over generic features to detect spam. While related in the adversarial perspective, these approaches focus on general feature-based classification as used for spam email, rather than graph analysis as is needed for link fraud detection.
III An Adversarial Analysis - Our Perspective
In this section, we examine the exploitability of state-of-the-art methods from an adversarial point-of-view and present lemmas and theorems detailing the limitations of these methods. Particularly, we demonstrate through theoretical analysis that existing methods are highly vulnerable to evasion by intelligent attackers. Table II contains a comprehensive list of symbols and corresponding definitions used in our paper.

| Symbol | Definition |
|---|---|
| and | Number of user and object nodes described by the input graph |
| and | Sets of indexed rows and columns corresponding to user and object nodes in the input graph |
| A | input graph adjacency matrix where if a link exists between user node and object node |
| and | Number of attacker and customer nodes described by the attack graph |
| Number of fraudulent actions each customer node has paid commission for in the attack graph | |
| and | Sets of indexed rows and columns corresponding to attacker nodes and customer nodes in the attack graph |
| S | attack graph adjacency matrix where if a link exists between attacker node and customer node |
| Decomposition rank parameter used by spectral methods | |
| and | th largest eigenvalue and singular value of a given matrix (largest values for ) |
| , and | Bipartite core size and edge probability parameters used by clustering methods |
Given knowledge of the detection threshold used by a certain service, how can an attacker engineer smart attacks on that service to avoid detection by fraud detection methods?
Formally, we pose the following adversarial problem:
Problem 1
Given an input graph adjacency matrix A, with rows and columns corresponding to users and objects, engineer a stealth attack which falls just below the minimum sized attack detectable by modern state-of-the-art fraud detection methods.
As previously described, most detection methods focus on finding fairly blatant bipartite cores or cliques in the input graph. Therefore, if an adversary knows the minimum size attack that detection methods will catch, he can carefully engineer attacks to fall just below that threshold. For clustering approaches like CopyCatch, this threshold is clearly set based on input parameters, and the attacker can simply use fewer accounts than specifiedto avoid detection.
However, for spectral methods like SpokEn, the possible attack size for an adversary is unclear. We argue that from an adversarial perspective, these spectral methods have a detection threshold based on the input graph’s singular values. For a rank SVD used in these methods, this threshold is governed by the th largest singular value, . In practice, an adversary could estimate from the results of various experimental attacks conducted at distinct scales, or by conducting analysis on publicly available social network data. Once an adversary has such an estimate, we show that it is easy to conduct attacks on the graph adjacency matrix A that will necessarily lie below this threshold and avoid detection.
To analyze what type of attacks can evade detection by spectral methods, let us consider that there are customers who have each commissioned an attacker with nodes in his botnet for fraudulent actions (page likes, followers, etc.), where . This type of attack can be considered as an injected submatrix S of size , where rows correspond to attacker nodes (controlled by a single fraudulent operator) in the set of users () and the columns represent customers in the set of objects (). In this formulation, the desired in-degree of all nodes in S is .
As described earlier, an attack will only be detected by a spectral algorithm if it appears in the top singular values/vectors. Therefore, our goal as an adversary becomes to understand the spectral properties of our attacks and ensure that they do not project in the rank decomposition. We can consider the spectral properties of S in isolation from the rest of the graph, as it is well known that the spectrum of a disconnected graph is the union of the spectra of its connected components. From this, we deduce that it is sufficient to consider only the representation of S and ignore the remainder of A when trying to minimize the leading singular value that the attack contributes to the singular spectrum of A. Therefore, an attack S with leading singular value will go undetected by spectral methods if , where is the th largest singular value computed for the adjacency matrix A.
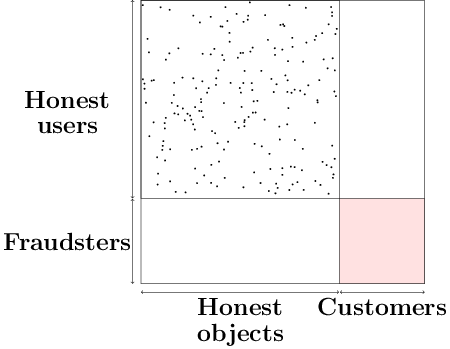
Having reduced the problem of adversarial injection to distributing some amount of fraudulent activity over the matrix S, we next consider several distinct patterns of attack which characterize types of fraudulent behavior discovered in the analysis of prior work. Specifically, we explore three fraud distribution techniques: naïve, staircase and random graph injections. Figure 2 gives a pictorial representation of each of these types of attacks. We evaluate the suitability of each attack for an adversary on the basis of the leading singular value that the pattern generates.
III-A Naïve Injection
This is the most notable attack pattern considered in prior work. The naïve injection distributes the total fraudulent actions into an submatrix of S. Thus, only of the attacker nodes perform any fraudulent actions, and all fraudulent actions are distributed between these nodes. In graph terms, this is equivalent to introducing a complete bipartite core. Such an attack corresponds to attackers naïvely linking the same set of nodes to each of the customers, producing a full block in A. Figure 2(a) shows a visual representation of such an attack.
Lemma 1
The leading singular value of an bipartite core injection is .
Proof:
Since S is a full block, where for all , , must be an matrix where for all . By the Perron-Frobenius Theorem for non-negative matrices, the leading eigenvalue of is bounded by
Given that the row sums are equal to , for . Since the singular values of S are equal to the square roots of the eigenvalues of by definition, it follows naturally that the leading singular value is for S. ∎
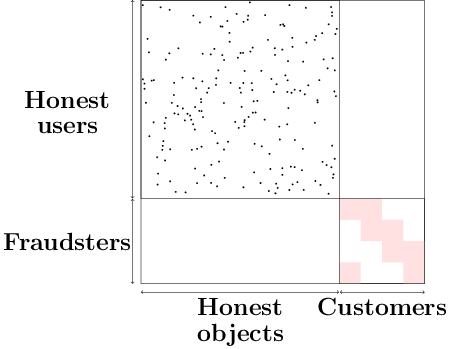
III-B Staircase Injection
The staircase injection (discovered in [9]) evenly distributes fraudulent actions over attacker nodes. However, unlike in the naïve method, where each node that performs any fraudulent actions does so for each of the customers, the staircase method forces different subsets of nodes to associate with different subsets of customers. This distribution results in the S matrix looking like a staircase of links. Figure 2(b) shows a visual representation of such an attack.
We restrict our analysis here to staircase injections in which all users have equal out degrees and equal in degrees , though need not equal . When out degrees and in degrees are not equal, users and objects do not have uniform connectivity properties which complicates calculations. In particular, we assume that the periodicity of the staircase pattern, given by is such that to ensure this criteria. However, for large values of , given LLN.
Theorem 1
The leading singular value of an staircase injection is .
Proof:
The staircase injection is equivalent to a random graph-injection of with edge probability . The reduction is omitted due to space constraints. Such a random graph injection has leading singular value (proof given in Section III-C). ∎
III-C Random Graph Injection
The random graph injection bears close resemblance to the near-bipartite core with density attack noted in [3]. The random graph injection distributes fraudulent actions over the attacker nodes approximately evenly. Figure 2(c) shows a visual representation of such an attack. This approach assigns each node a fixed probability of performing a fraudulent operation associated with one of the customers. Given LLN, the average number of fraudulent operations per customer will be close to the expected value of , and as a result the total number of fraudulent actions will be close to . The random graph injection is similar to the Erdös-Rényi model defined by [5], except we consider a directed graph scenario with possible edges. However, as Erdös and Rényi studied the asymptotic behavior of random graphs, their results are applicable here as well.
Theorem 2
The leading singular value of an directed random bipartite graph is .
Proof:
Given that probability of an edge between an attacker node and a customer is , it is apparent that
since the value of each cell in the matrix will be a result of the inner product of the corresponding row and column vectors of length with probability of a nonzero entry at any . Since each row in has entries,
By the Perron-Frobenius theorem for non-negative matrices, the leading eigenvalue of will be bounded by
Given that the row sums are all approximately equal to (exactly equal to if edges in S are perfectly uniformly distributed), the leading eigenvalue is for . Since the singular values of S are equal to the square roots of the eigenvalues of , it follows naturally that the leading singular value is for S. ∎
Note that the staircase injection discussed earlier in this section is exactly the case of edges in S being perfectly uniformly distributed. For this reason, the leading eigenvalue of , where S is an staircase injection is , and thus the leading singular value is for S.
III-D Implications and Empirical Analysis
Thus far, we have discussed three different types of potential attack patterns for a fixed number of fradulent actions and theoretically derived expressions concerning the leading singular value that they contribute to the singular spectrum of A. Two of the attack patterns, the staircase and random graph injections, produce leading singular values of exactly and approximately respectively. Conversely, naïve injection results in a leading singular value of . Given these results, it is apparent that naïve injection is the least suitable for an adversarial use, since it will necessarily produce a larger singular value than the other two methods given that . This result is intuitive: the leading eigenvalue of a matrix is a measure of effective connectivity, and packing fraudulent actions into a full block matrix results in higher connectivity than spreading the actions out over a large, sparse matrix. Our results beget two important conclusions:
-
1.
Fraud detection tools must consider modes of attack other than naïve injection — more intelligent and less detectable means of attack exist and are being used.
-
2.
Given knowledge of the effective singular value threshold used by spectral detection methods, or , , parameter choice for clustering based methods, attackers can easily engineer attacks of scale up to just below the threshold without consequence.
| Graph | Nodes | Edges |
|---|---|---|
| Twitter [11] | 41.7 million | 1.5 billion |
| Amazon [15] | 6m users & 2m products | 29 million |
| Netflix [16] | 480k users & 17k videos | 99 million |
| Epinions [12] | 131,828 | 841,372 |
| Slashdot [12] | 82,144 | 549,202 |
| Wikipedia [12] | 8274 | 114,040 |
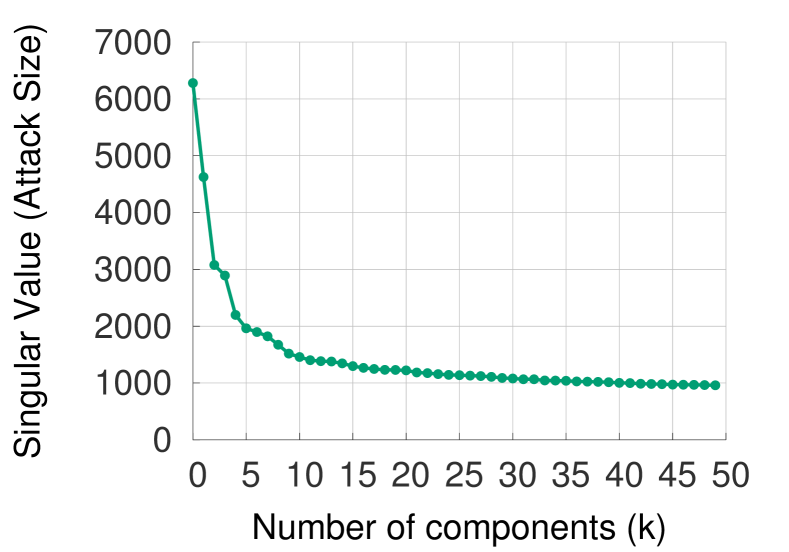
To demonstrate that this leaves a significant opening for attackers, we analyze the distribution of singular values for a variety of real world graphs and show just how easy it is to construct attacks which slip below the radar. In particular, we compute the SVD for six different real world graphs: Twitter’s who-follows-whom social graph, Amazon’s bipartite graph of user reviews for products, Netflix’s graph of user reviews for movies, Epinions’s network of who-trusts-whom, Slashdot’s friends/foe social graph, and Wikipedia’s bipartite graph of votes for administrators. For each graph, we turn it into a binary bipartite graph and compute the SVD for a fixed rank. The properties of the datasets can be seen in Table III and the results can be seen in Figure 3.
In Figure 3(a) we observe the top singular values for the Twitter graph. We see that the largest singular value is over 6000, but as increases the singular values begin to settle around 1000, with . Lemma 1 implies that an attacker controlling 960 accounts could use them to follow 960 other accounts and avoid projecting onto any of the top 50 singular vectors. Note that Lemma 1 also implies that an attacker could add 92 thousand followers to 10 lucky accounts and also go undetected. These are very large numbers of followers that could significantly shift the perception of popularity or legitimacy of accounts. Common spectral approaches would fail to detect such attacks.
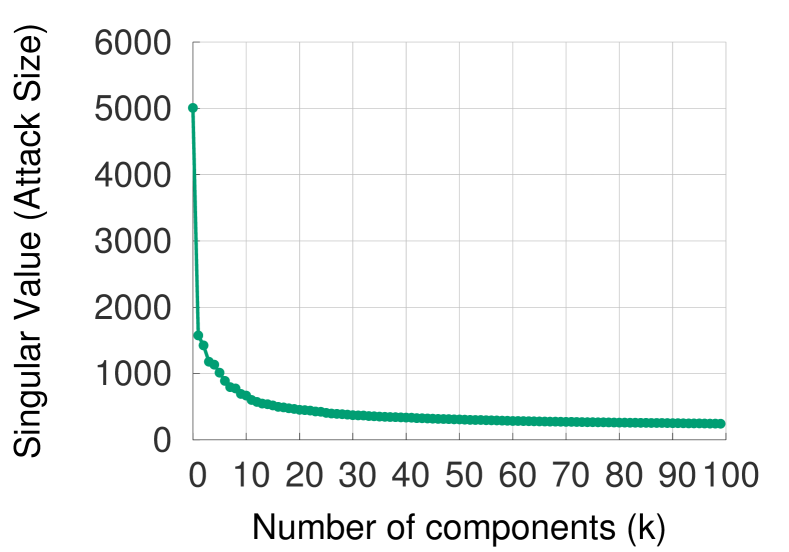
A similar analysis can be made for the other graphs. Figure 3(b) shows that in the Amazon review graph. Therefore, attackers could add 140 reviews for 140 products without projecting onto the top 50 singular vectors. Considering the average product has 12.5 reviews and a product in the percentile has 187 reviews, 140 reviews is sufficiently large to sway perception of a product on Amazon.
As seen in Figure 3(c), we find that and for the Netflix ratings graph. Therefore, attackers could naïvely add an injection of 240 ratings to 240 videos from 240 accounts and avoid detection in the top 100 singular vectors.
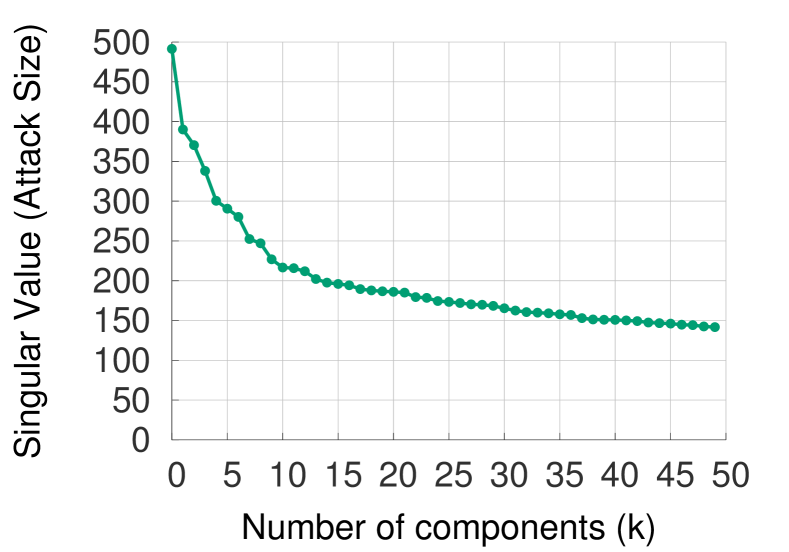
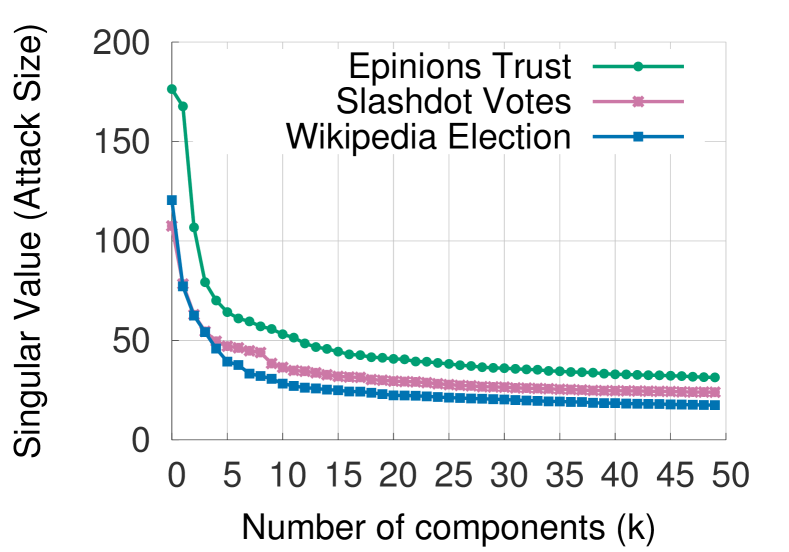
For the Epinions network, we see in Figure 3(d) that . Although this value is much smaller than that for other graphs, the Epinions network is small and sparse, with the average user having an in-degree of 6.4. Based on this singular value, an attacker adding 30 edges (statements of trust or distrust) to 30 users would significantly influence the external view of those users.
In Slashdot’s friend vs. foe graph, , as seen in Figure 3(d). This means that attackers could add 23 ratings for 23 users while avoiding spectral detection. Considering that the average in-degree for accounts in this network is 6.7, adding 23 edges would significantly impact the perception of a user.
Lastly, we examine the graph of 2794 administrative elections on Wikipedia. As shown in Figure 3(d), . This implies that 17 users could for 17 elections all vote together and avoid detection. In fact, 31% of elections were settled by 17 votes or less. An attacker could also modify the shape of the attack such that 5 users would each receive 57 votes, enough to win 72%. Given an attack of this scale, a small group of accounts could cooperate to unfairly rig election outcomes.
From these examples across a variety of networks, we see that using spectral approaches for catching fraud leaves a wide opening for attackers to manipulate online graphs.
IV Proposed Framework for Fraud Behaviors
As demonstrated in Section III, current detection methods are effective in catching blatant attacks, but drop in efficacy as the attack size decreases. Though the scale of attacks detected is defined differently for various datasets given distinct decomposition rank , such a detectability cross-over point necessarily exists given the well-defined nature of the singular value produced by common types of attacks. In this section, we give a broader overview of possible attack modes and the capabilities of current methods in dealing with them. Table IV illustrates how current techniques fit into our classification of suitable defenses against four different attack types and how the proposed fBox algorithm can fill in the remaining holes to provide a more holistic framework for fraud detection.
| No Camouflage | Camouflage | |
|---|---|---|
| Blatant Attacks | \pbox10cmSpokEn; | |
| CopyCatch | \pbox10cmSpectral subspace plotting; | |
| CopyCatch | ||
| Stealth Attacks | (proposed) fBox | (proposed) fBox |
The four types of attacks we broach in this work are classified based on two dichotomies — the scale of attack and the presence of camouflage. The scale of attack concerns whether an attack of some size defined in terms of the aformentioned , and parameters in the context of a given dataset (and decomposition rank for spectral methods), is detectable or not. The attack could be staged using any of the fraud distribution patterns discussed in Section III. In the context of clustering methods, scale is more formally defined by the minimal attack size parameters used. Camouflage refers to uncommissioned actions conducted by attackers in order to appear more like honest users in the hopes of avoiding detection. For example, camouflage on Twitter is most commonly seen as attackers following some honest users for free in addition to paid customers. Attacks with camouflage are more difficult to detect than those without, given the increased likelihood of a practitioner to overlook suspicious actions.
IV-A Blatant Attack/No Camouflage
Of the four types, blatant attacks without camouflage are the easiest to spot. Blatant attacks whose singular values are above the threshold and thus appear in the rank- decomposition of spectral methods produce spoke-like patterns and can be identified using SpokEn. It is worth noting that SpokEn is a method to chip out large communities from graphs, and not necessarily attackers. Verification of the blatant lockstep behavior as fraudulent is required in this case.
IV-B Blatant Attack/Camouflage
Naturally, blatant attacks with camouflage are more difficult to spot than without. Though the singular values of the attacks are above the threshold and the associated singular vectors appear in the rank- decomposition of spectral methods, Jiang et al. showed that rather than axis-aligned spokes, the spectral subspace plots showed tilting rays. CopyCatch is also effective in detecting blatant attacks with camouflage (provided that the parameter choices are sufficiently large to limit the rate of false positives), given that camouflage is ignored in the case that an , , near-bipartite core is found for a subset of and for a fixed snapshot of the input graph.
IV-C Stealth Attack/No Camouflage
As concluded in Section III, current detection schemes are highly vulnerable to stealth attacks engineered to fall below parameter thresholds of for spectral methods or , , for clustering methods. To the best of our knowledge, no previous technique has been able to successfully and effectively identify users involved in these types of attacks. Though stealth attacks may be individually of lesser consequence to detect than larger cases of fraud, they have the insidious property of being able to achieve the same number of fraudulent actions in a more controlled and less detectable manner at the cost of simply creating more fraud-related accounts. In response to this threat, we propose the fBox algorithm for identifying such attacks in Section V and demonstrate its effectiveness in Section VI.
IV-D Stealth Attack/Camouflage
Given that identifying small scale attacks has thus far been an open problem in the context of fraud detection, the problem of identifying these with camouflage has also gone unaddressed. The difficulty in dealing with camouflage is particularly apparent when considering user accounts with few outgoing or incoming links, as is typically the case with smaller attacks. From the perspective of a practitioner, it may appear that a truly fraudulent account is mostly honest but with a few suspicious or uncharacteristic links (insufficient to mark as fraudulent) or infrequently/unsavvily used due to the small number of total links. We demonstrate in Section VI that fBox is robust to such smart attacks with moderate amounts of camouflage on real social network data.
V Proposed Algorithm
Thus far, we have seen how existing state-of-the-art techniques have firm effective detection thresholds and are entirely ineffective in detecting stealth attacks that fall below this threshold. Given this problem, it is natural to consider the following question — how can we identify the many numerous small scale attacks that are prone to slipping below the radar of existing techniques? In this section, we formalize our problem definition and propose fBox as a suitable method for addressing this problem.
V-A Problem Formulation
We identify the major problem to be addressed as follows:
Problem 2
Given an input graph adjacency matrix A, with rows and columns corresponding to users and objects (could be pages, articles, etc. or even other users), identify stealth attacks which are undetectable given a desired decomposition rank- for A (undetectable in that their singular values fall below the threshold ).
Note that Problem 2 is an exact foil to Problem 1. In this paper, we primarily focus on smart attacks which fall below a practitioner-defined spectral threshold, given that a number of previous works mentioned have tackled the problem of discovering blatant attacks. Given that this body of work is effective in detecting such attacks, we envision that the best means of boxing in attackers is a complementary approach to existing methods, as our analysis in Section IV is indicative of the lack of suitability of a one-size-fits-all technique for catching all attackers.
V-B Description
As per the problem formulation, we seek to develop a solely graph-based method, which will be able to complement existing fraud detection techniques by discerning previously undetectable attacks. In Section III, we demonstrated that smaller attacks are particularly characterized by comparatively low singular values (below ), and thus do not appear in the singular vectors given by a rank decomposition. Assuming an isolated attack which has been engineered to fall below the detection threshold, the users/objects comprising the attack will have absolutely no projection onto any of the top- left and right singular vectors respectively. In the presence of camouflage, projection of the culprit nodes may increase slightly given some nonzero values in the corresponding indices in one or more of the vectors. In either case, we note that nodes involved in these attacks have the unique property of having zero or almost-zero projections in the projected space. Given this observation, two questions naturally arise: (a) how can we effectively capture the extent of projection of a user or object? and (b) is there a pattern to how users or objects project into low-rank subspaces?
In fact, we can address the first question by taking advantage of the norm-preserving property of SVD, which states that the row vectors of a full rank decomposition and associated projection will retain the same norm or vector length as in the original space. That is, for ,
In the same fashion, one can apply the norm-preserving property to decomposition of to show
Since the norms are preserved in a full rank decomposition, it is obvious that the sum of squares of components are also preserved. Note that for the 0-1 adjacency matrix A we consider here, the sum of squares of components of the th row vector corresponds to the out-degree of user and the sum of squares of components of the th column vector corresponds to the in-degree of object — given these considerations, we define the degree of a node in a given subspace as the squared norm of its link vector in that subspace. Thus, for a full rank decomposition, the out-degree given by and reconstructed out-degree given by of user are equal. The same can be said for the in-degree and reconstructed in-degree of object . For rank decompositions where (guaranteed in practical use of spectral methods), it is clear that the true degrees upper bound the reconstructed degrees. Thus, we can capture the extent of projection of a user by the tuple of his true out-degree and reconstructed out-degree, and we can capture the extent of projection of an object by the tuple of its true in-degree and reconstructed in-degree.
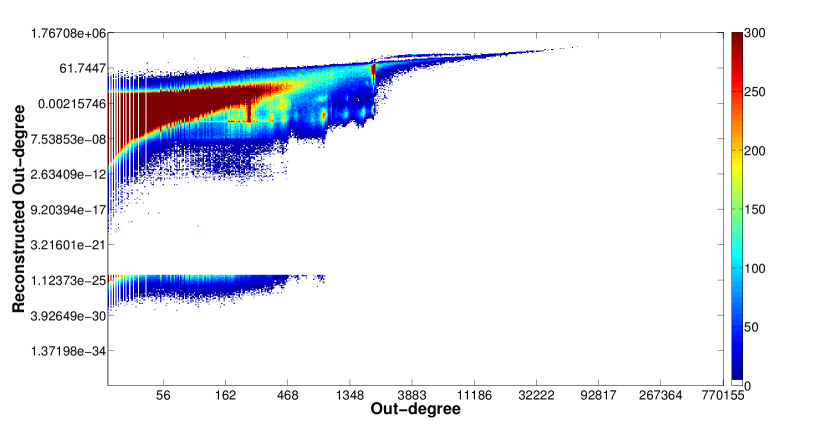
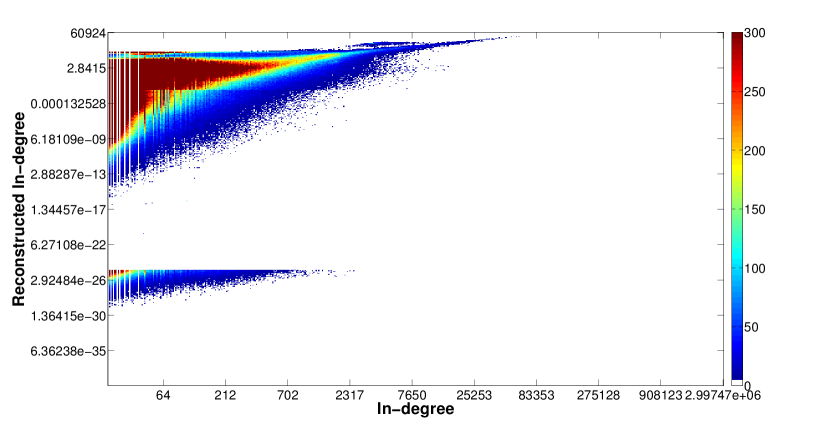
We conjecture that due to the different graph connectivity patterns of dishonest and honest users as well as dishonest and honest objects, their projections in terms of reconstructed degrees should also vary. Intuitively, dishonest users who either form isolated components or link to dishonest objects will project poorly and have characteristically low reconstruction degrees, whereas honest users who are well-connected to real products and brands should project more strongly and have characteristically higher reconstruction degrees. In fact, we find that in real data, users and objects have certain ranges in which they commonly reconstruct in the projected space. Figure 4 shows the OSRM (Out-link Spectral Reconstruction Map) and ISRM (In-link Spectral Reconstruction Map) for a large, multi-million node and multi-billion edge social graph from Twitter, where we model follower (fan) and followee (idol) behavior. The data is represented in heatmap form to indicate the distribution of reconstructed degrees for each true degree. The SRMs indicate that for each true degree, there is a tailed distribution with most nodes reconstructing in a common range and few nodes reconstructing as we move away from this range in either direction. Most notably, there are a large number of nodes with degrees up to the hundreds with an almost-zero reconstruction, depicted by a well separated point cloud at the bottom of both SRMs. For higher true degree values in the thousands, nodes are more sparse and rarely project as poorly as for lower true degrees, but many points at these degree values reconstruct several degrees of magnitude lower than the rest. These observations serve to substantiate our conjecture that poorly reconstructing nodes are suspicious, but what about the well reconstructing nodes? Interestingly, we find that nodes which reconstruct on the high range of the spectrum for a given degree have many links to popular (and commonly Twitter-verified) accounts. We do not classify such behavior as suspicious in the OSRM context, as it is common for Twitter users to follow popular actors, musicians, brands, etc. We do not classify such behavior as suspicious in the ISRM context either, as popular figures tend to more commonly be followed by other popular figures. At the bottom of the reconstruction spectrum, however, we most commonly find accounts which demonstrate a number of notably suspicious behaviors in the context of their followers/followees and the content of their Tweets — more details are given in Section VI.
Based on our intuitive conjecture and empirical verification, we focus our fBox algorithm on identifying nodes with characteristically poor reconstructed degree in comparison to other nodes of the same true degree as suspicious. Specifically, we mark the bottom percent of nodes per fixed degree for both users and objects as culprit nodes. We outline the high-level steps of fBox in Algorithm 1.
VI Experiments
VI-A Datasets
For our experiments we primarily use two datasets: the who-follows-whom Twitter graph and the who-rates-what Amazon graph. The Twitter graph was scraped by Kwak et al. in 2010 and contains 41.7 million users with 1.5 billion edges [11]. We showed the distribution of singular values in Figure 3(a). The Amazon ratings graph was scraped in March 2013 by McAuley and Leskovec [15] and contains 29 million reviews from 6 million users about 2 million products. The distribution of singular values can be seen in Figure 3(b). Our analysis is conducted both directly and via synthetic attacks.
VI-B fBox on real Twitter accounts

To show our effectiveness in catching smart link fraud attacks on real data, we conducted a classification experiment on data from the Twitter graph. Specifically, we collected the culprit results for suspicious fans and idols with degree at least 20 (to avoid catching unused accounts) for seven different values of the detection threshold , at 0.5, 1, 5, 10, 25, 50 and 99 percentile. For each combination of value and user type (fan or idol), we randomly sampled 50 accounts from the “culprit-set” of accounts classified as suspicious by fBox and another 50 accounts from the remainder of the graph in a 1:1 fashion, for a total of 1400 accounts. We randomly organized and labeled these accounts as suspicious or honest (ignoring foreign and protected accounts) based on several criteria — particularly, we identified suspicious behavior as accounts with some combination of the following characteristics:
-
•
Suspension by Twitter since data collection
-
•
Spammy or malicious tweets (links to adware/malware)
-
•
Suspicious username, or followers/followees have suspicious usernames (with common prefixes/suffixes)
-
•
Very few tweets (<5) but numerous (>20) followees who are themselves suspicious
-
•
Sparse profile but numerous (>20) followees who are themselves suspicious
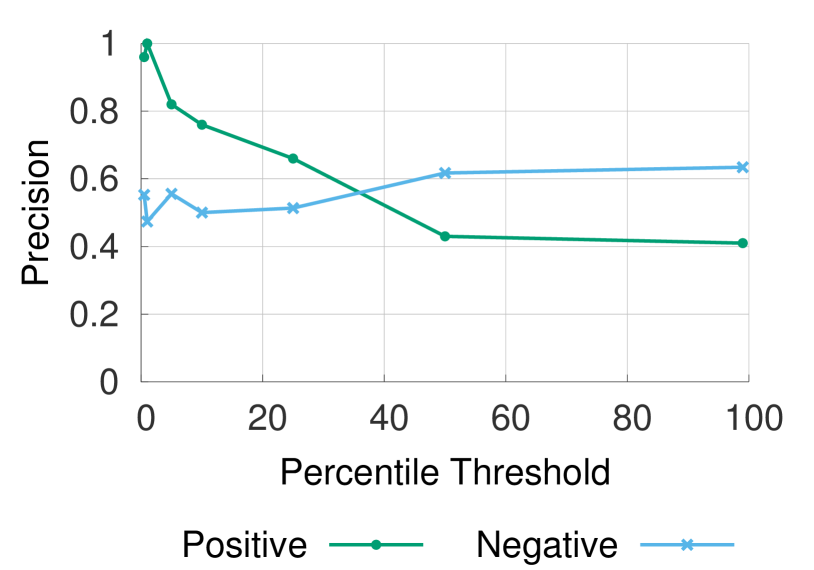
Figure 5 shows how the performance of fBox varies with the threshold for Twitter fans and idols. As evidenced by the results, fBox is able to correctly discern suspicious accounts with 0.93+ precision for for both fans and idols. And as expected, increasing results in lower precision. As with many informational retrieval and spam detection problems, there are an unbounded number of false negatives, making recall effectively impossible to calculate. Rather, we use the negative precision and observe that it increases as we increase . Ultimately, because fBox is meant to be a complementary method to catch new cases of fraud, we do not believe that missing some of the attackers already caught by other methods is a major concern. With these considerations, we recommend conservative threshold values for practitioner use. On Twitter data, we found roughly 150 thousand accounts classified as suspicious between the SRMs for .


VI-C Complementarity of fBox
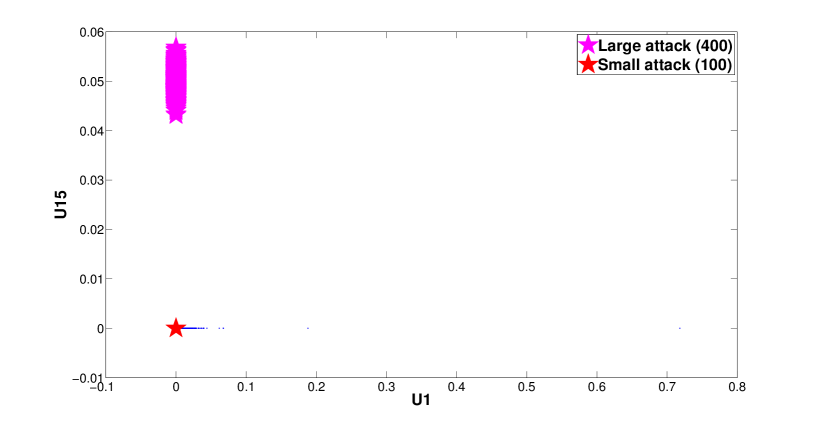
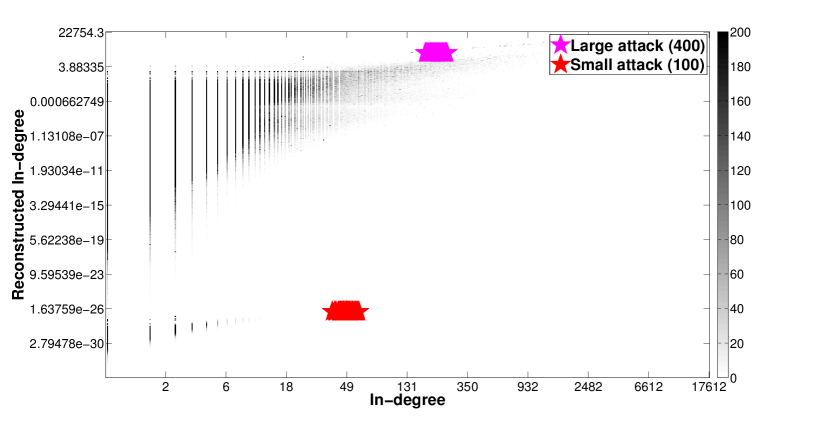
As mentioned before, fBox is complementary to spectral techniques and is effective in catching smart attacks that adversaries could engineer to avoid detection by these techniques. We demonstrate this claim using both synthetically formulated attacks on the Amazon network as well as comparing the performance of both fBox and SpokEn on the Twitter network. In the first experiment, we inject random attacks of scale 100 () and 400 (), each with density into the Amazon graph and compare the effectiveness of spectral subspace plots and SRMs in spotting these attacks. Figure 6(a) shows the spectral subspace plot for the 1st and 15th components of the SVD, corresponding to one naturally existing community and the blatant attack, respectively. The plot clearly shows nodes involved in the blatant attack as a spoke pattern, but groups the nodes involved in the small attack along with many honest nodes that reconstruct poorly in these components at the origin point. However, in Figure 6(b), we see that the smaller injection is identified as clearly suspicious with distinct separation from other legitimate behavior.
We additionally tested both fBox and SpokEn on a number of injections sizes, each random attacks with . Figure 6(c) shows the fraction of the attacking fans caught by each algorithm. As seen in the figure, the two methods are clearly complementary, with fBox catching all attacks that SpokEn misses. This verifies the analysis in Section III and substantiates fBox’s suitability for catching stealth attacks that produce leading singular value .
In our second experiment, we compared the performance of both fBox and SpokEn on a sample of 65743 accounts selected from the Twitter graph. For each of these accounts, we queried the Twitter API to collect information regarding whether the account was suspended or had posted Tweets promoting adware/malware (checked via Google SafeBrowsing), and if so we marked the account as fraudulent. This ground truth marking allows us to unbiasedly measure the complementarity of fBox and SpokEn in catching users that are surely malicious. Of these users, 4025 were marked as fraudulent via Twitter (3959) and Google SafeBrowsing (66). For rank , SpokEn produced 8211 suspicious accounts whereas fBox (with ) produced 149899. The user sets identified by both methods were found to be completely distinct, suggesting that the methods are indeed complementary. Furthermore, fBox identified 1133 suspicious accounts from the sampled dataset, of which only 347 were caught via Twitter and Google SafeBrowsing, suggesting that roughly 70% of fBox-classified suspicious accounts are missed by Twitter.
VI-D fBox in the face of camouflage
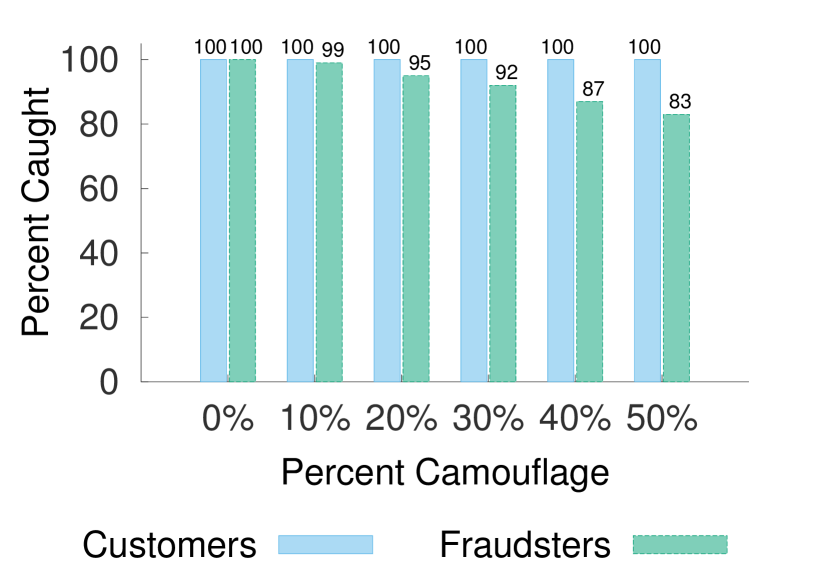
One key point in dealing with intelligent attackers is ensuring that fBox is robust in detecting attacks with moderate amounts of camouflage. To measure our performance in such a setting, we ran fBox on a variety of attack sizes in our target range and for each attack varied the amount of camouflage added. In our model, we include camouflage by following honest accounts at random. For a random attack of size and edge probability , we vary the percent of idols of fraudulent fans that are camouflage: for 0% camouflage each fan follows the customers only and for 50% camouflage each attacker node follows customers and random honest idols — in general, the percent of camouflage for camouflage links is defined as . We ran this test for attacks of size 100, 250, and 500 (all below the detection threshold) with on the Twitter graph.
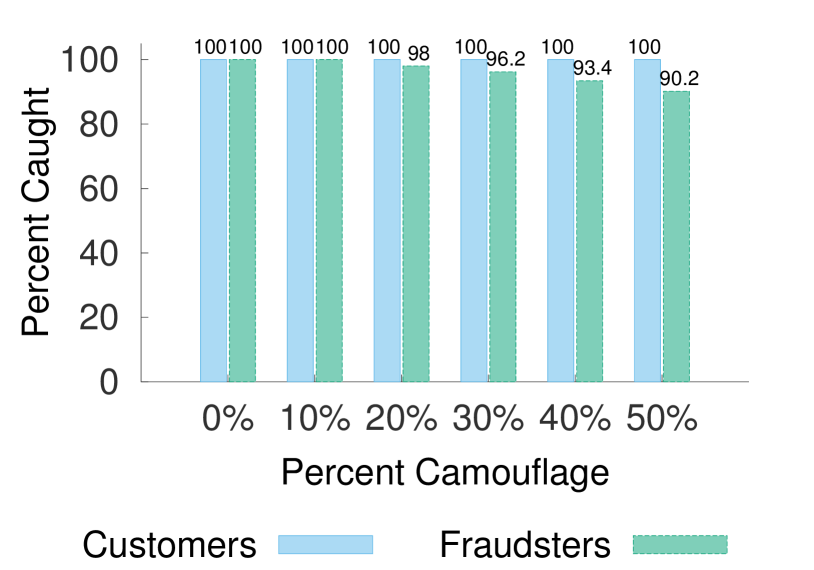
Figure 7 demonstrates fBox’s robustness — for all configurations of attack size and camouflage, we catch all customer idols and over 80% of fraudulent fans. As attack size increases, increased camouflage is less impactful (intuitively, larger attacks are more flagrant), with fBox catching over 90% of the fraudulent fans even with 50% camouflage.
Analysis on fame, where customers buying links also have honest links was not conducted. Customer fame is the analog of attacker camouflage. However, we expect similar results in detection of accounts in the presence of fame given the symmetry of SVD and fBox’s disjoint user/object reconstruction. However, the presence of fame is less realistic in many applications — for example, in the Twitter context, it is difficult for a spammy account to get honest fans whereas fraudulent fans can follow real idols at will.
VI-E Scalability of fBox
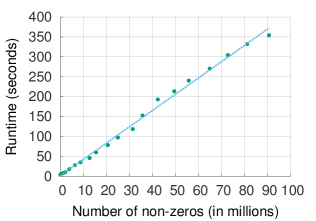
The running time of fBox is dominated by the (linear) large matrix-vector multiplication per iteration of the Lanczos algorithm to compute SVD for large, sparse matrices. Figure 8 depicts the linear runtime of fBox for while varying number of non-zeros.
VII Conclusions
In this work, we approached the problem of distinguishing dishonest attackers and their customers from honest users in the context of online social network or web-service graphs using a graph-based approach (using the adjacency matrix representing user/object relationships). Our main contributions are:
-
1.
Theoretical analysis: We examine several state-of-the-art fraud detection methods from an adversarial point-of-view and provide theoretical results pertaining to the susceptibility of these methods to various types of attacks.
-
2.
fBox algorithm: We detail fBox, a method motivated by addressing the blind-spots discovered in theoretical analysis, for detecting a class of stealth attacks which previous methods are effectively unable to detect.
-
3.
Effectiveness on real data: We apply fBox to a large Twitter who-follows-whom dataset from 2010 and discover many tens of thousands of suspicious users whose accounts remain active to date
Our experiments show that our method is scalable, effective in detecting a complementary range of attacks to existing methods and robust to a reasonable degree of camouflage for small and moderately sized stealth attacks.
References
- [1] L. Akoglu, M. McGlohon, and C. Faloutsos. Oddball: Spotting anomalies in weighted graphs. Advances in Knowledge Discovery and Data Mining, pages 410–421, 2010.
- [2] A. Beutel, K. Murray, C. Faloutsos, and A. J. Smola. Cobafi - collaborative bayesian filtering. In WWW, 2014.
- [3] A. Beutel, W. Xu, V. Guruswami, C. Palow, and C. Faloutsos. Copycatch: stopping group attacks by spotting lockstep behavior in social networks. In WWW, pages 119–130. ACM, 2013.
- [4] N. Dalvi, P. Domingos, S. Sanghai, D. Verma, et al. Adversarial classification. In SIGKDD, pages 99–108. ACM, 2004.
- [5] P. Erdős and A. Rényi. On random graphs. Publicationes Mathematicae Debrecen, 6:290–297, 1959.
- [6] S. Ghosh, B. Viswanath, F. Kooti, N. K. Sharma, G. Korlam, F. Benevenuto, N. Ganguly, and K. P. Gummadi. Understanding and combating link farming in the twitter social network. In WWW, pages 61–70. ACM, 2012.
- [7] C. Grier, K. Thomas, V. Paxson, and M. Zhang. @ spam: the underground on 140 characters or less. In CCS. ACM, 2010.
- [8] L. Huang, D. Yan, M. I. Jordan, and N. Taft. Spectral clustering with perturbed data. In NIPS, volume 21, 2008.
- [9] M. Jiang, P. Cui, A. Beutel, C. Faloutsos, and S. Yang. Inferring strange behavior from connectivity pattern in social networks. In PAKDD, 2014.
- [10] U. Kang, B. Meeder, E. E. Papalexakis, and C. Faloutsos. Heigen: Spectral analysis for billion-scale graphs. TKDE, 26(2):350–362, 2014.
- [11] H. Kwak, C. Lee, H. Park, and S. Moon. What is Twitter, a social network or a news media? In WWW, pages 591–600. ACM, 2010.
- [12] J. Leskovec, D. Huttenlocher, and J. Kleinberg. Signed networks in social media. In SIGCHI, pages 1361–1370. ACM, 2010.
- [13] D. Lowd and C. Meek. Adversarial learning. In SIGKDD, pages 641–647. ACM, 2005.
- [14] C.-H. Mao, C.-J. Wu, E. E. Papalexakis, C. Faloutsos, and T.-C. Kao. Malspot: Multi2 malicious network behavior patterns analysis. In PAKDD, 2014.
- [15] J. McAuley and J. Leskovec. Hidden factors and hidden topics: understanding rating dimensions with review text. In RecSys, pages 165–172. ACM, 2013.
- [16] Netflix. Netflix competition. 2006.
- [17] A. Y. Ng, M. I. Jordan, and Y. Weiss. On spectral clustering: Analysis and an algorithm. NIPS, 14:849–856, 2001.
- [18] S. Pandit, D. H. Chau, S. Wang, and C. Faloutsos. Netprobe: a fast and scalable system for fraud detection in online auction networks. In WWW, pages 201–210. ACM, 2007.
- [19] B. Prakash, M. Seshadri, A. Sridharan, S. Machiraju, and C. Faloutsos. Eigenspokes: Surprising patterns and community structure in large graphs. PAKDD, 84, 2010.
- [20] N. Shrivastava, A. Majumder, and R. Rastogi. Mining (social) network graphs to detect random link attacks. In ICDE. IEEE, 2008.
- [21] X. Ying, X. Wu, and D. Barbará. Spectrum based fraud detection in social networks. In ICDE, pages 912–923. IEEE, 2011.