Quantifying the Heating Sources for Mid-infrared Dust Emissions in Galaxies:
The Case of M 81⋆⋆\star⋆⋆\starHerschel is an ESA space observatory with science instruments provided by European-led Principal Investigator consortia and with important participation from NASA.
Abstract
With the newly available SPIRE images at 250 and 500m from Herschel Space Observatory, we study quantitative correlations over a sub-kpc scale among three distinct emission components in the interstellar medium of the nearby spiral galaxy M 81 (NGC 3031): (a) or , the surface brightness of the mid-infrared emission observed in the Spitzer IRAC 8 or MIPS 24m band, with and being dominated by the emissions from Polycyclic Aromatic Hydrocarbons (PAHs) and very small grains (VSGs) of dust, respectively; (b) , that of the cold dust continuum emission in the Herschel SPIRE 500m band, dominated by the emission from large dust grains heated by evolved stars, and (c) , a nominal surface brightness of the H line emission, from gas ionized by newly formed massive stars. The results from our correlation study, free from any assumption on or modeling of dust emissivity law or dust temperatures, present solid evidence for significant heating of PAHs and VSGs by evolved stars. In the case of M 81, about 67% (48%) of the 8m (24m ) emission derives its heating from evolved stars, with the remainder attributed to radiation heating associated with ionizing stars.
Subject headings:
galaxies: individual: M 81 — galaxies: ISM — galaxies: star formation — infrared: galaxies — infrared: ISM — ISM: lines and bands1. Introduction
Mid-infrared (5 to 40m ) emission in the interstellar medium (ISM) of normal disk galaxies is dominated by (a) broad emission features over 5-15m , with main features at 6.2, 7.7, 8.6, 11.3, 12.7m (e.g., Lu et al. 2003), and (b) a hot dust continuum longward of 15m , which was first detected by IRAS in our own Galaxy (e.g., Castelaz et al. 1987). While (a) is widely believed to be the emission bands from Polycyclic Aromatic Hydrocarbon molecules (PAHs) of sizes up to 20 Å (Puget & Léger 1989; Allamandola et al. 1989), (b) is commonly attributed to the emission from very small grains (VSGs) of dust of sizes of 20 to 100 Å (Puget & Léger 1989; Désert et al. 1990). PAHs and VSGs are both heated transiently through absorption of single UV/optical photons. For a given PAH or VSG population and a largely fixed shape of heating radiation field, the spectral shape of the PAH or VSG emission should be largely independent of the intensity of the radiation field (e.g., Draine & Li 2007). As a result, the total flux integrated over their spectrum scales linearly with a flux density sampled at any frequency over the spectrum. A practical choice is to use the flux densities measured with the Spitzer IRAC camera in its 8m band and MIPS camera at 24m to respectively represent the spectrally integrated fluxes of the PAH and VSG emissions. We note that the picture described above may not be fully applicable to all types of galaxies. For example, for early-type galaxies, the stellar emission may be significant at 8m ; for starburst galaxies, the emission from large dust grains may start to contribute at 24m when their thermal equilibrium temperature reaches above 45 K (e.g., Boulanger et al. 1988).
Both the 8 and 24m flux densities have been used widely as tracers of current star formation rate (SFR), both in the local universe and at high redshifts. Of these two, the 8m flux is more controversial as to whether the heating of the underlying PAHs is primarily derived from current star formation: On one hand, the PAH emission has been shown to correlate with a known SFR tracer such as the H line emission, mostly based on flux-to-flux correlations (e.g., Roussel et al. 2001; Förster Schreiber et al. 2004; Wu et al. 2005; Zhu et al. 2008); on the other hand, it has been well known from COBE (e.g., Dwek et al. 1997), ISO (e.g., Lemke et al. 1998; Uchida et al. 1998), IRTS (e.g., Chan et al. 2001) and Spitzer (e.g., Lu 2004) that, in our own Galaxy, the PAH emission arises plentifully in the general ISM and discrete sources devoid of a strong UV radiation field. Additional support for a possible PAH component unrelated to current star formation in normal spirals includes striking similarity in the large-scale intensity maps of the PAH emission and the cold dust continuum emission at 850m (Haas et al. 2002), results from various surface brightness correlation studies based on ISO (e.g., Boselli et al. 2004; Irwin & Madden 2006) and Spitzer (e.g., Bendo et al. 2008), as well as the fact that either the 8m or the 24m to the H flux density ratio differs significantly between within or near individual H ii regions and over galaxies as a whole (e.g., Calzetti et al. 2007; Zhu et al. 2008; Kennicutt et al. 2009).
A framework that is probably acceptable to both schools of opposite views is such that a line-of-sight flux of the PAH emission normally consists of two components: a “warm” component powered by current star formation and a “cold” diffuse component powered by the general interstellar radiation field dominated by evolved stars. The controversy described above stems largely from the fact that it is practically impossible to unambiguously separate these two components in a two-dimensional galaxy image as they are not spatially anti-correlated because the Kennicutt-Schmidt law (Schmidt 1959; Kennicutt 1998) dictates that the dust/gas distribution should concentrate around star-forming regions even if much of the surrounding emission from a particular dust population may not be directly related to the current star formation. One can reduce (but not totally eliminate) this “degeneracy” by studying dust emission maps at finer linear scales.
Recent images from Herschel Space Observatory (hereafter Herschel; Pilbratt et al. 2010) provided cold dust emission maps at linear resolutions as low as 100 pc in some nearby disk galaxies, such as M 33 (Boquien et al. 2011; Xilouris et al. 2012; Calapa et al. 2014) and NGC 2403 (Jones et al. 2014). By correlating the 8m emission with a sub-millimeter flux density of the cold dust emission or the stellar continuum flux density at 3.6m , these studies generally favor the picture that most of the PAH emission in a normal disk galaxy is not directly related to the on-going star formation (but also see Croker et al. 2013). Most of the aforementioned studies inherit one or both of the following limitations: they either used a flux density at a fixed wavelength (e.g., 250m ) to characterize the cold dust emission or a near-IR stellar continuum (e.g., at 3.6m ) to represent the heating radiation field of non-ionizing stars. The former could introduce biases as the cold dust emission is always in a thermal equilibrium with the heating radiation field and a monochromatic flux density at a fixed wavelength represents a variable fraction of the total (i.e., frequency-integrated) cold dust emission across a galaxy disk; the latter may bias against the type of non-ionizing stars that are most efficient in dust heating when it is used across the entire galaxy.
In this paper, we use an alternative, “two-component” analysis to separate the warm and cold dust emission components across a galaxy disk. This method is in principle valid for galaxy images with any angular resolution and free from either of the potential biases mentioned above. Our goal is to answer whether or under what condition the warm PAH component becomes the dominant one for a star-forming galaxy as a whole. Lu & Helou (2008) pioneered this approach using a sample of IRAS galaxies with available 850m fluxes. Let and be the spectrally integrated fluxes of the corresponding warm and cold emissions from large dust grains in the far infrared (FIR), one can write
| (1) |
where and are two scaling factors to be determined observationally. is the spectrally integrated flux of the PAH emission, which is simply proportional to the flux of any combination of the major PAH bands. Strictly speaking, both A and B, which measure the PAH emission relative to the large dust grain emission, are constant under the conditions of (a) a fixed dust mass spectrum (i.e., a fixed PAH-to-large dust grain abundance ratio) and (b) a more or less fixed shape of the dust heating radiation field in each of the cold and warm components (e.g., of similar hardness). In reality, both (a) and (b) can certainly vary from one galaxy to another and may even vary modestly across a galaxy disk. Nevertheless, it is still meaningful to derive values of A and B averaged over a galaxy disk or galaxies of some similar properties (e.g. comparable FIR dust color temperatures).
Replacing with the IRAC 8m flux density and deriving and crudely from the IRAS 60 and 100m and the 850m fluxes, Lu & Helou (2008) found statistically that the cold PAH component is usually the dominant one except for very actively star-forming galaxies [i.e., those with an IRAS 60-to-100m flux density ratio (hereafter referred to as FIR color), ]. One implication from this study is that the fractional PAH emission from the star formation component varies from galaxy to galaxy. If further confirmed, this may pose apparent conflict with the constant star-formation fraction of the PAH emission used in the composite H and 8m SFR tracer for galaxies (e.g., Kennicutt et al. 2009).
With the unprecedented sensitivity and improved spatial resolution of the SPIRE photometers (Griffin et al. 2010) on board Herschel, images of nearby spiral galaxies at 250, 350 and 500m with sub-kpc linear resolutions have become available. For normal spiral galaxies, these images are usually dominated by the cold dust emission powered by evolved stars (e.g., Bendo et al. 2012). This makes it possible to carry out a two-component analysis over the disks of individual galaxies at a linear resolution limited by the SPIRE images, not only for the PAH emission, but also for the VSG dust emission. In this paper, we present a case study on M 81 (NGC 3031), one of the nearest normal spiral galaxies. M 81 has a morphological type SA(s)ab and an optical disk of (i.e., in B; de Vaucouleurs et al. 1991), inclined at from face-on (de Blok et al. 2008). At its distance of 3.63 Mpc (Karachentsev et al. 2002), the 36.3″ beam of the full width at half maximum (FWHM) of the SPIRE 500m band corresponds to 0.64 kpc. The galaxy is relatively infrared quiescent with a FIR color of 0.26 and has an IRAS FIR luminosity of (Rice et al. 1988). M 81 is known to host a weak nuclear LINER (Heckman 1980), which may have some effect on the nuclear infrared emission. However, this should be limited to within one SPIRE 500m beam size (Bendo et al. 2012) and have little effect on our statistical results that are dominated by the galaxy disk. In the remainder of this paper, we lay out our method in §2, describe the data used in §3, present our correlation analysis results in §4 and assess potential systematics in §5. We then discuss some astronomical implications in §6 and finally summarize our main conclusions in §7.
2. Method
We can rewrite eq. (1) in terms of surface brightnesses. For the PAH emission, we have
| (2) |
where is the surface brightness of the PAH emission in the Spitzer IRAC 8m band, is the nominal surface brightness of the H line emission, is the surface brightness of the dust continuum emission in the SPIRE 500m band, and the factor is defined as such that
| (3) |
where the integration is performed in frequency over the cold dust emission spectrum of temperature . While eq. (3) illustrates the definition of in the context of a single temperature dust emission, itself is a generic K-correction factor that is valid even if the cold dust emission involves multiple dust temperatures and/or emissivities.
The first term on the right-hand side of eq. (2) represents the warm component of the PAH emission, under the implicit assumption that the H line emission scales well locally with the far-UV light that dominates the heating of the warm dust. This should be a fairly good assumption for disk galaxies of normal gas surface brightness and metallicity, such as M 81, as the dust and gas are well mixed and the dust absorption of far-UV light is very efficient. Observationally, this is backed up by the nearly one-to-one correlation observed between the PAH and H surface brightnesses for individual H ii regions in normal galaxies (e.g., Calzetti et al. 2007). (We revisit this and other potential systematics in our method in §5.)
The second term on the right-hand side of eq. (2) represents the cold PAH component, under the assumption that is dominated by the continuum emission of large dust grains heated mainly by evolved stars. We show in §4 that this assumption should be a good one in the case of M81, a conclusion that was also reached independently by Bendo et al. (2012). The factor in eq. (2) depends on both cold dust temperature and dust emissivity . Using the data from and the spectral-energy-distribution (SED) fitting methods applied by Bendo et al. (2010), we see that, at radii greater than 3 kpc in M81, the cold dust heated by the evolved stars has temperatures of 15-20 K and values of approximately 2. For these SED fits, increases from 4 to 6 with , where is the surface brightness in the SPIRE 250 m band. It will become clear in §4 that this empirical approach (as opposed to a full modeling of the quantity ) has the advantage that our results are largely free from any assumption on or . The two constant scaling factors in eq. (2), and , are to be determined from the data.
Similarly we can also write , the surface brightness of the dust emission in the Spitzer 24m band, as follows:
| (4) |
where and are two appropriate scaling factors to be determined.
3. Data
3.1. Herschel Images at and m
The SPIRE images used in this paper are the same as those given in Bendo et al. (2012) and were from a SPIRE observation (Obs. ID ) under the Very Nearby Galaxy Survey project (PI: C. D. Wilson). The observation, data reduction and image construction were described in detail in Bendo et al. (2012). The original images have a size of and a flux calibration uncertainty of 10% (i.e., Herschel Interactive Processing Environment or HIPE, version 5). The overall SPIRE flux calibration accuracy has since improved. Nevertheless, this has no effect on the correlation analysis performed in this paper as the SPIRE detector nonlinearity correction remained unchanged. The adopted spatial resolutions of these images are given in Table 1.
Although the original images came with sky subtracted, the surrounding regions of M 81 show patchy cirrus dust emission from our Galaxy (Davies et al. 2010). These extended emissions pose some limits on the accuracy of sky subtraction. Nevertheless, a mean residual sky background was carefully removed from each SPIRE image. We further smoothed the 250m image to the same spatial resolution of the 500m image using a Gaussian kernel with a FWHM of 31.4″ []. The smoothed 250m image was then resampled to the same pixel scale as the 500m image. No color correction was applied to either image.
| Waveband (m ): | 3.6 | 8 | 24 | 250 | 500 | H |
|---|---|---|---|---|---|---|
| FWHM (arcsec): | 1.7a | 1.9a | 6.0a | 18.2b | 36.3b | 1.0 |
| Pixel size (arcsec): | 0.75 | 0.75 | 2.45 | 6 | 14 | 2.03 |
3.2. Spitzer Images at 8 and 24m
The IRAC images at 3.6 and 8.0m and MIPS image at 24m used in this paper are the released mosaic images from the Spitzer Infrared Nearby Galaxies Survey project (SINGS161616The description of these images can be found at http://irsa.ipac.caltech.edu/data/SPITZER/SINGS/.; Kennicutt et al. 2003). The images we used here are similar to those in Bendo et al. (2008). We further multiplied the 3.6 and 8m images by 0.91 and 0.74 (see IRAC Instrument manual, Table 4.8), respectively, to be consistent with the extended-source flux calibration.
The resulting 3.6m image was smoothed to the spatial resolution of the 8m image using a Gaussian kernel with a FWHM of [] (cf. Table 1). The smoothed 3.6m image was used to remove the stellar contribution in the 8m image as follows:
| (5) |
where and stand for the observed surface brightnesses at 8 and 3.6m , respectively. The term (see Helou et al. 2004) in eq. (5) accounts for the stellar flux at 8m if all of is of stellar origin. In reality, the 3.6m flux in disk galaxies is contaminated by a dust continuum (e.g., Lu et al. 2003; Mentuch et al. 2010). This contamination is equal to 5% (Lu 2004). The denominator on the right hand side of eq. (5) corrects for this. The non-stellar 8m image was subsequently smoothed to the same spatial resolution as the SPIRE 500m image, and resampled to a pixel scale. This smoothing process used a Gaussian kernel with a FWHM of [].
As an early-type disk galaxy, M 81 has a large bulge, which has some stellar
contamination even at 24m , especially in the low
surface brightness regions between spiral arms. This stellar contamination
was removed as follows: First, the 3.6m image was smoothed to match
the point spread function (PSF) of the 24m image using an IRAC 3.6
to MIPS 24m convolution
kernel171717Available at http://dirty.as.arizona.edu/ kgordon/mips
/conv-psfs/conv-psfs.html.
appropriate for a 100 K blackbody spectrum (see Gordon et al. 2008).
This kernel function takes into consideration
the fact that the MIPS 24m PSF deviates from a Gaussian profile. The kernel
was first azimuthally averaged before it was convolved with the IRAC 3.6m image. The convolved image was then multiplied by a factor 0.0258
[, with the factor from eq. (5)]
and subsequently subtracted from the 24m image. The amount of the subtraction accounts for 1-2% of along
the spiral arms, but could be as large as 10-15% of in
the low surface brightness regions between the outer spiral arms.
The resulting dust-only 24m image was further smoothed to
the resolution of the SPIRE 500m band using the same 24-to-500µm convolution kernel as in Bendo et al. (2012). Finally, the resulting 24m image was also resampled to a pixel scale.
3.3. H Image
The H image was taken, via NASA/IPAC Extragalactic Database (NED), from Hoopes et al. (2001) with the original image presented in Greenawalt et al. (1998). The image was taken in a filter of 75Å in bandwidth, which encompasses the [N ii] doublet. In M 81, the metallicity varies (mainly radially) slowly across the outer disk (i.e., over a face-on radius between 5 and 11 kpc), but increases more rapidly towards the nucleus within the bulge (Garnett & Shields 1987). We assumed a constant ratio of [N ii]/H for the disk and did not subtract [N ii] from the H image. We discuss in §5 the potential systematic effect on our results from possibly higher [N ii]/H ratios within the bulge. The image was rotated to the correct orientation, smoothed to the resolution of the SPIRE 500m image using a simple Gaussian kernel based on the FWHM values given in Table 1, and resampled to our final pixel size of 14″. There are other H images available (e.g., Boselli & Gavazzi 2002; Sánchez-Gallego et al. 2012). They are quantitatively very similar to the one we used in the paper, at least outside the nucleus.
The original H image has a flux unit of W/m2/arcsec2 (Greenawalt et al. 1998). We converted the image into a nominal surface brightness by dividing each image pixel value by the H rest-frame frequency of Hz. No correction for either foreground or internal extinction was done in this work. The foreground and average internal disk extinctions for M 81 are on the order of and 0.4 mag, respectively (e.g., Perelmuter & Racine 1995; Schroder et al. 2002) and should have no effect on our analysis results. On the other hand, a significant patchiness in the internal extinction could have some systematic effect on our analysis. The inferred internal extinctions towards a large number of globular clusters across the entire disk of M 81 show only a moderate variation, within a factor of 2 of the mean value (Schroder et al. 2002). Nevertheless, local internal extinction could be significantly higher towards prominent star-forming regions (e.g., Kaufman, et al. 1989), resulting in a systematic difference in the attenuation of the H line flux between star-forming and diffuse regions. We come back to discuss its effect on our results in §5.
It has been known that star-forming disk galaxies show substantial “diffuse” ionized gas and H line emission outside bright H ii regions (e.g., Reynolds 1991; Walterbos & Braun 1994; Haffner et al. 2009 and the references therein). It is generally believed that this diffuse H emission is associated with ionizing radiation that leaks out of H ii regions (e.g., Matthis 1986; Ferguson et al. 1996; Wood & Reynolds 1999) although some dust scattering of H photons may also play a role at least at high galactic latitudes (e.g., Mattila et al. 2007; Witt et al. 2010). In this paper, we follow the notion that the diffuse H line flux originates from current star formation and that its associated local UV light powers a warm dust emission component.
All the final images were spatially co-aligned, and have a pixel scale of 14″ and an image size of 76 pixels (East-West) times 117 pixels (North-South). The surface brightness units are Jy per pixel for all but the H image, for which the units are mJy per pixel. These images, except for the 250m image, are shown in Fig. 1, where only image pixels with a surface brightness 3 times above the corresponding sky noise are plotted. Both Herschel 250 and 500m images can also be seen in Bendo et al. (2012).
4. Analysis
4.1. Surface Brightness Ratios
On the surface, all the four images in Fig. 1 have similar appearances and trace each other well qualitatively, except for the nucleus where it is relatively faint in the 500m image. The ellipse shown in each image corresponds to a face-on angular radius, ″(), outside of which becomes mostly below . The apparent correlation across all the bands over much of the galaxy disk is, to a large extent, a result of the fact that dust, gas and star distributions are all regulated by the spiral pattern. As a result, one can always find a flux-to-flux correlation to a certain degree between any two wavebands.
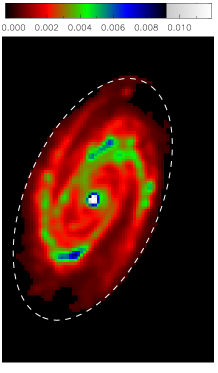
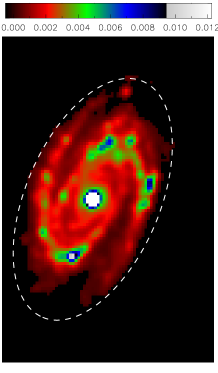
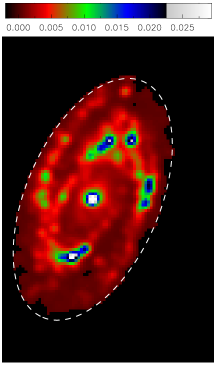
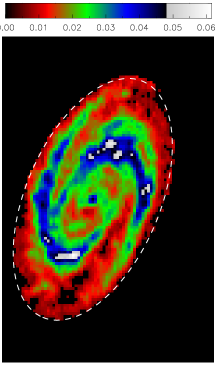
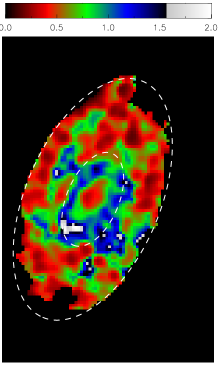
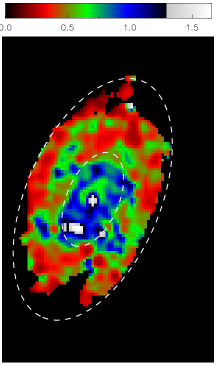
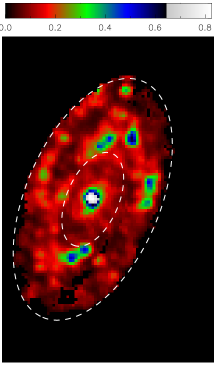
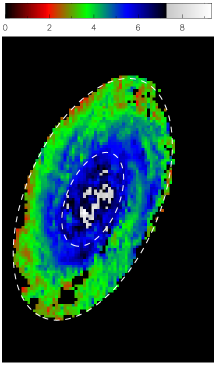
In Fig. 2 we show surface brightness ratio images of , , and . The two ellipses shown in each image correspond to the face-on circles of 250″ and 644″(i.e., 4.4 and 11.3 kpc at the galaxy distance), respectively. The inner radius was chosen for the following considerations: (1) there are no discreet H ii regions within this radius (except for the nuclear region), and (2) in the outer disk, over , the bright H ii and diffuse regions occupy similar ranges in .
While the first three ratio images in Fig. 2 are quite patchy, the image of is much more smooth, consistent with the claim by Bendo et al. (2010, 2012) that the dust emission over these wavelengths derives mostly its heating from evolved stars, which are also more smoothly distributed than ionizing stars across the galaxy disk. This is further supported by the radial color plots in Fig. 3, where the azimuthal averages and sample standard deviations in individual radial bins are shown for the same four surface brightness ratios in Fig. 2. The averages are normalized by the value in the inner most radial bin; the sample standard deviations are normalized by the actual (i.e., unnormalized) average radio in their corresponding radial bin. It is clear that the ratio is much smoother than the other 3 ratios in terms of both radial and azimuthal variations. Furthermore, the ratio shows only marginal change at most across any of those prominent disk H ii regions visible between the two marked ellipses in the image of . We found that the reduction in from within one of these H ii regions to the general ISM just outside the H ii region (but at the same galactocentric distance) is no more than 12%.
Fig. 4 plots the expected color change in as a function of the 250m flux density ratio of a warm dust emission of 30, 40 or 50 K to a cold dust component of K. Such a cold dust component can reproduce well the observed median ratio of over the outer disk when the dust emissivity scales as . Two-component SED fits to the FIR dust emission in normal galaxies generally result in between 30 and 40 K (e.g., Bendo et al. 2003), which correspond to the region between the solid and dashed curves in Fig. 4. These curves show that a Y-axis value of 1.14 [; i.e., a 14% H ii-related enhancement relative to the diffuse region just outside the H ii region] corresponds to an X-axis reading of less than 0.3. As a result, the warm dust emission associated with the current star formation in M 81 contributes to less than 23% of the total observed flux at 250m based on Fig. 4. At 500m , this contribution should be less than 13%. In the remainder of this paper, we regard as being only associated with large dust grains heated by evolved stars.


Fig. 2 also reveals an apparent anti-correlation between either or and , in the sense that local peaks in the last ratio correspond to local dips in either of the former ratios, suggesting that there are factors other than in powering or . In particular, both the and images have peaks in the bulge/inner disk region, between the outer disk, where the major spiral arms and prominent H ii regions reside, and the circumnuclear region, where an enhanced H emission is seen. This bulge/inner disk area is devoid of discrete H emission of high surface brightness, yet, the original high-resolution IRAC 8m image shows clearly PAH emission in spiral patterns (see Willner et al. 2004). Taking at face value, the ratio images in Fig. 2 suggest that evolved stars play a significant role in heating both PAHs and VSGs in the case of M 81.
4.2. Correlation Analysis
We can analyze Fig. 2 in a more quantitative way via eqs. (2) to (4). To do so, we first resampled all the images to a pixel size of 36″, roughly equal to the spatial resolution of the SPIRE 500m band. This is to ensure that individual image pixels are statistically independent from each other. With all the images having the same flux units of Jy per pixel, Fig. 5 is a simple pixel plot of vs. using all those 36″ image pixels between of 250″ and 644″, for which the 3 surface brightness values involved are all above 3 times their corresponding background noise. This outer disk hosts prominent H ii regions, along the major spiral arms, which should provide a significant or even dominant heating source for the mid-IR dust emissions. Another practical consideration of using only the outer disk in Fig. 5 is to maintain more or less the same (and finite) range in the values of between the diffuse regions and the H ii-dominated regions, in order to obtain an unbiased slope from fitting eq. (2) or (4) to the data.

Indeed, the outer-disk data points in Fig. 5 span a range of a factor of 10 in terms of . In contrast, remains smooth and varies only by a factor of 2 (see Fig. 2). We therefore applied least-squares fits of eq. (2) to the data points in Fig. 5, resulting in the two lines shown. The solid line is from a simple regression by minimizing the vertical residuals, while the dotted line is from a full regression by minimizing the residuals along both axes. Within the uncertainties, both the fits agree with each other and can be represented by the following result:
| (6) |

We also carried out the same analysis on the 24m emission in Fig. 6 via eq. (4). Fig. 6 is similar to Fig. 5, but using instead. The least-square fits shown in the figure can be represented by
| (7) |
| Region | |||
|---|---|---|---|
| Diffuse | |||
| H II |
It is interesting to see, via eq. (6) or (7), how the warm and cold dust components compare with each other at different locations in the outer disk of the galaxy. Table 2 compares the fractional flux contributions at 8 or 24 µm from the warm dust component between two locations that differ by a factor of 10 in terms of . As evident in Fig. 5 or 6, these two locations represent respectively a diffuse region with the lowest and a bright H ii region with nearly the highest values of observed. For the 8m emission, the fractional flux contribution from the warm component varies from 15% in such a diffuse region to 63% in such a bright H ii region; for the 24m emission, this variation is 34 to 84%. This shows clearly that the current star formation dominates both PAH and 24m dust emissions in or around those bright H ii regions in M 81. In contrast, in the diffuse region considered in Table 2, this star formation component only accounts for 15% and 34% of the total flux at 8 and 24m , respectively.
4.3. Variations in
The scatter in Fig. 5 or 6 is much larger than what the statistical errors (shown in the figure) can account for. Fig. 7 demonstrates that much of this scatter is due to the variation of the factor , defined in eq. (3), by showing the image pixels in plots of the normalized or as a function of , where the normalization was done by dividing the observed ratio by the mean value given in eq. (6) or (7). For example, . Therefore, an image pixel lying above (or below) the mean fit in Fig. 5 would have the normalized ratio (or ). In Fig. 7, we showed the image pixels from both the outer disk (i.e., the black squares in the figure) and inner disk (red squares) delineated at . Again, only those image pixels with the appropriate surface brightnesses 3 times greater than their respective uncertainties are plotted here. For the outer disk data points, as [or )] increases, the normalized or ratio increases from being to . This trend contributes to much of the scatter seen in Fig. 5 or 6. If we had included the inner disk image pixels in Fig. 5 or 6, these data points would be farther above our mean fit to the outer disk data points as the inner data points have even larger values of . In principle, one can divide a galaxy disk into successive radial annuli and fit eq. (2) or (4) to individual annuli independently as long as in each annulus covers enough dynamic range to make such a fit feasible. The fit from each radial annulus, of a different average value of , should give more or less the same slope if the scaling factor “a” in eq. (2) [or “c” in eq. (4)] does not depend on the galactocentric radius. In the case of M 81, it is not feasible to make a separate two-component analysis in the inner disk which contains far fewer image pixels that are also distributed over a much larger range in (as evidenced by a larger vertical spread for the inner disk data points in Fig. 7).
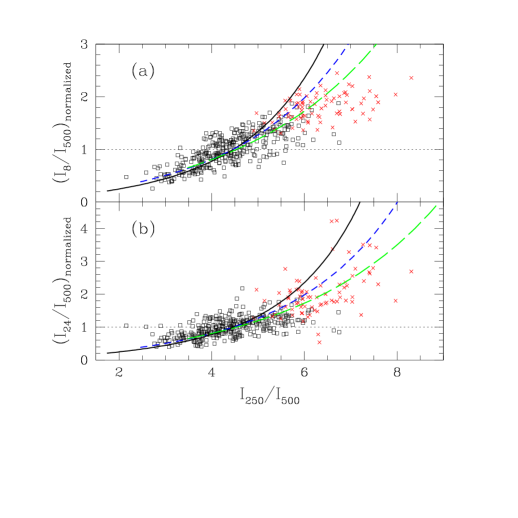
The three curves in each plot of Fig. 7 correspond to the predicted values from a Planck function modified with a dust emissivity with , 2.5 and 3, respectively. These values were simply chosen for illustration purpose although the case was favored in the SED analysis of Bendo et al. (2010). The left end of each curve corresponds to a dust temperature of 10 K. For the model, the dust temperatures are 12.6, 14.7, 17.0, 19.5, 22.5 and 26.0 K at , 4, 5, 6, 7 and 8, respectively. The similar temperature sets for the and 3 models are (10.8, 12.3, 13.7, 15.2, 16.9, 18.6 K) and (N/A, 10.5, 11.6, 12.6, 13.7, 14.7 K), respectively. All the curves are normalized to unity at .
While none of these curves can fit the data points over the entire galaxy, they do follow the trend of the data points in the outer disk, consistent with our claim that a large part of the scatter seen in Fig. 5 or 6 can be accounted for by the variation in . The inner disk data points (i.e., the crosses in Fig. 7) tend to fall below the model curves. This is not necessarily suggestive of a greater value of . As further discussed in §5, this could also be a result of a greater contamination of the [N ii] emission in our H flux within the inner disk, where a significantly higher metallicity was observed.
| Image | Total | Warm | Cold |
|---|---|---|---|
| (Jy) | (Jy) | (Jy) | |
| (1) | (2) | (3) | (4) |
| Outer diska: | |||
| 8m | 3.58 | 1.31 | 2.20 |
| 24m | 3.22 | 2.08 | 1.15 |
| H | 0.0077b | 0.0077b | 0.0 |
| 500m | 54.96 | 0.0 | 54.96 |
| Total galaxyc: | |||
| 8m | 5.03 | 1.65 | 3.38 |
| 24m | 5.01 | 2.62 | 2.39 |
| H | 0.0097b | 0.0097b | 0.0 |
| 500m | 67.07 | 0.0 | 67.07 |
4.4. Total Fluxes
We derived a total galaxy flux in each image by summing over all image pixels within , including those with a surface brightness less than 3 times the sky noise. Similarly, an integrated flux for the outer disk of was also derived. These fluxes are shown in Column (2) of Table 3. For the outer disk, eq. (6) or (7) was used to derive the 8 or 24m fluxes for the warm and cold components, given in Columns (3) and (4), respectively. The associated errors were based on the parameter uncertainties in eq. (6) or (7). Since eq. (6) or (7) was fit to this outer disk, it is not surprising that the sum of the warm and cold component fluxes in the table agrees with the measured total flux in Column (2) for either the 8 or 24m emission. These results show that, in the outer disk of M 81, of the PAH emission is not directly associated with the current star formation. For the 24m emission, this fraction is .
To derive the flux of the cold or warm dust component for the total galaxy, we also need to calculate the contribution from the inner disk/bulge region with . To this end, we assumed that the scaling constant for the warm component in eq. (6) or (7) remains valid in the inner disk/bulge region, and estimated the contribution from the current star formation to or using the observed H flux. Because of this additional assumption, the results for the inner disk region may be subject to additional systematics in the H flux as discussed in §5. We therefore listed in Table 3 the results for the outer disk separately from those for the entire galaxy. In the later case, 67% of the total PAH emission in M 81 is not directly associated with the current star formation. For the 24m emission, this fraction is 48%. Clearly, the inclusion of the inner disk and the bulge, where the surface density of evolved stars is high, reduces the overall contribution from the current star formation.
5. Assessment of Systematics
As we mentioned in §1, our analysis improved over many of the previous studies on the same subject in two areas: (a) we used a spectrally integrated flux of the cold dust emission instead of a monochromatic flux density; (b) we made no assumption on whether the 3.6m flux density is a good proxy for the dust heating from evolved stars181818The 3.6m flux density was used here to only estimate the stellar continuum at 8m . At wavelengths longer than 3.6m , the spectral shape of the stellar continuum of a normal galaxy depends little on star formation history or metallicity (Helou et al. 2004). From 8 to 24m , our simple Rayleigh-Jeans approximation of the stellar continuum should be sufficient.. Furthermore, our analysis is empirical, without prior assumption for the dust emissivity law or dust temperatures. This differs from most conventional SED analyses in the literature. On the other hand, our analysis anchored on two basic requirements and may be subject to some systematics. We discuss these two issues separately below.
As introduced in §1, our first basic requirement is that is dominated by the emission from large dust grains heated by evolved stars. This was shown to be the case in §4.1 in this paper and in Bendo et al. (2012). Furthermore, we also require that the (extinction-corrected) H flux scales linearly with the far-UV photon flux that dominates the heating of warm dust. This requirement translates to (a) a well mixed gas and dust over our spatial resolution element (36″ or 0.64 kpc) and (b) a fixed initial mass function (IMF) of the current star formation. While this remains as an assumption in principle in this paper, it is a reasonable one based on the observations that the PAH and H fluxes scale almost linearly with each other for individual H ii regions in nearby normal galaxies (e.g., Calzetti et al. 2007). Nevertheless, even if the IMF varies from one star-forming region to another, our results should remain statistically valid for the outer disk of M 81. This also holds true if the PAH-to-large dust grain abundance ratio varies across the galaxy disk.
In contrast, our analysis results may be subject to a number of potential systematics in the H flux as we already alluded to in §3.3. In the outer disk, the internal optical extinction follows gas/dust distribution and generally peaks around bright H ii regions, where the largest surface brightness of the H emission is observed. As a result, if we had applied some internal extinction correction to the H fluxes, the fit of eq. (6) or (7) to the data would be somewhat flatter, making its Y-axis intercept even greater in Fig. 5 or 6. In other words, any correction for the internal extinction on would likely result in even a greater cold component in or .
Another possible systematic issue is the elevated metallicity in the galaxy bulge. If we had taken into account the fact that the [N ii] line might be relatively brighter within the galaxy bulge, the warm component fluxes for the inner disk, thus for the total galaxy in Column (3) of Table 3, would have been somewhat overestimated. As a result, the counterpart fluxes of the cold component in Column (4) would have been underestimated accordingly.
Furthermore, a potential controversy exists regarding whether the circumnuclear H emission in M 81 is derived from current star formation (see Devereux et al. 1995). If it is not related to the ongoing star formation, the inner disk contribution to the warm dust components in Column (3) in Table 3 should be further reduced, making the overall cold dust component even more significant.
In summary, all these potential systematics in the H image can only imply that our estimates of the cold-component fractional fluxes at both 8 and 24m in Table 3, especially in the inner disk/bulge region, might be somewhat underestimated.
6. Discussion
Our correlation analysis showed that the 24m emission from VSGs is indeed a better SFR tracer than the 8m PAH emission as the former is 60% more sensitive to ionizing stars and 50% less sensitive to evolved stars than the latter, based on the slopes in eqs. (6) and (7). In fact, Table 3 shows that the 24m flux in the outer disk of M 81 is indeed modestly dominated by the current star formation. This is in agreement with the latest consensus in the literature. On the other hand, still derives nearly half of its emission from the general ISM in the case of M 81 when integrated over the galaxy surface, suggesting that even the 24m emission could arise significantly from VSGs heated by evolved stars for a galaxy as whole. The relatively large stellar mass of M 81 may play a role, as implied by studies of other early-type disk galaxies (e.g., Sauvage & Thuan 1992; Engelbracht et al. 2010). Tabatabaei & Berkhuijsen (2010) reached a similar conclusion on the heating source for the 24 µm emission in M 31, another nearby IR-quiescent disk galaxy.
It is interesting to compare our M 81 results with the statistical results from analyzing a sample of IRAS galaxies in Lu & Helou (2008). Their statistical conclusion is that, for galaxies with quiescent FIR colors similar to M 81, most of the PAH emission should be from the cold component, in agreement with the results in the current paper. Furthermore, Lu & Helou (2008) showed that the fraction of the PAH luminosity that is directly correlated with current star formation increases on average as FIR color increases. In contrast, Kennicutt et al. (2009) showed that nature may present us with a constant fractional warm PAH or 8m dust emission over a variety of galaxies with FIR colors from 0.3 to 1, morphological types of S0 or later, and total IR luminosities as high as . With a FIR color of 0.26, M 81 is at the cold end of the color range occupied by the galaxies used in Kennicutt et al. (2009). It is therefore of great interest to apply the same two-component analysis from this paper to additional galaxies of warmer FIR colors.
Many starburst dwarf galaxies show a depressed PAH emission (e.g., Engelbracht et al. 2005; Hogg et al. 2005). The reason could be either intrinsic, i.e., a low carbon-based PAH abundance relative to silicon-based large dust grains (e.g., Galliano et al. 2008) or extrinsic, e.g., via PAH destruction by hard UV or supernova shocks associated with massive stars (e.g., Madden et al. 2006; O’Halloran et al. 2006; Engelbracht et al. 2008). While the latter explanation is more widely accepted today, the former has not been convincingly ruled out. It is difficult to differentiate these two scenarios observationally because the IR emission in star-forming dwarf galaxies is always dominated by their high surface brightness H ii regions. The methods laid out in this paper could in principle be used to differentiate these two scenarios: The mean slope in eq. (1) could vary from galaxy to galaxy because (i) dust mass spectrum may vary (e.g., via metallicity change) or/and (ii) PAH may be destroyed to various degrees (as the hardness of UV radiation field may vary). In contrast, the mean value of in eq. (1) should depend only on (i). It is therefore possible to compare statistically samples of dwarfs and normal spirals to see if there is a meaningful difference in the fitted parameter between the two galaxy classes. Such an analysis is now feasible with Herschel SPIRE data of many low-metallicity dwarf galaxies (Madden et al. 2013).
7. Conclusion
Using the newly available Herschel images at 250 and 500m and the existing Spitzer images at 8 and 24m and ground-based H image, we demonstrated a new, two-component correlation analysis method that is applicable to galaxy images of any angular resolution and takes into consideration the frequency-integrated spectrum of the cold dust emission.
Using this method, we showed that, in the case of M 81, the surface brightnesses of both the 8m emission from PAHs and the 24m emission from VSGs can be quantitatively decomposed into two components, free from any model-dependent assumption: (a) a component that scales with the surface brightness of the H line emission, which is a well known tracer of current star formation rate; and (b) a component that scales with the surface brightness of the cold, diffuse dust emission at 500m , which is known to be heated primarily by evolved stars. Roughly, the cold components constitute about 67% and 48% of the observed 8 and 24m emissions, respectively.
We argued that these estimates on the fractional cold dust component likely represents a lower limit if any of the following uncorrected systematics in our H image is significant: patchiness in the internal extinction, non-stellar origin of the nuclear H emission, and an elevated [N ii] contamination to the H line flux within the galaxy bulge.
References
- (1) Allamandola, L. J., Tielens, A. G. G. M., & Barker, J. R. 1989, ApJS, 71, 733
- (2) Bendo, G. J., Boselli, A., Dariush, A., et al. 2012, MNRAS, 419, 1833
- (3) Bendo, G. J., Draine, B. T., Engelbracht, C. W., et al. 2008, MNRAS, 389, 629
- (4) Bendo, G. J., Joseph, R. D., Wells, M., et al. 2003, AJ, 125, 2361
- (5) Bendo, G. J., Wilson, C. D., Pohlen, M., et al. 2010, A&A, 518, L65
- (6) Boquien, M., Calzetti, D., Combes, F., et al. 2011, AJ, 142, 111
- (7) Boselli, A., & Gavazzi, G. 2002, A&A, 386, 124
- (8) Boulanger, F., Beichman, C., Désert, F. X., Helou, G., Pérault, M., & Ryter, C. 1988, ApJ, 332, 328
- (9) Calapa, M. D., Calzetti, D., Draine, B. T., et al. 2014, ApJ, 784, 130
- (10) Calzetti, D., Kennicutt, R. C., Engelbracht, C. W., et al. 2007, ApJ, 666, 870
- (11) Castelaz, M. W., Sellgren, K., Werner, M. W. 1987, ApJ, 313, 853
- (12) Chan, K.-W., Roellig, T. L., Onaka, T., et al. 2001, ApJ, 546, 273
- (13) Crocker, A. F., Calzetti, D., Thilker, D. A., et al. 2013, ApJ, 762, 79
- (14) Davies, J. I., Wilson, C. D., Auld, R., et al. 2010, MNRAS, 409, L102
- (15) de Blok, W. J. G., Walter, F., Brinks, E., et al. 2008, AJ, 136, 2648
- (16) de Vaucouleurs, G., de Vaucouleurs, A., Corwin Jr, H. G., Buta, R. J., Paturel, G., & Fouque, P. 1991, Third Reference Catalog of Bright Galaxies (New York: Springer)
- (17) Désert, F. X., Boulanger, F., & Puget, J. L. 1990, A&A, 237, 215
- (18) Devereux, N. A., Jacoby, G., & Giardullo, R. 1995, AJ, 110, 1115
- (19) Draine, B. T., & Li, A. 2007, ApJ, 657, 810
- (20) Dwek, E., Arendt, R. G., Fixsen, D. J., et al. 1997, ApJ, 475, 565
- (21) Engelbracht, C. W., Gordon, K. D., Rieke, G. H., et al. 2005, ApJ, 628, L29
- (22) Engelbracht, C. W., Hunt, L. K., Skibba, R. A., et al. 2010, A&A, 518, L56
- (23) Engelbracht, C. W., Rieke, G. H., Gordon, K. D., et al. 2008, ApJ, 678, 804
- (24) Ferguson, A. M. N., Wyse, R. F. G., Gallagher, J. S., III, & Hunter, D. A. 1996, AJ, 111, 2265
- (25) Förster Schreiber, N. M., Roussel, H., Sauvage, M., & Charmandaris, V. 2004, A&A, 419, 501
- (26) Galliano, F., Dwek, E., & Chanial, P. 2008, ApJ, 672, 214
- (27) Garnett, D. R., & Shields, G. A. 1987, ApJ, 317, 82
- (28) Gordon, K. D., Engelbracht, C. W., Rieke, G. H., et al. 2008, ApJ, 682, 336
- (29) Greenawalt, B., Walterbos, R. A. M., Thilker, D., & Hoopes, C. G. 1998, ApJ, 506, 135
- (30) Griffin, M., J., Abergel, A., Abreu, A., et al. 2010, A&A, 518, L3
- (31) Haas, M., Klaas, U., & Bianchi, S. 2002, A&A, 385, L23
- (32) Haffner, L. M., Dettmar, R.-J., Beckman, J. E., et al. 2009, Rev. Mod. Phys., 81, 696
- (33) Hechman, T. M. 1980, A&A, 87, 152
- (34) Helou, G., Roussel, H., Appleton, P., et al. 2004, ApJS, 154, 253
- (35) Hogg, D. W., Tremonti, C. A., Blanton, M. R., 2005, ApJ, 624, 162
- (36) Hoopes, C. G., Walterbos, R. A. M., & Bothun, G. D. 2001, ApJ, 559, 878
- (37) Irwin, J. A., & Madden, S. C. 2006, A&A, 445, 123
- (38) Jones, A. G., Bendo, G. J., Fritz, J., et al. 2014, submitted to MNRAS
- (39) Karachentsev, I. D., Dolphin, A. E., Geisler, D., et al. 2002, A&A, 383, 125
- (40) Kaufman, M., Elmegreen, D. M., & Bash, F. N. 1989, ApJ, 345, 697
- (41) Kennicutt, R. C. 1998, ApJ, 498, 541
- (42) Kennicutt, R. C., Armus, L., Bendo, G., et al. 2003, PASP, 115, 928
- (43) Kennicutt, R. C., Hao, C.-N., Calzetti, D., et al. 2009, ApJ, 703, 1672
- (44) Lemke, D., Mattila, K., Lehtinen, K., et al. 1998, A&A, 331, 742
- (45) Lu, N. 2004, ApJS, 154, 286
- (46) Lu, N., Helou, G., Werner, M., et al. 2003, ApJ, 588, 199
- (47) Lu, N., & Helou, G. 2008, in ASP Conf. Ser. 381, Infrared Diagnostics of Galaxy Evolution, ed. R.-R. Chary, H. I. Teplitz & K. Sheth (San Francisco: ASP), 46
- (48) Madden, S. C., Galliano, F., Jones, A. P., & Sauvage, M. 2006, A&A, 446, 877
- (49) Madden, S. C., Rémy-Ruyer, A., Galametz, M., et al. 2013, PASP, 125, 600
- (50) Mathis, J. S. 1986, ApJ, 301, 423
- (51) Mattila, K., Juvela, M., & Lehtinen, K. 2007, ApJ, 654, L131
- (52) Mentuch, E., Abraham, R. G, & Zibetti, S. 2010, ApJ, 725, 1971
- (53) O’Halloran, B., Satyapal, S., & Dudik, R. P. 2006, ApJ, 641, 795
- (54) Perelmuter, J.-M., & Racine, R. 1995, AJ, 109, 1055
- (55) Pilbratt, G., Riedinger, J. R., Passvogel, T., et al. 2010, A&A, 518, L1
- (56) Puget, J. L., & Léger, A. 1989, ARA&A, 27, 161
- (57) Reynolds, R. J. 1991, in IAU Symp. 144, The Interstellar Disk Halo Connection in Galaxies, ed. H. Bloemen (Dordrecht: Kluwer), 67
- (58) Rice, W., Lonsdale, C. J., Soifer, B. T., et al. 1988, ApJS, 68, 91
- (59) Roussel, H., Sauvage, M., Vigroux, L., & Bosma, A. 2001, A&A, 372, 427
- (60) Sánchez-Gallego, J. R., Knapen, J. H., Wilson, C. D., Barmby, P., Azimlu, M., & Courteau, S. 2012, MNRAS, 422, 3208
- (61) Schmidt, M. 1959,ApJ, 129, 243
- (62) Sauvage,M., & Thuan, T. X. 1992, ApJ, 396, 69
- (63) Schroder, L. L., Brodie, J. P., Kissler-Patig, M., Huchra, J. P., & Phillips, A. C. 2002, AJ, 123, 2473
- (64) Tabatabaei, F. S., & Berkhuijsen, E. M. 2010, A&A, 517, 77
- (65) Uchida, K. I., Sellgren, K., & Werner, M. 1998, ApJ, 493, L109
- (66) Walterbos, R. A. M., & Braun, R. 1994, ApJ, 431, 156
- (67) Willner, S. P., Ashby, M. L. N., Barmby, P., et al. 2004, ApJS, 154, 222
- (68) Witt, A. N., Gold, B., Barnes, F. S., III, et al. 2010, ApJ, 724, 1551
- (69) Wood, K., & Reynolds, R. J. 1999, ApJ, 525, 799
- (70) Wu, H., Cao, C., Hao, C.-N., et al. 2005, ApJ, 632, L79
- (71) Xilouris, E. M., Tabatabaei, F. S., Boquien, M., et al. 2012, A&A, 543, 74
- (72) Zhu, Y.-N., Wu, H., Cao, C., & Li, H.-N. 2008, ApJ, 686, 155