Expansion of hydrogen-poor knots in the Born-Again Planetary Nebulae A30 and A78∗∗\ast∗∗\astBased on observations made with the NASA/ESA Hubble Space Telescope, obtained at the Space Telescope Science Institute, which is operated by the Association of Universities for Research in Astronomy, Inc., under NASA contract NAS 5-26555. These observations are associated with program #12935.
Abstract
We analyze the expansion of hydrogen-poor knots and filaments in the born-again planetary nebulae A30 and A78 based on Hubble Space Telescope (HST) images obtained almost 20 yr apart. The proper motion of these features generally increases with distance to the central star, but the fractional expansion decreases, i.e., the expansion is not homologous. As a result, there is not a unique expansion age, which is estimated to be 610–950 yr for A30 and 600–1140 yr for A78. The knots and filaments have experienced complex dynamical processes: the current fast stellar wind is mass loaded by the material ablated from the inner knots; the ablated material is then swept up until it shocks the inner edges of the outer, hydrogen-rich nebula. The angular expansion of the outer filaments shows a clear dependence on position angle, indicating that the interaction of the stellar wind with the innermost knots channels the wind along preferred directions. The apparent angular expansion of the innermost knots seems to be dominated by the rocket effect of evaporating gas and by the propagation of the ionization front inside them. Radiation-hydrodynamical simulations show that a single ejection of material followed by a rapid onset of the stellar wind and ionizing flux can reproduce the variety of clumps and filaments at different distances from the central star found in A30 and A78.
Subject headings:
ISM: kinematics and dynamics – planetary nebulae: individual (A30 and A78)1. Introduction
Born-again planetary nebulae (PNe) are believed to have experienced a very late thermal pulse (VLTP; Iben et al., 1983) while the star was descending the white dwarf cooling track. During this event, the remnant stellar helium envelope reaches the critical mass to ignite its fusion into carbon and oxygen (e.g., Herwig, 2005; Miller Bertolami & Althaus, 2006; Lawlor & MacDonald, 2006); the sudden increase of pressure leads to the ejection of the newly processed material and, as the stellar envelope expands, its temperature decreases and the star returns in the Hertzsprung-Russell (HR) diagram to the locus of the asymptotic giant branch (AGB) stars. Soon after, the contraction of the envelope will increase the stellar effective temperature, boosting the UV flux and giving rise to a new fast stellar wind.
So far, the only bona-fide born-again PNe are Abell 30 (aka A30), Abell 58 (aka A58, Nova Aql 1919,), Abell 78 (aka A78), and V4334 Sgr (aka Sakurai’s object). Among them, A30 and A78 are the more evolved ones, with large limb-brightened, H-rich outer nebulae surrounding the H-poor, irregular-shaped structures that harbour the “cometary” knots in the innermost regions (Jacoby, 1979; Meaburn & López, 1996; Meaburn et al., 1998). Detailed Hubble Space Telescope (HST) images in the [O iii] emission line of the central regions have revealed equatorial rings and compact polar outflows in the central regions of both PNe (Borkowski et al., 1993, 1995). The dynamics are revealing: while the outer nebulae show shell-like expansions with velocities of 30–40 km s-1, the H-poor clumps present complex structures, with velocity spikes 200 km s-1 (Meaburn & López, 1996; Chu et al., 1997; Meaburn et al., 1998).
The morphology and kinematics of the H-poor knots unveil rich dynamical processes in the nebulae. The material photoevaporated from the knots by the stellar radiation is swept up downstream by the fast stellar wind, which is otherwise mass loaded and slowed down (Pittard et al., 2005). The interactions are complex, resulting in sophisticated velocity structures (e.g., Steffen & López, 2004), as well as X-ray-emitting hot gas (Chu & Ho, 1995; Guerrero et al., 2012; Toalá et al., 2014).
To gain further insights into the dynamics of the H-poor knots and filaments in A30 and A78, we study their proper motions using HST images taken 20 yr apart. These observations and the data analysis are described in Section 2. The results are presented in Section 3. In Section 4 we discuss our findings and present basic radiation-hydrodynamic simulations. Finally, we present our conclusions in Section 5.
2. Observations and Data Analysis
New HST WFC3 F502N narrowband images of A30 and A78 (PI: M.A. Guerrero, Prop. ID 12935) were obtained on 2013 March 21 and 2012 November 22, respectively. The images were reduced following standard pipeline procedures. The first-epoch HST WFPC2 F502N narrowband images of A30 and A78 (PI: J.P. Harrington, Prop. ID 5404 and 5864) were downloaded from MAST111URL, http://archive.stsci.edu, the Mikulski Archive for Space Telescope at the Space Telescope Science Institute. These images were obtained on 1994 March 6 and 1995 July 11, respectively. Thus the time-lapse between the two epochs is 19.04 yr for A30 and 17.36 yr for A78. The properties of the HST WFC3 and WFPC2 images of A30 and A78 are summarized in Table 1. Basically, both the new WFC3 and archival WFPC2 images map exclusively the [O iii] emission line. The main differences arise from the pixel scale, which is similar for WFC3-UVIS and WFPC2-PC, but 2.5 times larger for WFPC2-WF than for WFC3-UVIS.
| Instrument | Camera | Pixel Size | Date | Filter | ||
| Name | Bandwidth | |||||
| (Å) | (Å) | |||||
| A30 | ||||||
| WFPC2 | PC/WF | 00454/00996 | March 6, 1994 | F502N | 5013 | 27 |
| WFC3 | UVIS | 00396 | March 21, 2013 | F502N | 5010 | 65 |
| A78 | ||||||
| WFPC2 | PC/WF | 00454/00996 | July 11, 1995 | F502N | 5013 | 27 |
| WFC3 | UVIS | 00396 | November 22, 2012 | F502N | 5010 | 65 |
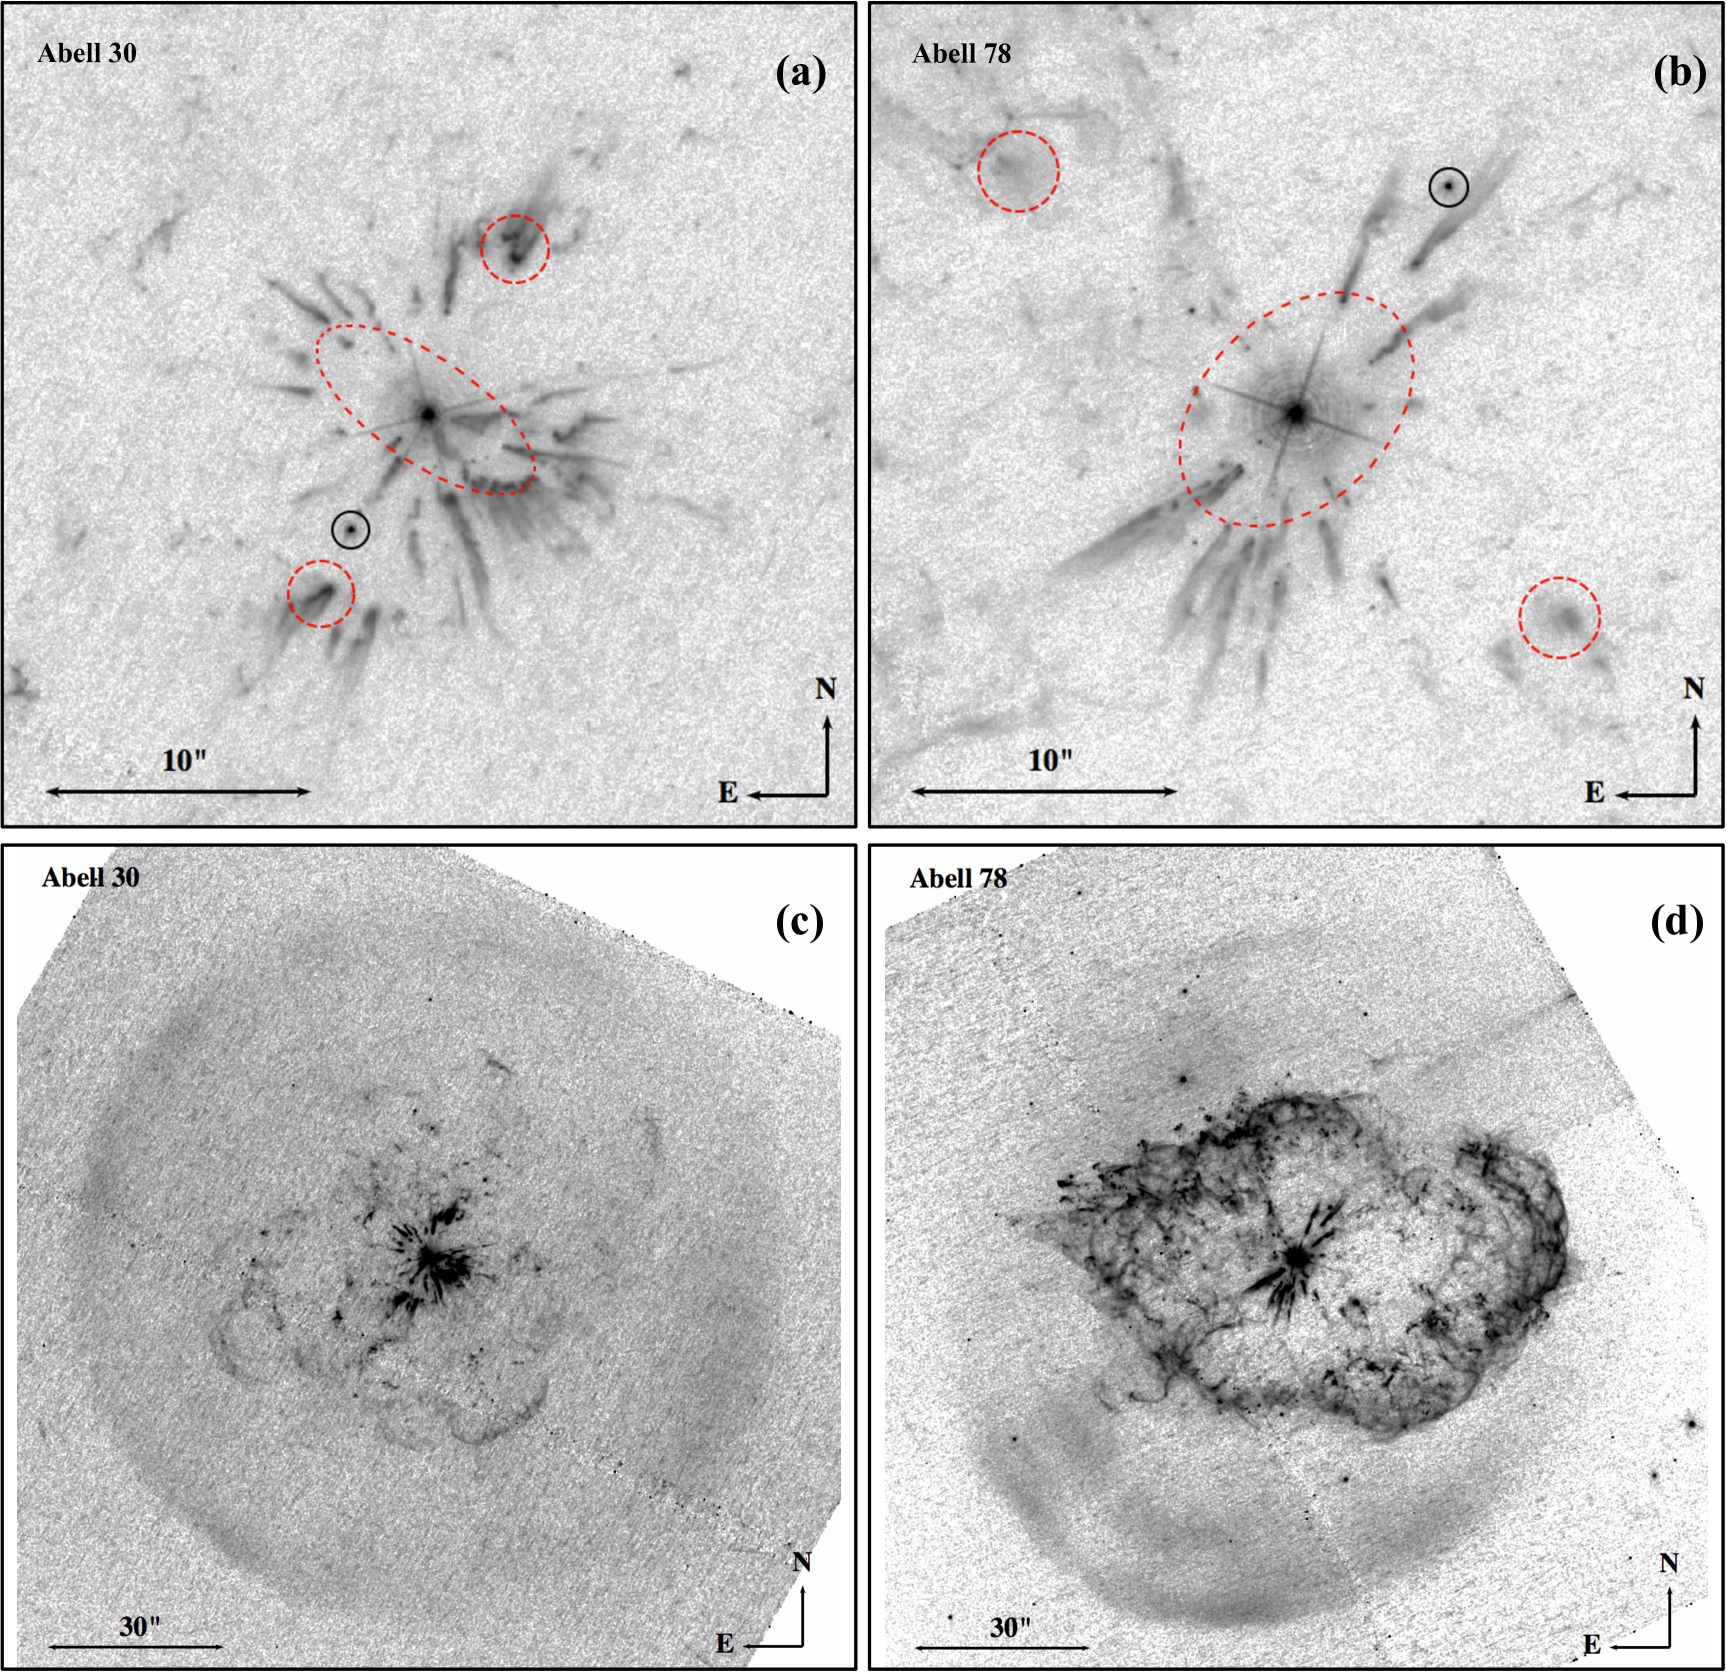
The new HST WFC3 images of A30 and A78 are presented in Figure 1, where their inner regions are shown in the top panels and the complete view of the nebulae in the bottom panels. These new images confirm the morphological features detected in previous HST imagery (Borkowski et al., 1993, 1995): a series of compact knots with cometary tails pointing away from the central stars (CSPNe) are surrounded by the outer filamentary irregular (petal-like) structures. The inner H-poor knots are mostly located on the equatorial disks (red dashed ellipses in the top panels of Figure 1) and bipolar regions (red dashed circles in Figure 1). The petal-like structures of A30 and intermediate spindle-shaped shell of A78 are completely mapped by these images. The round and oval-shaped outer shells of A30 and A78, respectively, are also registered by these HST WFC3 images.
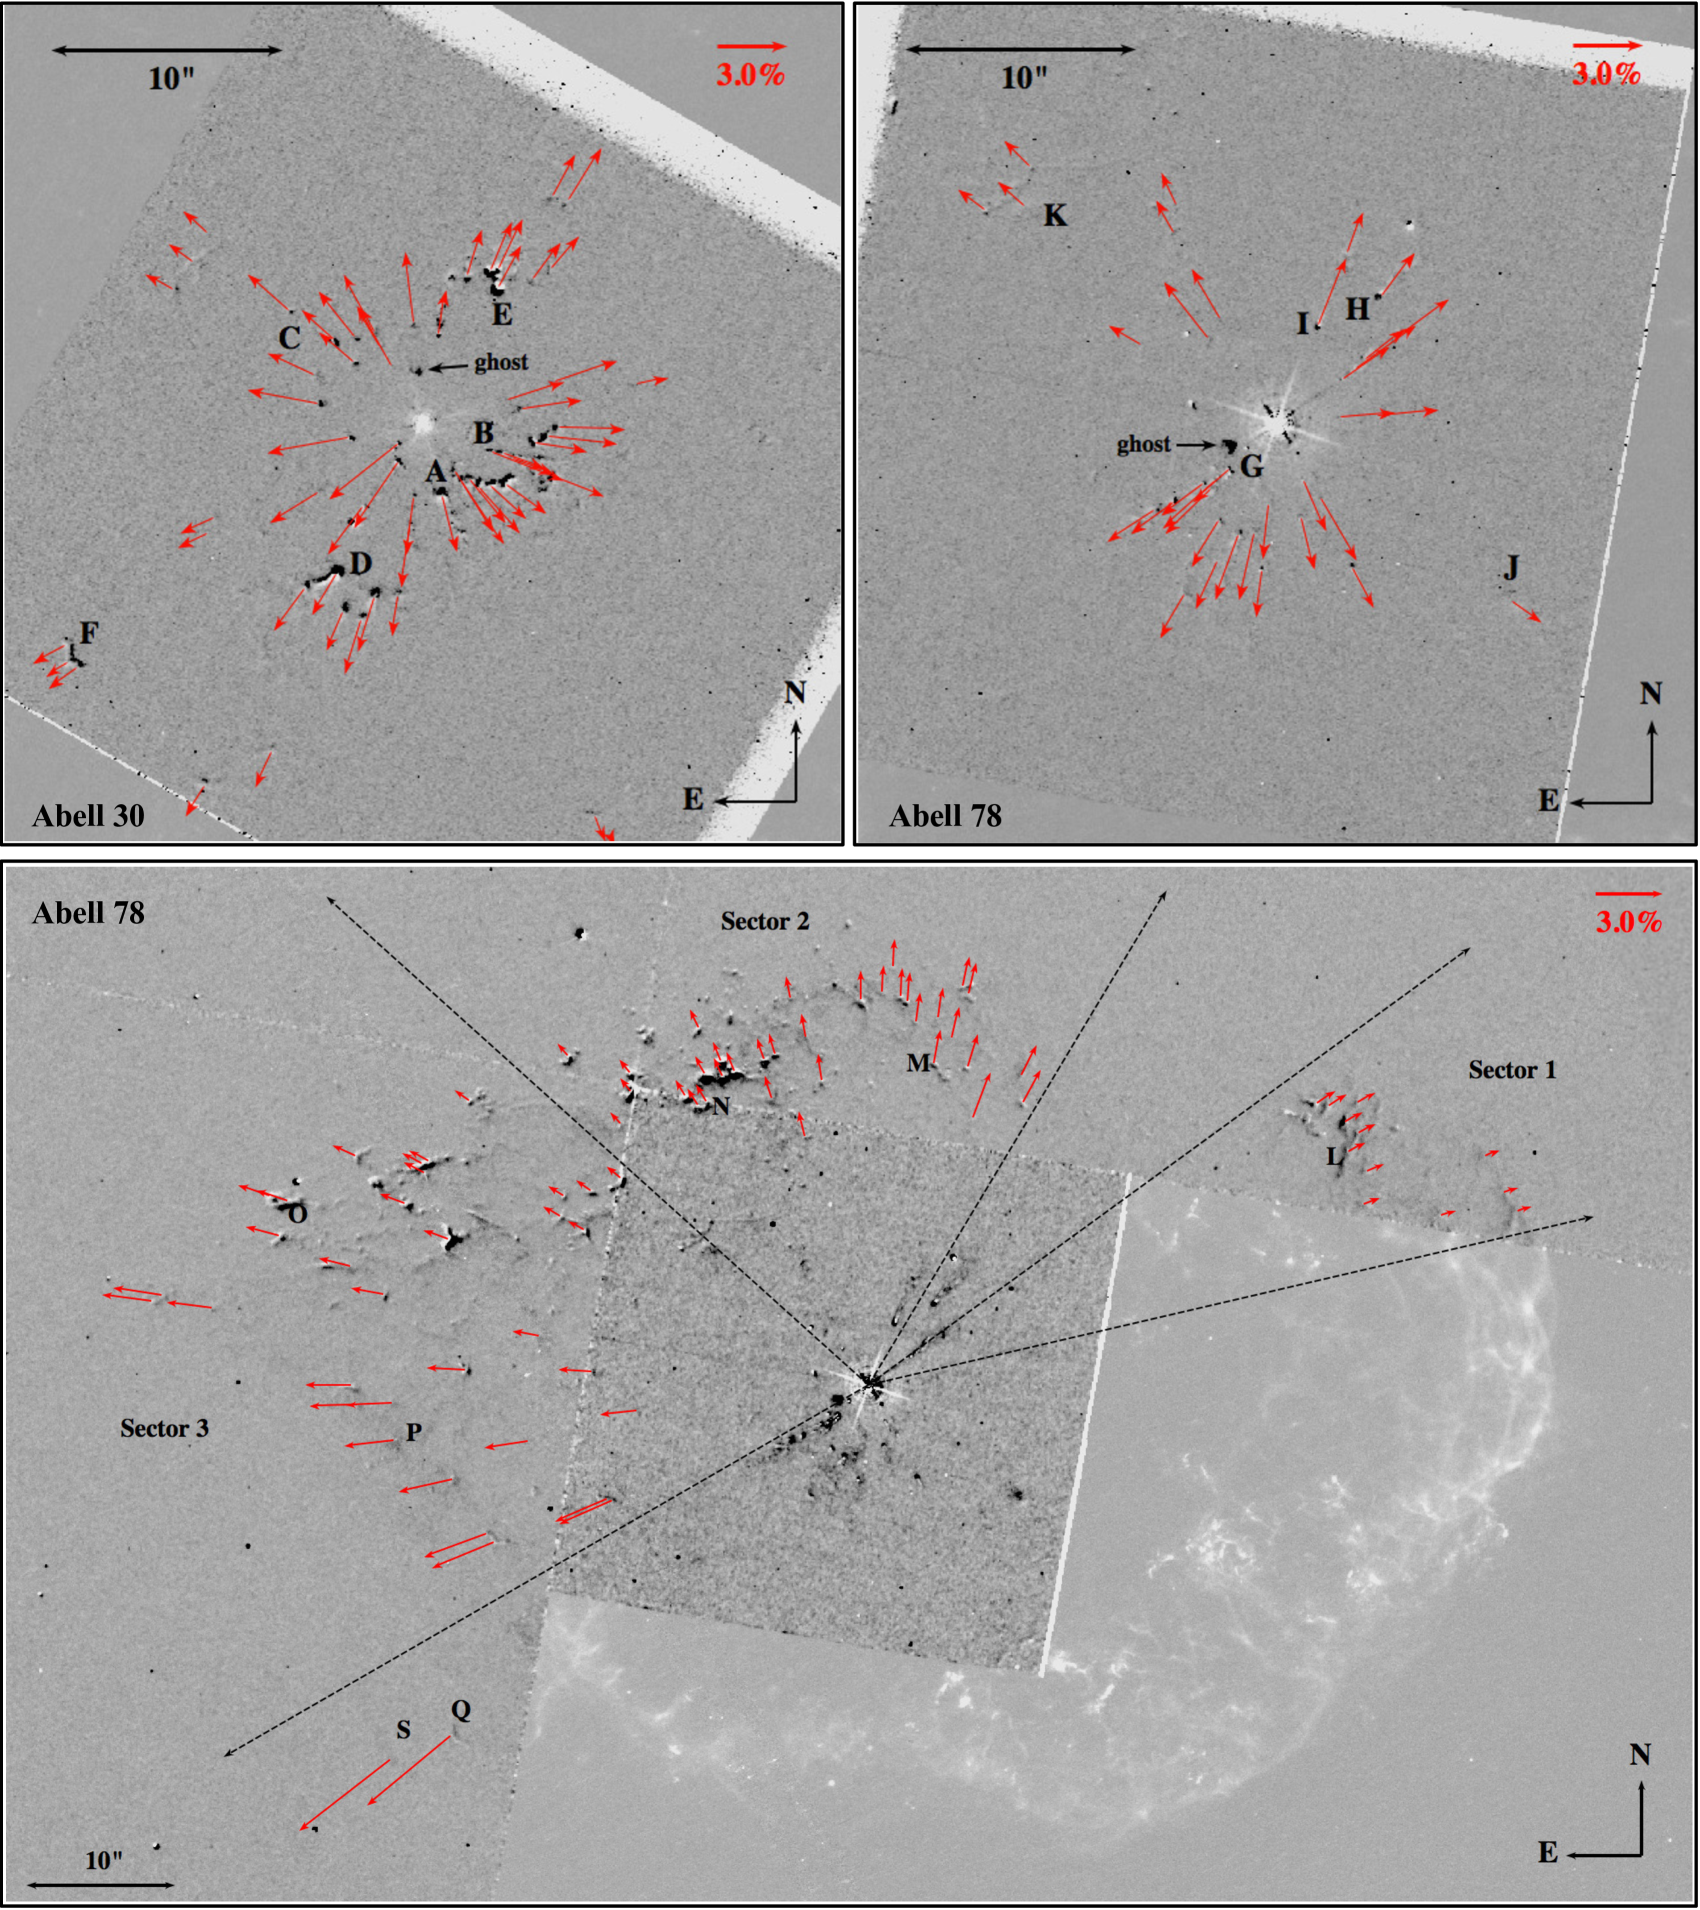
In order to investigate the proper motions of the knots and filaments in A30 and A78, we have compared the images obtained at the two epochs. The WFC3 and WFPC2 images were first carefully aligned along the sky coordinates with the pixel scale of the WFPC2 cameras rebinned to that of the WFC3 camera using standard iraf222iraf is distributed by the National Optical Astronomy Observatory, which is operated by the Association of Universities for Research in Astronomy, Inc., under cooperative agreement with the National Science Foundation. routines. Then the background emission was subtracted by adopting a count level computed from regions outside the outer nebulae. The images were then scaled to the same level using the count peaks of the brightest and more compact knots, and subsequently subtracted. The residual images in Figure 2 clearly show the expansion of the innermost H-poor knots and irregular outer filaments. A typical angular expansion of 01 was found for the knots in the innermost regions, and up to 1″ for the features in the outermost regions. As in Reed et al. (1999), Guerrero et al. (2012), or O’Dell et al. (2013), the older WFPC2 images were magnified and subtracted from the most recent WFC3 images. By inspecting the residual images, we found that there is not a unique magnifying factor for the different features.
It is pertinent to estimate whether geometric distortion affects our analysis of the HST WFC3 and WFPC2 images. The WFC3 UVIS detector is not strictly aligned with the optical axis of the telescope, which contributes a linear distortion. Moreover, the plate scale varies across the detector, adding a non-linear distortion component which is maximal at the corners of the detector. Both components are corrected by the HST standard WFC3 pipeline, with a typical accuracy of 0.1 pixels, i.e., 4 mas, at the detector edges and much smaller in the central regions according to the WFC3 Data Handbook333URL, http://www.stsci.edu/hst/wfc3/documents/handbooks. As for the WFPC2 images, the current geometric distortion correction procedures remove most of the linear distortion and essentially all non-linear distortion according to the WFPC2 Data Handbook444URL, http://www.stsci.edu/hst/wfpc2/documents/handbook. Therefore, the largest uncertainties in the geometric correction at the detector edges, 4 mas, are still smaller than the typical angular expansions (100 mas) detected in the central regions of the residual images of A30 and A78. Inspection of field stars in the residual images further confirms there are no significant systematic deviations in their positions. We are thus confident that geometric distortions of the images do not substantially affect the results presented in this paper. The only noticeable effect is a well known ghost that affects the WFPC2 images which is marked in Figure 2.
To quantify the expansion of the different structural components of A30 and A78, we measured the radial angular distances of the knots and filaments in the WFPC2 () and WFC3 () images. About 60 features were analyzed in A30, including 50 in the central region (15″), and 104 knots and filaments in A78, including 30 in the central region (13″). The petal-like structure of A30 is in nature fainter than that of A78 and is only partially covered by the WFPC2 camera, thus its expansion can not be accurately assessed.
The angular expansion () and the velocity component on the plane of the sky of the different features, computed as
| (1) |
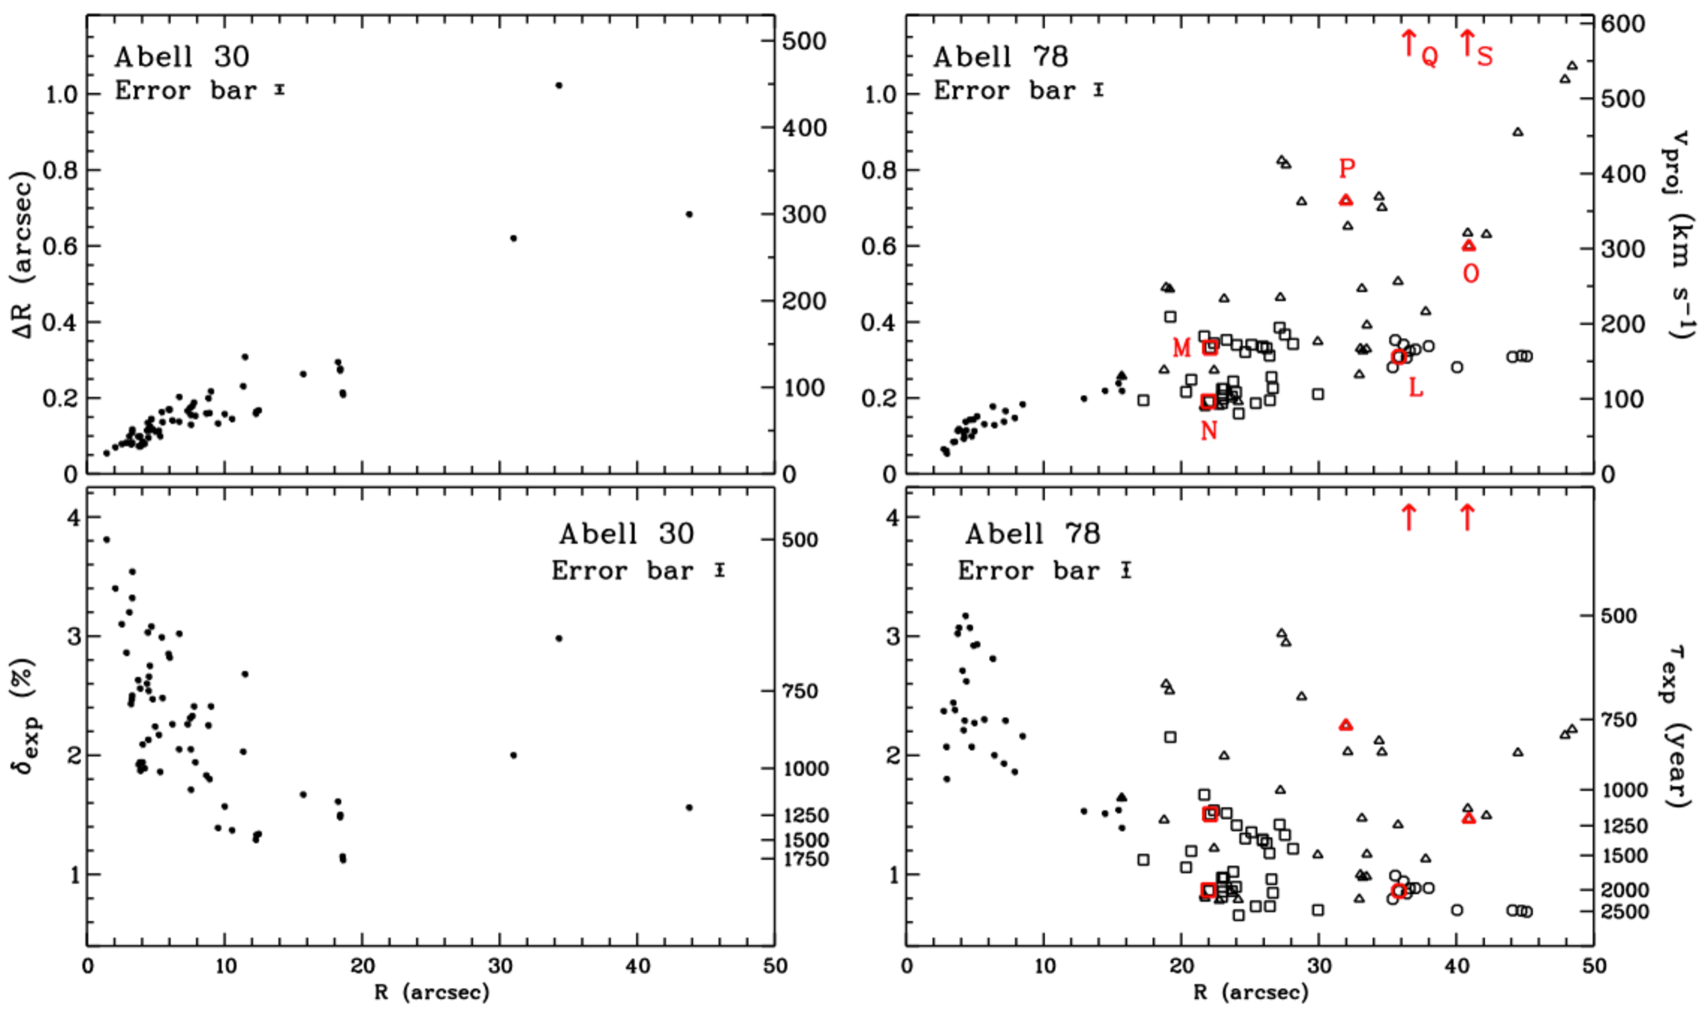
are plotted against the radial distance in Figure 3-top, assuming a distance =1.8 kpc for A30 (as adopted by Guerrero et al., 2012) and 1.4 kpc for A78 (Toalá et al., 2014), and a time-lapse between the two observations =19.04 yr for A30 and 17.36 yr for A78. These plots clearly illustrate a general trend that the angular expansion increases with radial distance. There is not, however, a tight linear correlation, as is apparent from the scatter seen for the outer knots and filaments. The fractional expansion is computed as
| (2) |
which is equivalent to the ratio between the current and the average expansion velocities and is independent of the inclination of motion with respect to the line of sight. The values of of the knots and filaments are shown in Figure 2 by arrows. Expansion of the southwest outer region of A78 was not studied because this quadrant was not covered by the WFPC2 camera. The apparent expansion ages were estimated by
| (3) |
The distributions of and with radial distance are shown in the lower panels of Figure 3.
3. Results
3.1. General Expansion
The distributions of , , , and shown in Figure 3 confirm a non-homologous expansion for the knots and filaments of A30 and A78. The innermost knots show an increase in angular expansion with radial distance (Figure 3-top) that tends to flatten out as the radial distance increases. Correspondingly, the fractional expansion decreases and the expansion age increases with radial distance (Figure 3-bottom). The outer knots and filaments show a large dispersion, but in general confirm the flattening of the angular expansion with radial distance.
The proper motions (), , and of some prominent features marked in Figure 2 are listed in Table 2. Overall, the features in the equatorial rings (ERs) have larger than the polar outflows (POs), and both ER and PO features have larger than the few filamentary features within 20″ of the CSPNe (e.g., feature “F” in Table 2). The statistics of all features implies an averaged of 2.60.5% for the ER of A30, 2.10.1% for its PO, and only 1.60.5% for the filamentary features. Similarly, the ER and PO of A78 have averaged of 2.50.4% and 1.5%, respectively.
| IDaa The knot ID is labeled in Figure 2. | Featurebb ER=equatorial ring, PO=polar outflow, OF=outer filament. | |||||
| (mas yr-1) | (%) | (yr) | ||||
| A30 | ||||||
| A | ER | 3206 | 3286 | 4.20 | 2.50 | 780 |
| B | ER | 3178 | 3284 | 5.57 | 3.32 | 590 |
| C | ER | 5218 | 5315 | 5.09 | 1.86 | 1020 |
| D | PO | 7385 | 7536 | 7.93 | 2.05 | 940 |
| E | PO | 6569 | 6702 | 6.99 | 2.02 | 950 |
| F | OF | 17955 | 18245 | 15.23 | 1.61 | 1200 |
| A78 | ||||||
| G | ER | 2872 | 2931 | 3.40 | 2.07 | 850 |
| H | ER | 7058 | 7220 | 9.33 | 2.29 | 780 |
| I | ER | 4498 | 4636 | 7.95 | 3.07 | 600 |
| J | PO | 12734 | 12929 | 11.23 | 1.53 | 1150 |
| K | PO | 14244 | 14459 | 12.38 | 1.51 | 1160 |
| L | OF | 36315 | 36608 | 16.88 | 0.88 | 1960 |
| M | OF | 21820 | 22103 | 16.30 | 1.50 | 1150 |
| N | OF | 21797 | 21986 | 10.89 | 0.87 | 1990 |
| O | OF | 40323 | 40914 | 34.04 | 1.46 | 1180 |
| P | OF | 31277 | 31980 | 40.49 | 2.25 | 770 |
| Q | OF | 34867 | 36568 | 97.98 | 4.88 | 360 |
| S | OF | 38799 | 40814 | 116.10 | 5.19 | 330 |
As for the outermost filaments, there is only useful information for those of A78. Inspection of the variation of with position angle (PA) reveals a notable correlation as shown in Figure 4. We have used this plot to define three sectors in the outer region of A78, as shown in Figure 2-bottom. Actually, these sectors can be associated with three different morphological features of the spindle-shaped inner shell of A78: sector 1 with the westernmost spindle-bottom, sector 2 with a northern blister, and sector 3 with the easternmost arrow-shaped spindle-top. The spread of with radial distance in Figure 3-right is then clarified, as it is shown in Figure 4 that the features in each sector follow different trends. We note that there is a gap between sectors 1 and 2 (from PA 54 to 30) in Figure 4, as the filaments and knots in that region are very diffuse and extremely faint. After image subtraction (WFC3 WFPC2), we could not find any obvious features in that region of the residual image (see Figure 2-bottom). Figure 1-bottom-right has been scaled to enhance these features. We found that there is no obvious correlation between and the PA for the inner knots of A30 and A78, as will be discussed in Section 3.2
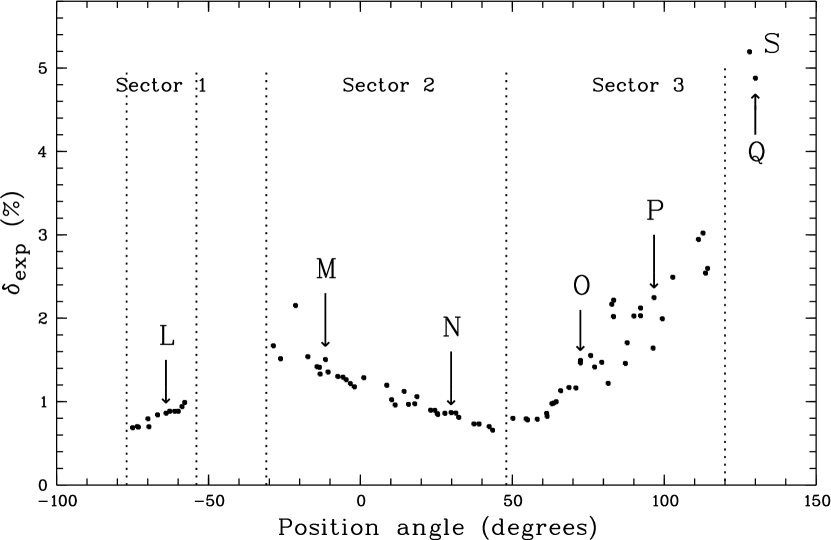
The large variation of with position angle reveal the anisotropic expansion of the spindle-shaped shell in A78. It is interesting to note some features in sector 3 of A78 with large (the triangle symbols in Figure 3-bottom-right). Some of them have the appearance of compact knots (e.g., feature “O” in Figure 2-bottom) and bow-shock structures, suggesting that they are probably coasting away ballistically and have not been slowed down by the outer nebular shell yet. Very remarkably, the filamentary features “Q” and “S” have fractional expansions 5% (Table 2) that imply projected velocities on the plane of the sky 600 km s-1. These are among the highest expansion velocities associated with collimated outflows in PNe (Guerrero et al., 2002), such as the knotty outflow with velocities over 500 km s-1 of the young PN MyCn 18 (Bryce et al., 1997).
The polar outflows of A30 and A78 show intermediate values of . In general, they follow the trend from high for the equatorial knots to low for the outer filaments. The polar outflows of A30, closer to the equatorial knots, have values similar to the equatorial values, whereas the polar outflows of A78, farther from the equatorial knots, are more like the outer filamentary features along the first half of sector 2. This may imply that the bipolar outflows slow down as they travel away, similar to those found in NGC 6543 (Reed et al., 1999).
3.2. 3D Kinematics of the Inner H-poor Knots
The mean velocity projected on the plane of the sky of the polar knots measured from the two epochs of observations is 62 km s-1 for A30 and 78 km s-1 for A78 (see Eq. 1). Meanwhile, the spatio-kinematical study of Meaburn & López (1996) reveals a systemic radial velocity for the A30 Northern polar knot (i.e., the knot J3; Jacoby, 1979) of 28 km s-1, which is generally consistent with the measurements of Chu et al. (1997). Similarly, Meaburn et al. (1998) derived a systemic radial velocity of 98 km s-1 for the Southern polar knot of A78. These results are summarized in Table 3, together with the velocity modulus () and inclination angle () of the velocity vector of the polar outflows with respect to the line of sight.
As for the equatorial rings, the averaged values of imply expansion velocities of 56 km s-1 for A30 and 30 km s-1 for A78 (Table 3). Assuming the equatorial rings to be circular and the polar outflows perpendicular to them, the newly derived inclination angles imply ellipses with the minor-to-major axis ratios of 0.4 for A30 and 0.7 for A78. While the axis ratio seems to fit the overall spatial distribution of the knots at the equatorial ring of A78, it seems inconsistent for A30. Either the polar outflows of A30 do not move perpendicular to its equatorial ring, or the latter does not expand isotropically in a plane.
Since a circular, two-dimensional (2D) and homogeneously-expanding ring would produce a characteristic signature in the azimuthal variation of , whereas would remain constant, we have analyzed these quantities for knots in the equatorial ring of A30 and in that of A78. It turns out that the variations of and do not seem to depend on the azimuthal angle. Indeed, the knots along the same direction from the CSPN show noticeable discrepancy in the values of , which is in contrast with what we originally expected, i.e., should be clearly correlated with radial distance from the CSPN. We conclude that the apparent expansion of individual knots does not fulfill the expectations for an equatorial ring expanding as a whole. The geometry (non-planar distribution of knots) or dynamics (non-circular expansion and/or radial-dependent acceleration) of the inner knots may be not that simple as assumed for a circular, 2D expanding ring.
4. Discussion
If the knots and filaments of A30 or A78 were ejected in a single event and have moved ballistically since then, without further interactions, then all the knots should have similar and . The observational evidence for a non-linear correlation of the expansion with radial distance suggests that the actual dynamics is far from simple.
There are two plausible dynamical origins for the H-poor knots. The first one is that the knots were ejected from the star during the born-again event or along its return to the AGB, in which case they could be expected to have high initial velocities. The second one is that they formed as a result of instabilities during the early stages of the interaction of the new, accelerating fast wind with the recently expelled dense material. Knots formed in this way could be expected to have low initial velocities, since they are a result of condensations forming in a slowly moving dense shell. Material moving at a few hundreds km s-1 was detected in Sakurai’s object only a few years after its outburst (Kerber et al., 2002). It cannot be assessed whether it corresponds to fast moving bullets or to a disrupted shell (Hinkle & Joyce, 2014), but it clearly shows that some material can move at high speeds early in the evolution of a born-again PN.
However the knots are formed, their later dynamics is determined by how they interact with the stellar wind, the ionizing photon flux, and the pre-existing nebular material in the original PN. We consider each of these mechanisms in turn, although the actual dynamics will be a combination of all the effects, with each process being likely prevalent at varying distances from the star.
We begin by considering the interaction with the stellar wind, which was suggested to be at the origin of the acceleration of these knots by Borkowski et al. (1995). The fast wind from the CSPN is highly supersonic and rams into the born-again ejecta and into the slowly expanding (30–40 km s-1) old nebula. The knots can either be embedded in freely flowing fast wind or in the hot, shocked wind bubble. The interaction of a knot with the highly supersonic, free-flowing wind will lead to the formation of a bow-shock in the wind at the star-facing side of the knot, whereas another shock is transmitted into the dense knot material, compressing and heating it. Material is stripped from the knot in turbulent mixing layers, mass loading the stellar wind and modifying the dynamics of the downstream flow (Hartquist et al., 1986). If the knot is inside the hot, shocked wind bubble, the interaction occurs with a subsonic flow, but similarly turbulent mixing layers erode the knot material (Arthur & Lizano, 1997) and mass-loading modifies the flow dynamics (Pittard et al., 2005).
During these interactions, a fraction of the wind momentum is transferred to the eroded material and another fraction accelerates the knot as a whole. In the free-flowing wind, the momentum flux transferred from the wind to the knot is
| (4) |
where and are the mass-loss rate and terminal wind velocity, is the radial distance to the star, is the knot radius, and is the momentum transfer efficiency. For a knot embedded in the subsonic flow, the momentum flux transferred to the wind is
| (5) |
where is the radius of the stellar wind shock and is the ratio of specific heats. Under the assumption that the knot radius is roughly constant, the momentum transfer drops off with radial distance from the CSPN both in the cases of the free-flowing wind and the shocked, subsonic flow.
The knots are also exposed to ionizing radiation, causing the characteristic elongated, straight shadow tails of knots revealed by the images of A30 and A78. This is a known effect which is particularly well illustrated by the numerous “cometary” knots in NGC 7293, the Helix Nebula (e.g., O’Dell & Handron, 1996; Meaburn & Boumis, 2010), although we note that the cometary knots in A30 and A78 are much closer to the ionizing source than those in the Helix. If the knots are dense enough to contain neutral material (Evans et al., 2006), then an ionization front will propagate into the knot, contributing to its dynamics as also proposed for the expansion of the knots in the Helix Nebula (Meaburn et al., 1992; O’Dell & Handron, 1996). The initial implosion stage and subsequent acceleration of the globule due to the rocket effect have been discussed in detail in a series of papers (see e.g., Bertoldi, 1989; Bertoldi & McKee, 1990; Henney et al., 2009, and references therein). Basically, the effect on a particular knot depends on its initial column density and the ionization parameter at the location of the knot. As for the innermost knots of A30 and A78, only modest velocities, 5 km s-1, can be gained due to the rocket effect of the photoevaporating gas. Moreover, the ionization front advances in early stages into the neutral material of the knot at the sound speed, , which corresponds to 3 km s-1 for H-poor neutral material at 3000 K.
The interaction of ionizing photons with the knots has another consequence: the neutral material is photoevaporated and flows away from the knot ionization front and back towards the ionizing source, i.e., the CSPN. This flow of photoevaporated material can reach velocities of km s-1 and then shocks against the free-flowing wind or the subsonic, hot, shocked wind, producing a bow shock (as seen, for instance, in protoplanetary disks in Orion; García-Arredondo et al. 2001, 2002). The photoevaporated material will eventually mix with the stellar wind in a similar way to the hydrodynamic mass-loading processes described above.
The stellar wind (either free-flowing or shocked), the knots, and the material eroded from these knots and carried outwards by the stellar wind will ultimately interact with pre-existing material in the original PN. As the H-poor material travels away from the CSPN, it sweeps up material from the ambient nebula and loses speed. The density of material inside the old nebular shells of A30 and A78 is expected to be low, as implied by their low surface brightness and limb-brightened morphology. Therefore, at small distances from the CSPN, the dynamical effects due to the interaction with the old PN are minimal. As the H-poor material moves outwards, however, it will pick up more and more nebular material, and the initial momentum averaged over the total mass is reduced due to mass loading. We should expect this effect to be noticeable at large distances from the CSPN, with maximum impact on light parcels of gas moving at high speeds such as those detected in the high-dispersion spectra of A30 and A78 by Meaburn & López (1996) and Meaburn et al. (1998).
To explore the effects of the stellar wind, ionizing photons, and mass loading on the dynamics of the H-poor ejecta, we have first obtained analytical solutions of the motion of different clumps of material and then performed basic radiation-hydrodynamic simulations. These are described in Sections 4.1 and 4.2, respectively.
4.1. Analytical Models
For our simple analytical models of the physical processes involved in the dynamics of the H-poor knots of A30 and A78, we have assumed that these knots can gain a fraction of the momentum available from the stellar wind, but they can also be accelerated by the rocket effect of the photoevaporating gas (5 km s-1) or experience an apparent shift outwards in their radial position induced by the progression of the ionization front ( km s-1) that mimics a radial expansion velocity. This positive (real or apparent) acceleration depends on the cross section of a knot and its mass, declining very steeply with its radial distance from the source of stellar wind and ionizing flux, i.e., the CSPN. Meanwhile, as a knot or a parcel of gas travels away from the CSPN, it can experience the ram pressure of the ambient nebula and, by sweeping up its material, the H-poor gas loses speed. Similarly, the deceleration suffered by a knot depends on its cross section and its mass, but in this case the effects increase with its distance from the CSPN.
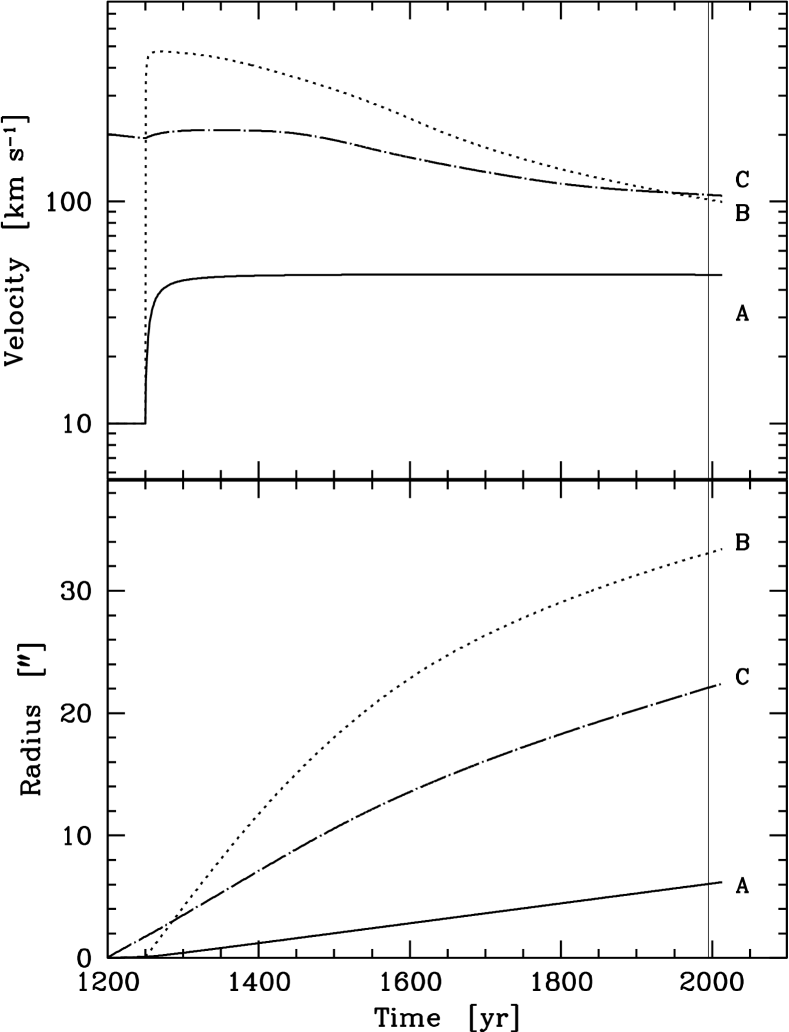
The dynamical evolution of the H-poor knots and parcels of gas carried by the stellar wind has been modeled for a born-again event that occurred in 1200 AD, i.e., 814 yr ago. It was further assumed that the stellar UV flux and fast stellar wind turned on one hundred years after the born-again event, reaching stellar wind parameters as those of A30 and A78, 10-8 yr-1 and 4000 km s-1 (Guerrero et al., 2012; Toalá et al., 2014). A range of sizes (1.31016 cm 2.71017 cm) and initial masses ( 11028 g), as derived from the size and averaged density (1.210-21 g cm-3) adopted for the knots, and initial velocities (10 km s 400 km s-1) were assumed for the knots or parcels of gas carried away by the stellar wind. Similarly, a range of the momentum transfer efficiency, , was assumed. As for the outer nebular shell, a constant density of 100 cm-3 was adopted.
Our analytical model is illustrated in Figure 5, which shows the evolution of different H-poor knots after the born-again event. The ejected material is pushed away by the stellar wind (and also photo-evaporated by the ionizing flux), and it is slowed down by the H-rich ambient material as it travels farther away from the CSPN. Heavy knots with low initial velocities (like knot A in Figure 5) move relatively slowly, and its acceleration by the stellar wind is small. The predicted fractional expansion () of such a knot is 2.5%, which generally agrees with the observations (see Table 2). The behavior of those knots can be compared to that of light parcels of H-poor gas eroded from heavy and slow-moving knots (like knot B in Figure 5). Such knots have low initial velocities, but they could be first significantly accelerated by the stellar wind and the ionizing flux, and then gradually decelerated due to their interaction with the nebular material. The fractional expansion of knot B in Figure 5 is low, 1.0%, but its large radial distance from the CSPN indicates that it had very high velocities in the past. We have also considered the dynamical evolution of a light knot with high initial velocity (knot C in Figure 5). Since the high initial velocity of this knot ensures that it can travel farther from the CSPN than knots A and B by the time the stellar wind and ionizing flux of the CSPN are turned on, the stellar wind will have little effects on its dynamics. Soon after, the knot reached a distance where the dynamical effects of the ambient material dominate. Consequently, its fractional expansion is low: for knot C, 1.6%.
The innermost knots in the equatorial disks have the highest values of fractional expansion , implying that these knots have probably experienced a recent acceleration. Our models show that the stellar wind can sweep up small parcels of ejecta close to the CSPN at high speeds (Harrington et al., 1995), but it cannot by itself produce the sharp decrease of with radial distance seen for the inner knots (Figure 3). This discrepancy is lessened by the rocket effect of photoevaporating material and the progression of the ionization front: in the 20 years between observations, the rocket effect and progression of the ionization front into the knot will have moved outwards at the star-facing edge of the knots by cm, which corresponds to mas at the distance of A30 and mas at the distance of A78. This corresponds to 1% at 2″ and 0.2% at 10″ from the CSPN, reflecting a quick drop in its contribution to .
On the other hand, the lowest values of are associated with the filamentary features immediately outside the equatorial ring of A30 and the outermost filaments in sectors 1 and 2 of A78. Knots B and C in Figure 5 semi-qualitatively describes those cases. The low values of suggest a sudden deceleration, which is particularly intriguing for the outer filaments in A78 because their large radial distance implies that this material sustained a high expansion velocity in the past. Our models confirm that light (maybe also low-density) parcels of the H-poor material can be accelerated to high speeds by the stellar wind and travel quickly across the cavity up to the inner wall of the outermost nebular shell where they can experience a sudden deceleration. Such sharp decrease in velocity would result in the velocity spikes described by Meaburn & López (1996) and Meaburn et al. (1998), with their lowest expansion velocities being similar to the radial velocity of the H-rich shell.
4.2. Numerical Simulations
To assess in depth the effects of the physical processes described above, 2D radiation-hydrodynamical simulations of the formation of a born-again PN have also been carried out. However, the simulations and the results presented in this section are not meant to be an exact model of A30 or A78 but just to illustrate the complexity of the dynamics. The code described in Toalá & Arthur (2011, 2014) was used and the interested reader is referred to those articles for a description of the numerical details. The 2D cylindrically symmetric calculations are performed on a fixed grid of 1000 radial by 2000 -direction cells of uniform cell size and total grid spatial size of 0.51.0 pc2. The free-wind injection zone has a radius of 40 cells, corresponding to the innermost 0.02 pc.
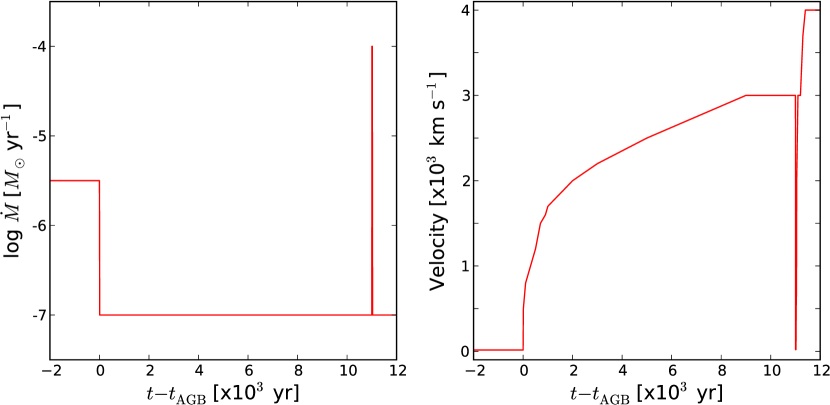
The numerical simulations have followed the evolution of the star through the final phases of the AGB and the post-AGB phases, then the born-again event, and finally along its loop through the AGB locus in the HR diagram and its current CSPN phase. The initial conditions for the ISM were a number density =1 cm-3 and a temperature of = 100 K. Typical values for the duration of the AGB and the first CSPN phase, mass-loss rate, and terminal wind velocity were assumed as listed in Table 4 and shown in Figure 6. These same parameters are mostly unknown for the born-again episode, largely varying for different model assumptions (e.g., Miller Bertolami et al., 2006). For simplicity, the born-again event will be described by a short phase (20 yr) of high mass-loss rate (10-4 yr-1) at low speed (20 km s-1). After the born-again event, the star goes back to the post-AGB track for a second time and develops a fast stellar wind and a high ionizing photon flux. The stellar wind velocity can be adapted to increase very rapidly after the born-again event according to observations towards Sakurai’s object and A58 (see e.g., Clayton et al., 2006; Hinkle & Joyce, 2014). We will assume that as soon as 30 yr after the born-again event, the wind velocity reaches values as high as 3000–4000 km s-1 as seen in A30 (see Guerrero et al., 2012, and references therein) with values for the mass-loss rate similar to those immediately before the born-again event. The ionizing photon flux for both CSPN phases is assumed to be the same, = 1047 s-1, while no ionizing photon flux is considered during the AGB and born-again phases.
| Phase | Duration | () | |
|---|---|---|---|
| (yr) | ( yr-1) | (km s-1) | |
| AGB | 105 | 5.5 | 15 |
| CSPN1 | 1.1104 | 7 | 3000 |
| Born-again | 20 | 4 | 20 |
| CSPN2 | … | 7 | 4000 |
The first 1.11105 yr of evolution in our simulation corresponds to the formation of the old PN. First, the AGB material interacts with the ISM, leaving a density profile (e.g., Villaver et al., 2002; Perinotto et al., 2004). Here we assume a constant mass-loss rate and a constant wind velocity. Then the star evolves through the post-AGB phase (CSPN1 in Table 4) and its stellar wind sweeps up the dense AGB material whereas it is ionized by the high photon flux. We let the PN evolve for 11 000 yr, which is comparable with the dynamical ages of A30 and A78 (Meaburn et al., 1998; Guerrero et al., 2012).
At this point, the circumstellar medium around the CSPN has the following configuration: a free streaming wind region, a bubble filled of tenuous hot gas (107 K, 10-2 cm-3), and the outer ionized PN. The born-again event is set up at this moment. It results in the ejection of dense and slow H-poor material inside the hot bubble that will be swept up as soon as the star enters the post-AGB phase for a second time (CSPN2 in Table 4).
The time evolution of the ionized number density (), temperature (), and radial velocity with respect to the central star (; , where and are the radial and vertical velocities on each cell, respectively) after the born-again event are presented in Figure 7. At early times, the star ionizes the dense material left by the born-again ejection whilst the fast wind sweeps it up, creating hydrodynamical instabilities in this interaction. After 500 yr of the onset of the CSPN phase (Figure 7-top), the fast stellar wind has disrupted the shell left by the born-again ejection and photoionized clumps are formed. These clumps have cometary shape, with dense, cold (104 K) heads pointing toward the central star and long tails that extend up to large radial distances because their velocities have been increased by the interaction of material in the clumps with the shocked fast wind. Multiple interacting shocks develop, heating the ablated clump gas at temperatures that can cause the X-ray emission detected toward A30 and A78 (Chu & Ho, 1995; Guerrero et al., 2012; Toalá et al., 2014).
After 1400 yr (Figure 7-bottom), the densest clumps are still close to the star while the material that has been eroded fills regions of the old PN. Ejecta material carried away by the shocked stellar wind is interacting with the outer, old PN, suffering a strong deceleration. The final configuration of our simulations is thus very similar to that discussed in Section 3, showing material at different distances from the CSPN as a result of a complex dynamical evolution.
![[Uncaptioned image]](/html/1410.3872/assets/x7.png) Figure 7.—
Total ionized number density (left), temperature
(middle), and velocity (right) for the evolution of
a PN after the born-again event. The two rows correspond to different
times marked on top of each panel.
Figure 7.—
Total ionized number density (left), temperature
(middle), and velocity (right) for the evolution of
a PN after the born-again event. The two rows correspond to different
times marked on top of each panel.
Our simulations show how a single and short born-again event is capable of producing the intricate morphology seen in A30 and A78, but it is important to recall that the evolution of the stellar and wind parameters of the CSPN before, during, and after the born-again event has been largely simplified. The situation is especially critical for the born-again event itself, for which a reliable temporal evolution of the stellar wind parameters is missing. Furthermore, the initial born-again ejecta is assumed here to be isotropic, whereas the distribution of the central clumps in all born-again PNe suggests otherwise. Finally, the cooling rate of the material has not been tailored to the peculiar chemical abundances of the H-poor ejecta. More detailed simulations on the formation, evolution, and X-ray emission from these objects will be presented in a forthcoming paper (Toalá & Arthur, in preparation).
4.3. Expansion Ages
Figure 3 clearly shows that there is not a unique apparent expansion age for A30 or A78. The outermost H-poor filaments must have been slowed down in their interaction with the outer H-rich shell, thus the apparent expansion age derived from these features is overestimated.
On the other hand, the equatorial rings are affected by erosion and ionization-front propagation. The average expansion age of 735 yr derived for the equatorial knots of A30 and 705 yr for those of A78 must thus be considered as lower limits.
On the contrary, the polar outflows seem to have been slowed down. The expansion age of 800 yr and 1140 yr implied from the polar knots of A30 and A78, respectively, must be thus regarded as upper limits.
To conclude, the dynamical effects suffered by the different structural components of A30 and A78 hinder the determination of the age of the born-again event. The expansion age of equatorial rings and polar outflows bracket the time since the born-again event as 610–950 yr for A30 and 605–1140 yr for A78.
5. Concluding Remarks
Multi-epoch HST narrowband [O iii] images of the born-again PNe A30 and A78 obtained almost 20 yr apart reveal the angular expansion of their H-poor knots and filaments. The angular expansion of individual features generally increases with radial distance from the CSPN, but there is not a tight linear correlation and the expansion is evidently non-homologous. This argues against the ballistic expansion expected after a single ejection episode.
Hydrodynamical effects are important, as emphasized in illustrative simulations, and the current morphologies and structures of the H-poor material in A30 and A78 are caused by interactions with the stellar wind (free-flowing or shocked), the ionizing photon flux, and the pre-existing (H-rich) nebular material. The high fractional expansion of the H-poor knots at the equatorial rings seems to be best interpreted as the effect of erosion by the ionizing flux and fast stellar wind, rather than a dynamical acceleration. On the other hand, the azimuthal variation of the fractional expansion for the outermost features suggests that the stellar wind is channeled along preferred directions.
The expansion velocities of the equatorial rings and polar knots have been assessed. The inclination of the polar knots is not completely consistent with the aspect ratios of the equatorial rings assumed to be circular. The polar knots of A78, farther away from the CSPN than those in A30, expand faster, but their relatively low fractional expansion is indicative of recent deceleration.
Our panoramic investigation of the kinematics of the two born-again PNe complements previous morphological and spatio-kinematical studies. The current fast stellar wind ablates material from the H-poor knots, which is swept up downstream until it shocks the inner edges of the outer, H-rich nebula. The material carried by the wind suffers from a sharp deceleration and forms irregular shells (petal-like in A30, spindle-shaped in A78) as the stellar wind becomes anisotropic in its interaction with the inner knots.
Acknowledgements
Support for the Hubble Space Telescope Cycle 20 General Observer Program 12935 was provided by NASA through grant HST-GO-12935.01-A from the Space Telescope Science Institute, which is operated by the Association of Universities for Research in Astronomy, Inc., under NASA contract NAS 5-26555. XF, MAG, RAML, and JAT are supported by the Spanish MICINN (Ministerio de Ciencia e Innovación) grant AYA 2011-29754-C03-02 co-funded with FEDER funds. JAT acknowledges support by the CSIC JAE-Pre student grant 2011-00189. RAML acknowledges support by Mexican CONACYT (Consejo Nacional de Ciencia y Tecnología) grant NO. 207706. LMO acknowledges support from DLR grant 50 OR 1302. SJA thanks DGAPA, UNAM for support through project PAPIIT IN101713. We would like to thank Panayotis Boumis, referee of this paper, for the valuable comments and suggestions.
References
- Arthur & Lizano (1997) Arthur, S. J., & Lizano, S. 1997, ApJ, 484, 810
- Bertoldi (1989) Bertoldi, F. 1989, ApJ, 346, 735
- Bertoldi & McKee (1990) Bertoldi, F., & McKee, C. F. 1990, ApJ, 354, 529
- Borkowski et al. (1995) Borkowski, K. J., Harrington, J. P., & Tsvetanov, Z. I. 1995, ApJ, 449, L143
- Borkowski et al. (1993) Borkowski, K. J., Harrington, J. P., Tsvetanov, Z., & Clegg, R. E. S. 1993, ApJ, 415, L47
- Bryce et al. (1997) Bryce, M., López, J. A., Holloway, A. J., & Meaburn, J. 1997, ApJ, 487, L161
- Chu et al. (1997) Chu, Y.-H., Chang, T. H., & Conway, G. M. 1997, ApJ, 482, 891
- Chu & Ho (1995) Chu, Y.-H., & Ho, C.-H. 1995, ApJ, 448, L127
- Clayton et al. (2006) Clayton, G. C., Kerber, F., Pirzkal, N., et al. 2006, ApJ, 646, L69
- Evans et al. (2006) Evans, A., Tyne, V. H., van Loon, J. T., et al. 2006, MNRAS, 373, L75
- García-Arredondo et al. (2002) García-Arredondo, F., Arthur, S. J., & Henney, W. J. 2002, RMxAA, 38, 51
- García-Arredondo et al. (2001) García-Arredondo, F., Henney, W. J., & Arthur, S. J. 2001, ApJ, 561, 830
- Guerrero et al. (2002) Guerrero, M. A., Miranda, L. F., & Chu, Y. H. 2002, RevMexAA, 12, 156
- Guerrero et al. (2012) Guerrero, M. A., Ruiz, N., Hamann, W.-R., et al. 2012, ApJ, 755, 129
- Harrington et al. (1995) Harrington, J. P., Borkowski, K. J., & Tsvetanov, Z. 1995, ApJ, 439, 264
- Hartquist et al. (1986) Hartquist, T. W., Dyson, J. E., Pettini, M., & Smith, L. J. 1986, MNRAS, 221, 715
- Henney et al. (2009) Henney, W. J., Arthur, S. J., de Colle, F., & Mellema, G. 2009, MNRAS, 398, 157
- Herwig (2005) Herwig, F. 2005, ARA&A, 43, 435
- Hinkle & Joyce (2014) Hinkle, K. H., & Joyce, R. R. 2014, ApJ, 785, 146
- Iben et al. (1983) Iben, I., Jr., Kaler, J. B., Truran, J. W., & Renzini, A. 1983, ApJ, 264, 605
- Jacoby (1979) Jacoby, G. H. 1979, PASP, 91, 754
- Kerber et al. (2002) Kerber, F., Pirzkal, N., De Marco, O., et al. 2002, ApJ, 581, L39
- Lawlor & MacDonald (2006) Lawlor, T. M., & MacDonald, J. 2006, MNRAS, 371, 263
- Meaburn & Boumis (2010) Meaburn, J., & Boumis, P. 2010, MNRAS, 402, 381
- Meaburn & López (1996) Meaburn, J., & López, J. A. 1996, ApJ, 472, L45
- Meaburn et al. (1998) Meaburn, J., López, J. A., Bryce, M., & Redman, M. P. 1998, A&A, 334, 670
- Meaburn et al. (1992) Meaburn, J., Walsh, J. R., Clegg, R. E. S., Walton, N. A., Taylor, D., & Berry, D. S. 1992, MNRAS, 255, 177
- Miller Bertolami & Althaus (2006) Miller Bertolami, M. M., & Althaus, L. G. 2006, A&A, 454, 845
- Miller Bertolami et al. (2006) Miller Bertolami, M. M., Althaus, L. G., Serenelli, A. M., & Panei, J. A. 2006, A&A, 449, 313
- O’Dell et al. (2013) O’Dell, C. R., Ferland, G. J., Henney, W. J., & Peimbert, M. 2013, AJ, 145, 170
- O’Dell & Handron (1996) O’Dell, C. R., & Handron, K. D. 1996, AJ, 111, 1630
- Perinotto et al. (2004) Perinotto, M., Schönberner, D., Steffen, M., & Calonaci, C. 2004, A&A, 414, 993
- Pittard et al. (2005) Pittard, J. M., Dyson, J. E., Falle, S. A. E. G., & Hartquist, T. W. 2005, MNRAS, 361, 1077
- Reed et al. (1999) Reed, D. S. et al. 1999, ApJ, 118, 2430
- Steffen & López (2004) Steffen, W., & López, J. A. 2004, ApJ, 612, 319
- Toalá & Arthur (2011) Toalá, J. A., & Arthur, S. J. 2011, ApJ, 737, 100
- Toalá & Arthur (2014) Toalá, J. A., & Arthur, S. J. 2014, MNRAS, 443, 3486
- Toalá et al. (2014) Toalá, J. A., Guerrero, M. A., Todt, H., et al. 2014, ApJ, submitted
- Villaver et al. (2002) Villaver, E., García-Segura, G., & Manchado, A. 2002, ApJ, 571, 880