Revealing H2D+ depletion and compact structure in starless and protostellar cores with ALMA
Abstract
We present Atacama Large Millimeter/submillimeter Array (ALMA) observations of the submillimeter dust continuum and H2D+ emission toward two evolved, potentially protostellar cores within the Ophiuchus molecular cloud, Oph A SM1 and SM1N. The data reveal small-scale condensations within both cores, with mass upper limits of M⊙ ( MJup). The SM1 condensation is consistent with a nearly-symmetric Gaussian source with a width of only AU. The SM1N condensation is elongated, and extends 500 AU along its major axis. No evidence for substructure is seen in either source. A Jeans analysis indicates these sources are unlikely to fragment, suggesting that both will form single stars. H2D+ is only detected toward SM1N, offset from the continuum peak by AU. This offset may be due to either heating from an undetected, young, low luminosity protostellar source or first hydrostatic core, or HD (and consequently H2D+) depletion in the cold centre of the condensation. We propose that SM1 is protostellar, and that the condensation detected by ALMA is a warm ( K) accretion disk. The less concentrated emission of the SM1N condensation suggests that it is still starless, but we cannot rule out the presence of a low-luminosity source, perhaps surrounded by a pseudodisk. These data reveal observationally the earliest stages of the formation of circumstellar accretion regions, and agree with theoretical predictions that disk formation can occur very early in the star formation process, coeval with or just after the formation of a first hydrostatic core or protostar.
Subject headings:
ISM: molecules - stars: formation1. Introduction
Stars form within dense cores of molecular gas. Observations of the continuum emission from dust reveal that the density profiles of many starless cores can be well modelled with relatively flat centers that steepen to a power-law decrease at some radius. Dense cores that show high concentration - observationally, by comparing the integrated continuum flux to the central surface brightness - are more likely to contain embedded protostars (Walawender et al. 2005), including Very Low Luminosity Objects (VeLLOs) with internal luminosities L⊙ (Young et al. 2004). In analytic equilibrium models of dense cores, such as Bonnor-Ebert spheres, this behaviour is expected as there is a maximum concentration value for critically self-gravitating objects (Johnstone et al. 2000) beyond which a core is unstable to collapse. As the central density of a collapsing core increases beyond cm-3, the continuum emission becomes optically thick and the core begins to warm. The heated central molecular core achieves hydrostatic equilibrium, called the first hydrostatic core (FHSC; Larson 1969; Masunaga et al. 1998), until H2 is dissociated at K (with the subsequent collapse forming the second hydrostatic core, or protostar). Concurrently, infalling material may form an accretion disk or pseudodisk with approximate size of a few AU to several hundred AU around a young protostar, due to the influence of magnetic fields (e.g., Galli & Shu 1993a, b) and/or rotation (e.g., Bate et al. 2014; Commerçon et al. 2012). The transition from prestellar core to FHSC or protostar, while clearly a vital step in the process of star formation, has not been well studied observationally due to the short lifetime of the FHSC stage, difficulties in establishing the relative evolutionary stage of objects, the small spatial scales involved, and the dearth of strong molecular tracers of cores at high densities.
At the high densities ( cm-3) and low temperatures ( K) characteristic of the interiors of highly evolved star-forming cores, many molecules deplete from the gas phase by freezing out onto dust grains (see, e.g., Bergin & Tafalla 2007). Concurrently, the deuterium fraction of remaining gas-phase species increases dramatically above the cosmic abundance ratio (; Oliveira et al. 2003) due to increased production of H2D+ through the reaction of H with HD in places (or regions) where CO is depleted (Roberts & Millar 2000). At extreme densities, H and its deuterated isotopologues may be the only observable species remaining in the gas phase (Walmsley et al. 2004). The lowest energy transitions of H lie in the infrared and are unlikely to be excited in dense cores. Thus, H2D+ observations are crucial for our understanding of the chemistry (and magnetically regulated) dynamics just before a star is formed. The ortho-H2D+ rotation transition at 372.4 GHz is accessible from the ground but lies on the edge of a telluric water line and requires an exceptionally dry observing site. To date, H2D+observations have only been successful with single-dish telescopes (e.g., Stark et al. 1999; Caselli et al. 2003, 2008; Friesen et al. 2010). Based on the observational work of Caselli et al. (2003), Walmsley et al. (2004) argued that the bright H2D+ emission toward L1544 could be explained by chemical models that include near-complete gas-phase depletion of species heavier than He within the central few thousand AU. In a further survey of 16 starless and protostellar cores, Caselli et al. (2008) found that strong H2D+ emission correlates with increasing core central density concentration, which itself correlates with growing instability to gravitational collapse.
| Target | R.A. | Decl. | aaSynthesized beam FWHM for SM1 and SM1N are given in the text. | aaSynthesized beam FWHM for SM1 and SM1N are given in the text. |
|---|---|---|---|---|
| J2000 | J2000 | mJy beam-1 | mJy beam-1 | |
| SM1 | 16:26:27.83 | -24:23:59.2 | 215 | 2 |
| SM1N | 16:26:27.25 | -24:23:24.6 | 3.0 | 0.3 |
Note. —
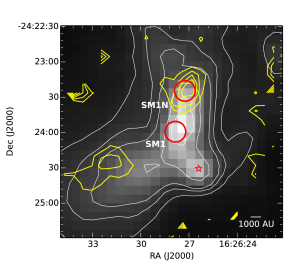
The Ophiuchus molecular cloud is the nearest example of ongoing, clustered star formation ( pc; Loinard et al. 2008). The Oph A filament, shown in Figure 1 in 850 µm continuum emission, is a 0.1 pc-length curved chain of clumps (Wilson et al. 1999), with high column densities cm-2 and volume densities cm-3 (Motte et al. 1998; Johnstone et al. 2000). Most of the cores are currently classified as starless, apart from the canonical Class 0 source VLA 1623, indicating Oph A is dynamically young. Apart from VLA 1623, the two brightest Oph A cores in millimeter continuum emission are SM1 and SM1N (André et al. 1993), which are separated by only ″ (3600 AU), and have similar densities and masses ( cm-3 and M , respectively Motte et al. 1998). Neither core has been identified as protostellar through infrared observations.
In this paper, we present Atacama Large Millimeter/submillimeter Array (ALMA) Cycle 0 submillimetre continuum and ortho-H2D+ 110 - 111 observations toward SM1 and SM1N at AU and AU spatial resolution (continuum and spectral line, respectively), as well as single-dish H2D+ observations made with the James Clerk Maxwell Telescope (JCMT). We describe the observations, data reduction, and imaging in §2. In §3, we show that small-scale condensations are detected by ALMA within both SM1 and SM1N, and these condensations are resolved with effective radii of 37 AU and 400 AU, respectively. We derive masses of M⊙ for both condensations, given reasonable assumptions of source temperature and dust opacity. We present the first interferometric detection of H2D+, which we detect slightly offset from SM1N. In §4, we argue that the continuum emission detected by ALMA toward SM1 reveals a warm accretion disk surrounding an extremely young protostellar source. We further propose that the extended emission detected by ALMA toward SM1N is the first detection of a pseudodisk or circumstellar accretion region (CAR), possibly surrounding an extremely young protostellar source or first hydrostatic core (FHSC).
2. Observations and data reduction
2.1. ALMA
Observations of the SM1 and SM1N cores were performed in 2012 August as part of the ALMA Early Science Cycle 0 program 2011.0.00396.S (PI Rachel Friesen) at 359 GHz and 372 GHz (ALMA Band 7). The core locations within Oph A are shown in Figure 1 (circles), while the pointing centres are listed in Table 1. The data were obtained over two separate days with either 28 or 23 antennas available, but three antennas were later flagged in each dataset for having unusually high system temperatures. Baseline lengths ranged from 21 m to 402 m ( k at 359 GHz). Four spectral windows were used, each with 234 MHz bandwidth and 3840 channels with widths of 61 kHz, or 0.05 km s-1 at 372 GHz. Two spectral windows were placed to observe the ortho-H2D+ 110– line at 372.213400 GHz and the N2H+ 4–3 transition at 372.6725090 GHz (Pickett et al. 1998), while two additional spectral windows were used for continuum observations at 359.2 GHz and 359.4 GHz. Observations cycled between SM1, SM1N, and calibration sources in a given execution block. The ALMA primary beam at 359 GHz is ″, while the shortest baselines give a maximum angular size (the largest scale where structure is recoverable by the array) of ″. Since these observations were performed during Cycle 0, no compact array or total power measurements were available.
Data were reduced and calibrated using the CASA 3.4 software package (McMullin et al. 2007). Flux calibration was performed using observations of Titan and Neptune, using the Butler-JPL-Horizons 2012 flux density models for solar system objects111ALMA Memo 594. Bandpass calibration used observations of J1924-292 and J1517-243, and gain calibrations were performed through observations of J1625-254 and J1626-298. Calibration uncertainties were significantly lower for the spectral windows at 359 GHz than at 372 GHz due to the increased proximity to a strong telluric water line near 372 GHz.
All four spectral windows were used in imaging the continuum data to maximize the total bandwidth. In the two spectral windows centred on the H2D+ and N2H+ emission lines, only line-free channels were used for continuum imaging. To image the SM1 condensation, we performed a multi-frequency synthesis deconvolution over all spectral windows and self-calibrated on the initial source model. The final image was created with uniform weighting of the -data to decrease side lobes and optimize angular resolution, giving a 0.45″ 0.34″ beam full-width-half-maximum (FWHM) with a position angle of °, and a 1 sigma noise sensitivity of 2.0 mJy beam-1. The lower peak flux density toward SM1N was not sufficiently bright to self-calibrate, and the final image was created with natural weighting of the -data to optimize the signal-to-noise ratio (SNR), using multi-scale, multi-frequency synthesis deconvolution to recover better the observed larger-scale structure of the source. This gave a beam FWHM of 0.60″ 0.41″ with a position angle of °, and a 1 sigma noise sensitivity of 0.3 mJy beam-1.
Before imaging the line spectral windows, continuum emission in each channel was removed with a linear fit. To increase the surface brightness sensitivity, the H2D+ data were tapered in the -plane to a final angular resolution of 1″.3, or AU, while the velocity resolution was decreased to 0.15 km s-1 velocity channels. The final rms noise in the tapered data is 0.07 Jy beam-1 (0.36 K in the scale of brightness temperature ) per 0.15 km s-1 velocity channel.
2.2. JCMT
Ortho-H2D+ 110–111 and N2H+ 4–3 emission from Oph A was observed with the JCMT using the 16-element Heterodyne Array Receiver Programme (HARP) focal-plane array (Smith et al. 2008) and the AutoCorrelation Spectrometer Imaging System (ACSIS) back-end (Hovey et al. 2000). HARP consists of 16 receptors arranged in a 44 square pattern with an on-sky spacing between receptors of 30″. Data were obtained by pointing HARP at one of three target positions along Oph A, and observing in a “jiggle” mode to obtain three adjacent fully sampled maps, each ′ in diameter due to field rotation. Sky subtraction was accomplished by position switching between the target positions and locations 900″ separated in elevation. HARP was tuned to 372.5 GHz and ACSIS configured to provide two windows, centred on the H2D+ and N2H+ lines, each with 250 MHz band width and 4096 channels. Each channel was 61 kHz wide (0.049 km s-1 at 372 GHz). The velocity resolution of ACSIS data is a factor of the configured channel spacing, or in this case 0.059 km s-1.
Observing proceeded over three semesters, under project IDs M09AC08, M09BAC14, and M10AC03. All observations were made during very dry weather conditions, i.e., , to ensure maximum sensitivity to the ortho-H2D+ 110–111 and the N2H+ 4–3 lines. Standard focus calibration observations were performed on nearby bright objects like R Aql, and pointing calibrations observations were conducted on objects such as CRL618, both before the observations start and every minutes. Flux calibration was monitored by observing when possible spectral line standards like W75N at a variety of frequencies. The aperture efficiency of HARP at 372.5 GHz is not well characterized, and is presumed to be .
The data were reduced consistently using common routines and procedures in the STARLINK reduction package. Each integration was visually checked for baseline ripples, absent detectors or extremely large spikes and specific integrations where these occurred were removed from the data ensemble. In particular, receptor H03 was unavailable during most of the data; at various times no more than two other receptors were also unavailable. Other spikes were identified and removed using a standard methodology created by developers at the Joint Astronomy Centre. Spectral baselines were subtracted, frequency axes converted to velocities, and spectra trimmed using STARLINK scripts kindly provided by T. van Kempen. All remaining data were co-added into pixels 7.5″ 7.5″ in size, placed on the WCS framework, and written out as FITS format files using other standard STARLINK routines.
3. Results and Analysis
| Target | R. A. | Decl. | Major axis | Minor-major axis ratio | Position angle | |
|---|---|---|---|---|---|---|
| Jy | ″ | ° | ||||
| SM1 | 16:26:27.86 | -24:23:59.5 | 0.317(1) | 0.314(1) | 0.908(7) | -6(2) |
| SM1N | 16:26:27.20 | -24:23:22.4 | 0.15(1) | 4.2(2) | 0.61(3) | -24(3) |
Note. —
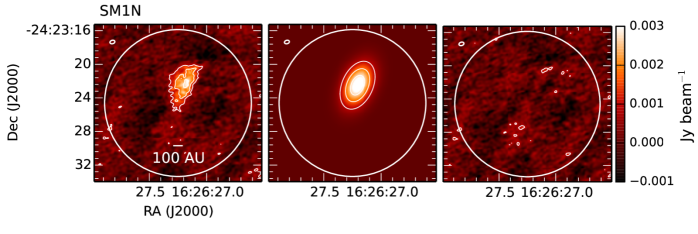
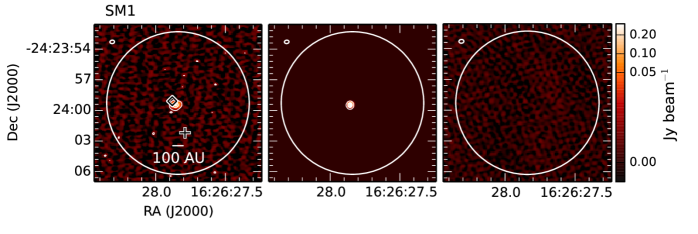
With ALMA, we detected small-scale structure toward both SM1 and SM1N in the continuum. Here, we call the ALMA-detected structures ‘condensations’, and retain the ‘core’ nomenclature for the structures identified through single-dish observations. The ALMA continuum images are shown in Figure 2, and Table 1 lists the peak flux density and rms noise observed by ALMA for both sources. Toward SM1, we find a small but resolved source with a peak flux density of 215 mJy beam-1 and total flux density of 321 mJy. The emission peak in the interferometer data is offset by ″ from the SM1 core location identified in dust continuum single-dish observations (Johnstone et al. 2000; Motte et al. 1998). The peak flux density observed by ALMA is only % of the 850 µm single-dish peak flux density, while the total flux density is only % of the single-dish flux density. Toward SM1N, we find a fainter, larger, and elongated source with a peak flux density of 3 mJy beam-1 and a total flux density of 150 mJy. The condensation is offset 6″ from the core location as identified through 1.3 mm single-dish emission (Motte et al.). The observed ALMA peak flux density is only % of the single-dish flux density, where the 1.3 mm flux was determined after subtraction of the larger-scale Oph A clump emission, and further scaled to 359 GHz assuming typical starless core dust emissivity (see §3.2 for more discussion of dust emissivity). We do not have a single-dish total flux measurement for SM1N, but compare the core and condensation masses further in §3.2.
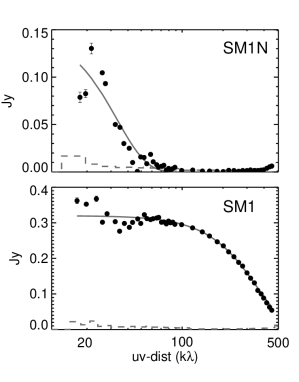
Figure 3 (black points) shows the circularly averaged -data for the SM1 and SM1N condensations. We show the continuum data in the 359 GHz spectral windows only, as the noise was greater in the 372 GHz windows due to their proximity to the telluric water lines. For each source, we shifted the phase centre of the -data to match the condensation peak flux position before performing circular averaging. The grey lines show the best-fit Gaussian model to the visibilities, described further in the next section. The amplitude expectations for zero flux (grey dashed lines) were calculated using the uvamp task in the Miriad software package (Sault et al. 1995).
The -data further emphasize what can be seen in the continuum images for each source. The SM1 condensation is resolved, with significant flux above the zero expectation value to the longest baselines (smallest angular scales) we measure. Furthermore, there is a break in the visibility amplitudes at -distances k, where the amplitudes oscillate around the apparent flux density limit. This beating pattern indicates that there is additional emission on larger angular scales (as measured at small distances), but it is not connected to the SM1 condensation itself. The SM1 condensation is thus distinct from the larger-scale core, and is not an extrapolation of the emission from larger scales. In contrast to SM1, the -data for SM1N show that the SM1N condensation is extended, and has no evidence for additional compact structure at -distances k at flux densities mJy.
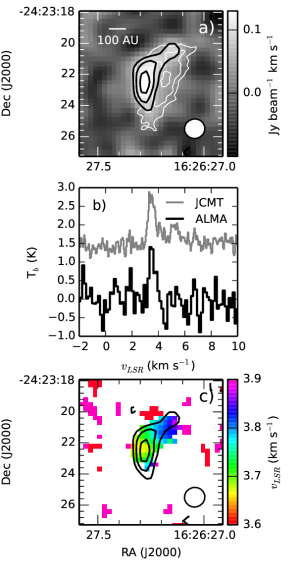
We additionally present here the first interferometric detection of H2D+ toward a starless or protostellar core. The single-dish H2D+ data, shown in Figure 1 (yellow contours), reveal two distinct H2D+ emission peaks within Oph A. H2D+ emission is found toward SM1N, and also near Oph AN6, a quiescent, starless core identified in N2H+ 1-0 emission (Di Francesco et al. 2004). With ALMA, we detect H2D+ emission toward SM1N, but not SM1, with a peak line brightness of 0.25 Jy beam-1 (1.3 K in scale). Figure 4 (top) shows the H2D+ integrated intensity toward SM1N. Comparison of the H2D+ integrated intensity peak (black contours begin at 3 sigma) with the continuum contours (white) shows that the emission peaks are offset by ″ ( AU at 120 pc). Figure 4 additionally shows the H2D+ spectra, taken at the peak of the ALMA integrated intensity map, from the JCMT and ALMA observations. The line velocities of peak brightness are similar between the single-dish and the interferometric data.
N2H+ 4-3 emission was also detected toward both sources, but is heavily self-absorbed or resolved out by the interferometer, and we do not show it here. Additional observations that include shorter baselines or total power information are needed to understand the structure of the N2H+ emission. We note, however, that the N2H+ emission does not peak toward the continuum structures in either source, either in the integrated intensity or channel maps. We do not discuss the N2H+ data further in this paper.
3.1. Continuum -modeling
Given the relatively simple structure seen in the continuum images, we fit both the SM1 and SM1N condensations with single 2D Gaussians in the -plane using the CASA task uvmodelfit. This task performs a least-squares minimization of a model to the observed visibilities in amplitude and phase. By fitting directly source models to the observed visibilities rather than to the imaged data, we circumvent the deconvolution step and analyze the data in the domain where the measurements are made. For both sources, only the spectral windows at 359 GHz were used in this analysis. We then subtracted the best-fit model visibilities from the observed visibilities, and imaged the residuals to determine the quality of the fit. Curves representing the best-fit 2D Gaussian model radially-averaged visibility amplitude as a function of uv-distance for each source are overlaid on the data points in Figure 3. The fit results are listed in Table 2. Figure 2 shows the ALMA continuum images, the best-fit model images, and the residual images for both SM1 and SM1N.
The SM1 condensation is well fit by a single 2D Gaussian component with a major axis, ″ ( AU at 120 pc), a minor-major axis ratio of 0.91, position angle (PA) of °, and total flux Jy. The residual in the model-subtracted image, made with uniform weighting of the visibilities, is mJy, a factor of two less than the 1 sigma rms of the original image. A faint striping pattern of positive and negative residuals is present, however (see Figure 2). As described in the previous section, the circularly averaged plot of the visibility amplitudes of SM1 shows evidence of ringing at short -distances, indicating that additional structure is present at larger scales than the bright, 0.31″ (Gaussian width) emission peak. Emission is seen to the west of the SM1 condensation with peak flux densities of mJy beam-1. The offset from the SM1 condensation, and the pattern of negative and positive striping suggests that the emission is coming from unresolved structure such as, for example, the western edge of the Oph A filament, rather than an underlying structure similar in size and brightness to the SM1N condensation (discussed further below). Further observations with additional short-spacing information are needed to discern the source of the larger-scale emission.
SM1N is also moderately well-fit by a single 2D Gaussian component, but with significantly greater extent, larger aspect ratio, and lower flux than SM1. The emission peak is shifted by 2.2″ from the pointing phase centre, but still falls well within the 17.5″ (FWHM) ALMA primary beam. The best-fit Gaussian gives ″ ( AU at 120 pc), a minor-major axis ratio of 0.61, PA of °, and total flux Jy. Similar to SM1, there may be additional flux at the shortest -distances in the circularly averaged plot of the visibility amplitudes, but our data do not have the sensitivity and short-spacing information to determine its structure. As previously described, the visibility amplitudes at large uv-distances in Figure 3 are consistent with the expectation for zero flux, ruling out any additional, unresolved structure at flux density mJy.
3.2. Masses of the condensations
For both sources, the total flux density, , derived from the models agrees with the total flux density summed over the continuum maps. Assuming the dust emission is optically thin, we directly calculate the mass from for each source, following
| (1) |
where pc is the distance to Oph A (Loinard et al. 2008). The dust opacity per unit mass at frequency , , is parameterized as , where is the dust opacity per unit mass normalized at some frequency , and is the opacity spectral index. is the Planck function at frequency and dust temperature .
We constrain by assuming it is similar to the gas temperature, given the expected coupling between gas and dust at the densities of the cores. We then determine the kinetic gas temperature through simultaneous hyperfine fitting of NH3 (1,1) and (2,2) line emission following Friesen et al. (2009), observed over the entire Oph A core with the Australia Telescope Compact Array (10″.6 7″.0 FWHM, or AU; Friesen et al., in preparation). We find kinetic gas temperatures K toward SM1N. SM1 lies at the edge of the Oph A filament as seen in NH3 emission, with consequently lower SNR. The line strengths of the main components of the NH3 (1,1) and (2,2) lines are similar at the SM1 location, however, indicating that the gas temperature is at least K. Given the SNR and the similarity of the line strengths, we cannot constrain the temperature more accurately with this thermometer. We also note that the spatial scales of the observations from which the temperatures are derived are greater than what ALMA can probe at these wavelengths. The true gas and dust temperature at AU scales may therefore be lower if the cores are starless, or greater if the cores are protostellar.
The dust opacity, , and opacity spectral index, , are additional sources of uncertainty. Typical dust opacities in the interstellar medium generally assume , in agreement with models of ice-coated dust grains (OH5; Ossenkopf & Henning 1994). Grain growth can decrease the spectral index. In protostellar disks, multiple studies have shown that dust coagulation decreases the observed index to or lower (e.g., Banzatti et al. 2013). In the limit that the dust emission is optically thick, we expect to see a pure blackbody source at temperature and . To estimate the mass of the SM1 and SM1N condensations, we normalize cm2 g-1 at 1000 GHz (Hildebrand 1983). Setting gives cm2 g-1 at 359 GHz ( µm), in agreement with the OH5 model, while cm2 g-1 with .
For SM1, we can further constrain the spectral index of the dust opacity through Submillimeter Array (SMA) observations at 227 GHz (1.3 mm; Bourke et al. in prep). We use data only on baselines k (giving a synthesized beam of ″), to exclude emission resolved out by the ALMA observations, and find a point source flux of mJy toward SM1. Assuming the emission is in the Rayleigh-Jeans regime at both 227 GHz and 359 GHz (following, e.g., Friesen et al. 2005), and % flux calibration uncertainty, we find . This low value of is suggestive of grain growth in SM1. If we have overestimated the 227 GHz flux by including emission resolved out by ALMA, however, the thus derived will be a lower limit. While similarly low values of have been reported toward young disks (Tobin et al. 2013), more frequently is assumed to fit the dust emission in disks around protostars. Assuming a minimum temperature for the SM1 condensation of K and , we find M⊙. If, instead, SM1 is a warm accretion disk, for example, we may expect and K (e.g., Zapata et al. 2013), giving a disk mass M⊙. Archival Herschel data, however, described further in §4.1, show no point-source emission toward SM1. At a uniform temperature K, SM1 would be sufficiently bright at 70 µm to be detected in the archival Herschel data, and we can thus rule out such high temperatures averaged over the condensation. A circumstellar disk heated by a central protostar will have a temperature gradient, with warmer temperatures at small radii that would remain consistent with our data.
Given the mass, we further calculate the mean volume density, , assuming a spherical shape with an effective radius . Regardless of the choice of or , the SM1 condensation has a remarkably high mean density. Setting K, AU, and , we find cm-3. The Jeans length for these parameters, AU, is slightly greater than the observed source size. At temperatures K, however, the free-fall timescale associated with SM1’s derived mean density yr, making it highly unlikely to be observed in this state. We conclude that the SM1 condensation is most likely a warm disk with an average temperature K and M⊙ ( MJup), where the lowest values correspond to a combination of high and low . For a uniform disk with a radius , and K, the corresponding surface density g cm-2 (including both gas and dust).
For SM1N, we expect the NH3-derived gas temperature, K, to be a good first approximation to the true dust temperature. If we assume the typical dense core , we find the SM1N condensation has a mass of 0.02 M⊙. For a range of temperatures between 10 K and 25 K, the mass ranges from 0.05 M⊙ to 0.01 M⊙. Lowering to 1 decreases the derived mass by a factor in this temperature range. With AU, SM1N’s mean density is large ( cm-3), but is similar to that derived by Motte et al. (1998, ; cm-3) for SM1N, using a multiresolution wavelet analysis to separate small- and large-scale structures in a 1.3 mm single-dish continuum map (although their source size is significantly larger). For comparison, the combination of mass and effective radius reported by Johnstone et al. (2000) through 850 µm observations at 15″ resolution gives a mean density for SM1N of cm-3. Given a density cm-3, the free-fall time yr. For SM1N we find AU for a temperature of 15 K, greater than SM1N’s effective radius.
While the uncertainty in the derived masses is thus uncertain to factors of a few, we find that the condensations associated with both SM1 and SM1N have masses M⊙. For comparison, the brown dwarf mass limit M⊙ (13 MJup) is very similar to the masses we determine for the ALMA-detected condensations. These masses are also times smaller than those derived from single-dish observations (1-3 M⊙; Motte et al. 1998; Johnstone et al. 2000). If either SM1 or SM1N are protostellar, they are clearly early stage objects, where the mass in any small-scale structure or disk is substantially less than that remaining in the envelope.
3.3. Ortho-H2D+ line analysis
We fit the H2D+ emission profile detected by ALMA with a single 1D Gaussian at pixels where the peak line emission is greater than three times the rms noise. Within the contours of the integrated intensity map, we find a mean line-of-sight velocity relative to the local standard of rest, km s-1, and a mean line width (FWHM) km s-1. Typical uncertainties on these values are km s-1 and km s-1, respectively. Figure 4 (bottom) shows the spatial distribution of obtained from H2D+. A small gradient in , km s-1 over AU, can be seen along the long axis of SM1N, with line-of-sight velocity increasing to the northwest, but we are unable to perform a robust fit to the gradient given the low SNR of the H2D+ emission. A gradient in is also seen along the long axis of SM1N in the NH3 (1,1) data, but with the line-of-sight velocity increasing to the southeast, i.e. opposite the direction seen in the H2D+ emission. The NH3 gradient is in agreement with the larger-scale trend seen in N2H+ emission (Di Francesco et al. 2004). A similar direction reversal of the velocity gradient at small scales was seen in L1544 (Caselli et al. 2002; Crapsi et al. 2007). This intriguing potential reversal in velocity gradients can be probed with greater sensitivity line observations of the small-scale SM1N structure.
Since H2D+ has a low molecular weight (), the thermal velocity dispersion, , for a given gas temperature, , is relatively large. If purely due to thermal motions, the mean H2D+ line width (FWHM) km s-1 observed by ALMA toward SM1N corresponds to a temperature of 18.5 K, similar to the temperature we assume for SM1N based on the NH3 analysis. In a few pixels, the line widths decrease to km s-1, suggesting a lower temperature limit K. The km s-1 uncertainty in the fits, however, limits any temperature constraints to approximately a few K. The line widths observed by the JCMT are slightly larger, km s-1 toward SM1N (at 13″ FWHM resolution), but correspond to a gas temperature of 35 K if purely thermally driven. If we assume instead a gas temperature of 16 K, we find a non-thermal velocity dispersion km s-1 for the H2D+ emission at 13″ resolution, slightly less than the sound speed at 16 K. The non-thermal motions traced by H2D+ in Oph A are thus subsonic on AU scales (13″ at 120 pc), and decline to extremely low values on AU scales. This suggests that unless the SM1N condensation is significantly colder than 16 K, the H2D+ emission is not tracing any significant non-thermal motions due to, e.g., infall. Even if the gas temperature declines to K on the small scales traced by ALMA, any non-thermal motions will remain subsonic, on average.
We next determine the ortho-H2D+ column density, , following Friesen et al. (2010). We first derive an opacity assuming an excitation temperature ,
| (2) |
where is the peak main-beam temperature of the H2D+ emission line, and and are the equivalent Rayleigh-Jeans excitation and background temperatures, respectively. We then calculate the column density (Vastel et al. 2006),
| (3) | ||||
Here, the statistical weight , K, and s-1 for the ortho-H2D+ transition (Ramanlal & Tennyson 2004). The integral . We estimate the partition function by reducing the H2D+ level structure to a 2-level system following Caselli et al. (2008). Since the energy of the first excited state above ground is K and that of the second excited state is K, we expect this approximation to be valid in SM1N. The partition function depends on . Caselli et al. found that in H2D+ is similar to, or slightly less than the kinetic gas temperature toward several starless and protostellar cores. For SM1N, we thus set K, less than the gas temperature K. This choice also allows best comparisons with single-dish H2D+ results in Ophiuchus (e.g., Friesen et al. 2010). For similar physical conditions, Friesen et al. showed that the derived ortho-H2D+ column density will underestimate the true value by % if K, and overestimate the true value by % if K.
We find a maximum ortho-H2D+ column density cm-2 at the integrated intensity H2D+ peak. Based on the rms noise in the data and the mean H2D+ line width (where detected), we estimate the uncertainty on the column density, cm-2. Note that this uncertainty does not take into account any systematic calibration uncertainties or the uncertainty in . Since H2D+ is not detected toward the SM1N continuum peak, we therefore find a upper limit on the ortho-H2D+ column density of cm-2 at that location.
We derive the line-of-sight abundance of ortho-H2D+ across SM1N by first imaging the continuum data with the same taper. We then calculate the H2 column density following , where is the beam solid angle, is the mean molecular weight of interstellar material in a molecular cloud per hydrogen molecule, and we set K in agreement with the NH3-derived kinetic gas temperature. The ortho-H2D+ abundance is then . The maximum abundance thus derived is , with a 3 sigma upper limit at the continuum peak of .
For comparison, a similar analysis of submillimetre continuum and H2D+ observations at 15″ resolution in Oph A gives cm-2, H2 column density cm-2, and an ortho-H2D+ abundance toward SM1N. The maximum ortho-H2D+ abundance observed by ALMA is thus similar to that observed at larger scales, but ALMA reveals a drop in abundance toward the continuum peak by a factor .
Given the warmer temperature estimated for the SM1 disk, the lack of H2D+ detection is likely the result of the processes that form H2D+ in abundance requiring both cold temperatures and depleted CO. At temperatures K, CO is able to evaporate from dust grains back into the gas phase and interact with H and H2D+, lowering the H2D+ abundance (Caselli et al. 2008).
4. Discussion
4.1. The evolutionary states of SM1 and SM1N
Embedded protostellar sources are most readily identified as point sources in the infrared, for example through Spitzer or Herschel imaging at 24 µm or 70 µm wavelengths. Dunham et al. (2008) find a strong correlation between protostellar internal luminosity, , and the 70 µm flux of an embedded YSO (their Equation 2). We use this relation to place limits on any embedded sources within SM1 and SM1N, using archival 70 µm data from the PACS instrument (Poglitsch et al. 2010) on the Herschel Space Observatory222Data are from program OT1_pabraham_3. Herschel is an ESA space observatory with science instruments provided by European-led Principal Investigator consortia and with important participation from NASA.. Toward Oph A, the only point source visible at 70 µm is the Class 0 protostar VLA 1623. Since the total flux density of a point source is equal to the flux density within a telescope beam, we can calculate the upper limit on using the noise value at 70 µm within a radius of 5.2″ (the Herschel beam FWHM at 70 µm). An arc of bright emission is present along the eastern edge of Oph A, however. Both SM1 and SM1N lie near, or along, this ridge of emission, and the upper limits we derive are consequently relatively high. After applying a colour correction (Pezzuto et al. 2012), we find a 70 µm noise value of 3.07 Jy beam-1 and 2.03 Jy beam-1 toward SM1 and SM1N, respectively, corresponding to upper limits on the internal protostellar luminosity, for SM1 and for SM1N. We thus cannot rule out the presence of an embedded, low luminosity protostar toward either SM1 or SM1N based on the 70 µm emission.
Both FHSCs and young protostars are expected to drive outflows (e.g., Tomisaka 2002; Machida et al. 2005). FHSCs are expected to drive slow outflows, with speeds of only a few km s-1, in contrast to low-mass protostellar outflows with speeds of a km s-1. In a search for outflows in Oph A, Kamazaki et al. (2003) find no evidence for outflow activity from either SM1 or SM1N in CO data. The lack of outflow detection on large scales suggests that any outflow from either source must be dynamically young, in agreement with our estimates of the source ages. The FHSC candidates L1451-mm and Per-Bolo 58 drive outflows with a characteristic velocity of km s-1 (Pineda et al. 2011a; Dunham et al. 2011). Over yr, a 3 km s-1 outflow would reach a distance of only 630 AU from the central source, whereas single-dish CO observations typically have spatial resolutions AU (e.g., CO 3-2 observed with the JCMT). A faster outflow with velocities km s-1, typical of a Class 0 source, would drive material to AU in the same time frame. If either SM1 or SM1N contain FHSCs or an extremely young protostar, then any outflow will be best probed by future interferometric observations.
4.2. SM1: a protostellar object with an early disk
Many Class 0 sources have been detected at radio wavelengths, where the emission is thought to be thermal bremmstrahlung (free-free) emission originating from the dense central base of ionized winds (Dzib et al. 2013). Radio surveys toward Oph A have not detected emission from SM1N, but show mixed results toward SM1. For example, Dzib et al. (2013) do not detect SM1 at 4.5 GHz and 7.5 GHz (6.7 cm and 4 cm, respectively) above 85 Jy beam-1 (1″ FWHM), but SM1 has been detected previously at 5 GHz (6 cm) with peak flux density Jy beam-1 (11″ 5″ and 9″.5 5″ FWHM, respectively; Leous et al. 1991; Gagné et al. 2004). The Leous et al. detection is ″ offset from the ALMA peak location, whereas the Gagné et al. detection is co-located with the ALMA source (see Figure 2). For comparison, the 5 GHz flux densities found for the Class 0 source VLA 1623 in these studies are greater by factors of .
Gagné et al. also find a faint, variable, and relatively hard X-ray source at the SM1 peak (shown in Figure 2). No X-ray emission was seen toward VLA 1623, and searches for X-rays toward other known or possible Class 0 sources have had mixed results. For example, Tsuboi et al. (2001) detect hard X-ray emission toward several Class 0 sources in the Orion molecular cloud. Additional studies in different regions also find X-ray sources coincident with Class 0 objects (Hamaguchi et al. 2005; Getman et al. 2006). In contrast, Giardino et al. (2006) do not detect any X-ray emission toward known Class 0 sources in Serpens. In low-mass, pre-main-sequence stars, X-ray emission is likely caused by magnetic reconnection events on the stellar surface (Feigelson et al. 2007). Disk accretion processes may produce soft X-rays from accretion shocks, but the high extinction through Oph A limits the soft X-ray sensitivity toward SM1.
Intriguingly, the SM1 core has a high degree of deuteration in H2CO (Bergman et al. 2010) relative to SM1N, whereas the JCMT H2D+ observations at 11″ resolution show a strong emission peak toward SM1N and little emission toward SM1. This seemingly discrepant result can be explained chemically: HDCO and D2CO are known to form on dust grain surfaces (as intermediate products toward the formation of methanol, which can only form on dust surfaces) and partially desorb during the process of their formation in pre-stellar cores (e.g., Bacmann et al. 2003; Garrod et al. 2007). The bulk of deuterated formaldehyde, however, remains in ices, and is released back into the gas phase only nearby newly born protostars (e.g., Fuente et al. 2005).
Together, the X-ray and radio detections strongly imply that SM1 is protostellar, containing an extremely young, deeply embedded protostellar object that is powering a partially ionized jet. In addition, the chemical abundances on single-dish scales are consistent with a source that has only recently begun to heat its immediate surroundings. These additional data thus support our characterization of the ALMA-detected continuum emission as a disk. The detection of a disk around SM1 is further evidence that disks can form rapidly around young protostars, coeval with or prior to the formation of a FHSC.
Many, although not all, Class 0 protostars show compact dust continuum components that cannot be attributed to being simply the density profiles from their larger scale cores extrapolated to small scales, and are likely disks (e.g., Jørgensen et al. 2004, 2007, 2009; Girart et al. 2009; Maury et al. 2014). For these early protostellar stages, however, observational identification of disks has thus far largely relied on modelling the observed spectral energy distribution (SED), or unresolved structure in visibility data from interferometric observations. It is not clear whether all these early disks are rotationally supported; at least some Class 0 disks are dominated by infall rather than rotation (Brinch et al. 2009), as expected in early stages of core collapse when the young protostar is accreting most of its mass (the formation of the circumstellar accretion region, or CAR; Terebey et al. 1984).
If the SM1 condensation is a circumstellar disk around an extremely young protostellar source, it is useful to compare the condensation mass ( M⊙) with disks identified around other protostellar sources. Unless otherwise stated, we are comparing with studies that determine the disk mass from unresolved, small-scale components seen at long baselines in interferometric data (i.e., from the SMA or CARMA arrays). Disentangling the disk and envelope components thus add additional uncertainty to the disk masses beyond the temperature and opacity uncertainties described above. A simple comparison with the circumstellar disk around HL Tau (following Looney et al. 2003) suggests the SM1 disk mass M⊙ (where the HL Tau disk has a mass M⊙ from a 2.7 mm flux density mJy at a distance of 140 pc). A similar comparison for the Class 0 protostellar source L1157-mm gives a disk mass M⊙ (Chiang et al. 2012). Enoch et al. (2011) find a mean disk mass M⊙ toward Class 0 and Class I sources in Serpens. Using similar assumptions about the disk temperature and dust opacity as used here, Jørgensen et al. (2009) find a median disk mass M⊙ for a sample of ten nearby Class 0 sources, but note that incorporating a temperature gradient in the disk (as expected for a disk heated by a central protostar) would reduce the disk masses by a factor . Recently, rotationally supported, Keplerian disks have been imaged toward two Class 0 sources (L1527 IRS and VLA 1623; Tobin et al. 2013; Murillo et al. 2013; Murillo & Lai 2013), with radii AU. Toward L1527 IRS, Tobin et al. (2013) find a disk mass M⊙. The masses of these early disks are in good agreement with our mass estimate in the SM1 condensation, despite most having significantly higher protostellar luminosities than our upper limit toward SM1.
4.3. SM1N: a possible FHSC?
In contrast to SM1, SM1N shows no evidence for an embedded source in X-ray, infrared, or radio emission. Figure 2 shows that after -subtraction of the best-fit Gaussian model, the residual image shows no additional small-scale structure, and we detect no point source above our noise limits when imaging the longest baselines only. Toward SM1N, the ALMA-detected continuum structure is significantly smaller than the scales over which starless cores are modelled to have relatively flat density profiles (a few thousand AU; Ward-Thompson et al. 1994; Kirk et al. 2005). The ALMA data thus reveal the accumulation of mass on small scales, again at a time just prior to or after the formation of a FHSC or protostar.
The SM1N condensation is significantly larger than predicted FHSC radii of only a few AU (e.g., Masunaga et al. 1998; Tomida et al. 2010, 2013). Rotating FHSCs may form early circumstellar disks with radii up to AU, but these are only seen in simulations of the fastest rotating cases (e.g., Bate 1998; Saigo & Tomisaka 2006; Saigo et al. 2008; Machida et al. 2011; Bate 2011). The SM1N condensation is similar in extent, however, to that expected from theoretical predictions for a pseudodisk, a flattened, disequilibrium structure expected to form around FHSCs and young protostars as material is accreting onto the central source in the presence of a magnetic field (Galli & Shu 1993a, b). Commerçon et al. (2012) simulate ALMA observations of FHSCs from radiation-magneto-hydrodynamic models of collapsing dense cores at 150 pc, and find detectable accretion disks with sizes similar to the SM1N condensation for cores with initial moderate and strong magnetic fields. While the predicted flux density in the simulated extended structure is similar to what we find toward SM1N, the predicted peak flux from the central FHSC is times brighter than the observed peak flux toward SM1N. Furuya et al. (2012) perform three-dimensional radiative transfer modelling of the collapse from core to FHSC. Evaluating the chemistry post-process, the authors find that heating allows CO to sublimate at radii of AU from the FHSC, which would reduce the H2D+ abundance due to both the gas temperature and the increased CO abundance. The ALMA detection of H2D+ toward SM1N is therefore consistent with the presence of an embedded FHSC within SM1N.
The elongation of the SM1N condensation follows that seen on larger scales in N2H+ emission (Di Francesco et al. 2004), matching the filamentary shape of the northern tip of Oph A. If SM1N is truly starless, this observed alignment supports the prediction that the collapse of filamentary structures should create triaxial structure on small ( AU) scales (Lee et al. 2012), eventually forming filamentary envelopes similar to those seen around some Class 0 protostars (Tobin et al. 2010). Similar agreement between core and filament elongation over larger scales has been seen toward the starless Oph AN6 core (Di Francesco et al. 2004; Bourke et al. 2012) and Barnard 5 (Pineda et al. 2011b). We note, however, that the H2D+ line widths observed by ALMA suggest any non-thermal (i.e., infall) motions are likely subsonic. More sensitive observations of undepleted, spatially resolved molecular line tracers are needed to probe the infall and velocity gradients expected in this filament accretion scenario.
4.4. Substructure in clustered cores
Both the SM1 and SM1N condensations are smaller than the Jeans lengths derived from their respective mean densities. We therefore do not expect thermal fragmentation to drive further substructure formation. If the SM1 condensation is a disk, its gravitational stability will depend, for example, on whether or not it is in Keplerian rotation, and the mass of the disk relative to the central source (e.g., Toomre 1964). Additional observations are needed to determine both of these parameters.
Toward SM1, Nakamura et al. (2012) detect several small-scale condensations with the SMA through 342 GHz (880 µm) observations at an angular resolution of . The brightest SMA source (a1) is coincident with the ALMA-detected condensation, and has a peak flux density that is consistent with the total ALMA flux. We do not detect a second source (a2), although it should be visible within the ALMA field of view, with a peak flux density that is significantly greater than our rms noise ( Jy beam-1). The -data in Figure 3 shows that SM1 contains additional structure at larger spatial scales in addition to the Gaussian model, but the ‘ringing’ feature in -space is consistent with an extended feature offset in position from the primary source, rather than a secondary Gaussian feature at lower brightness. The most likely source of this ringing is the extended Oph A ridge, and if we image the residual data (after subtraction of the SM1 Gaussian model, shown in Figure 2) with natural weighting, we indeed see a low-brightness, extended feature to the west of SM1 and elongated along a north-south axis, consistent with the Oph A ridge at the location of SM1.
The observations described here are some of the first to probe the substructure in starless or very early protostellar cores at AU resolution. Lower resolution studies have similarly detected little substructure in starless cores (Schnee et al. 2010, 2012) but likely lack the sensitivity and resolution to discern fragmentation in these sources (Offner et al. 2012). Here, we show that the SM1 and SM1N cores are unlikely to fragment into additional structures to form, e.g., binary or multiple stellar systems. It is not necessarily true, however, that SM1 and SM1N could not eventually end up in a multiple system. Di Francesco et al. (2004) find that to first order, Oph A is in gravitational equilibrium. They also find that the core-to-core velocity dispersion along the line of sight, , within Oph A is only km s-1. Assuming the three-dimensional velocity dispersion , and given a projected distance between SM1 and SM1N of 35″.5 ( AU at a distance of 120 pc; using the peak continuum emission locations determined here), we find an interaction timescale of only yr. This is significantly shorter than estimates of the prestellar core timescale (0.5 Myr; Enoch et al. 2008), and the embedded core lifetime (0.5 Myr; Evans et al. 2009), indicating that the two objects could interact before the dispersal of the Oph A filament.
4.5. H2D+ in cores at AU resolution
Figure 4 shows that the H2D+ emission detected toward SM1N is unexpectedly offset to the east from the central continuum peak. Here, we investigate several potential causes of this offset.
Enhanced abundances of H2D+ in the gas phase within dense cores require low gas temperatures. Since the NH3-derived gas temperature on AU scales is 16 K, an increasing temperature gradient to K toward the core centre could reduce the production of H2D+ through two mechanisms. First, the reaction to form H2D+ is exothermic by only a small amount ( K; Millar et al. 1989), and at higher temperatures it can proceed in both directions, producing no overabundance of H2D+. Second, at higher temperatures CO will evaporate from dust grains (Bisschop et al. 2006) and react with H2D+, lowering the H2D+ abundance. In this scenario, SM1N contains an unseen low luminosity central source heating the gas and dust.
Caselli et al. (2008) show that a dust grain size distribution shifted to smaller grains and higher cosmic ray ionization rate will both decrease the observed deuterium fractionation at low temperatures. Since grains are expected and observed to coagulate and grow at high densities, we do not expect the grain size distribution to play a role in the observed H2D+ distribution toward SM1N. Furthermore, there is no evidence of a variation in the ionization rate toward Oph A. We note, however, that immediately east of Oph A there is a strong, non-thermal radio and X-ray source, Oph S1, a close T-Tauri binary with a magnetic B4 primary (J162634.2-242328; Gagné et al. 2004). Given the X-ray luminosity detected by Gagné et al., we follow Maloney et al. (1996) to determine the X-ray ionization rate at the location of SM1, and find that it is less than the typical cosmic ray ionization rate assumed for molecular clouds.
Recent chemistry models that include grain surface reactions in dense cores show that deuterium can become incorporated into HDO on grain surfaces at densities cm-3 and temperatures K, significantly reducing the abundance of HD (and consequently H2D+) in the gas phase (Sipilä et al. 2013, Lee & Bergin 2014, submitted). This effect is strongest at high densities and low temperatures ( cm-3 at K), resulting in a decreasing H2D+ abundance gradient toward small radii in a starless core. Given the physical conditions we derive for SM1N (a mean density of cm-3 and a gas temperature K), the H2D+ abundances we find are consistent with model predictions. For a model core with slightly lower average density than we find for the SM1N condensation (model cm-3, with cm-3 at radii AU), Sipilä et al. predict an H2D+ abundance decrease of an order of magnitude, to , at radii AU. Assuming the density profile increases and the temperature profile decreases toward the core centre, Lee & Bergin predict a drop in the gas-phase H2D+ abundance (including both ortho- and para-H2D+) to values . These updated chemistry models can therefore also explain the lower H2D+ abundance at the SM1N continuum peak, but do not predict directly the observed asymmetric distribution.
The observed small-scale H2D+ emission, along with the lack of other indicators of a core’s protostellar nature, further support our conclusion that SM1N is either an evolved, starless core, or contains a very young protostellar (possibly FHSC) source, where the ALMA-detected condensation reveals the pseudodisk around the YSO or FHSC.
5. Summary
We have presented ALMA observations of the Ophiuchus A SM1 and SM1N cores in submillimeter dust continuum emission, and ALMA and JCMT observations of H2D+ emission. We detect small-scale continuum condensations within both SM1 and SM1N. Both condensations have masses M⊙ ( MJup) based on the continuum emission and typical dust temperature and dust emissivity values in prestellar cores or protostellar disks. We show that the SM1 condensation is consistent with a nearly-symmetric Gaussian source with a width of only AU, while the SM1N condensation is elongated, and extends 500 AU along its major axis. No evidence for substructure is seen in either source. A Jeans analysis indicates they are unlikely to fragment, suggesting both cores will form single stars. We propose that SM1 is protostellar, and that the condensation detected by ALMA is a warm ( K) accretion disk or pseudodisk. The less concentrated emission of SM1N suggests that it is still starless, but we cannot rule out the presence of a low-luminosity source.
We furthermore show the first interferometric H2D+ detection toward a star-forming region. H2D+ is only detected toward SM1N, but is offset from the continuum peak. This offset may be due to either heating from an undetected, young, low luminosity protostellar source or first hydrostatic core, or HD (and consequently H2D+) depletion in the cold centre of the condensation. These data reveal observationally the earliest stages of the formation of circumstellar accretion regions, and agree with theoretical predictions that disk formation can occur very early in the star formation process, coeval with or just after the formation of a first hydrostatic core or protostar. The identification of SM1 (and possibly SM1N) as protostellar indicates that infrared surveys may not produce complete catalogs of protostellar cores in high extinction environments, such as Ophiuchus.
References
- André et al. (1993) André, P., Ward-Thompson, D., & Barsony, M. 1993, ApJ, 406, 122
- Bacmann et al. (2003) Bacmann, A., Lefloch, B., Ceccarelli, C., Steinacker, J., Castets, A., & Loinard, L. 2003, ApJ, 585, L55
- Banzatti et al. (2013) Banzatti, A., Meyer, M., Pontoppidan, K., & Bruderer, S. 2013, in Protostars and Planets VI, Heidelberg, July 15-20, 2013. Poster #2S034, 34
- Bate (1998) Bate, M. R. 1998, ApJ, 508, L95
- Bate (2011) —. 2011, MNRAS, 417, 2036
- Bate et al. (2014) Bate, M. R., Tricco, T. S., & Price, D. J. 2014, MNRAS, 437, 77
- Bergin & Tafalla (2007) Bergin, E. A. & Tafalla, M. 2007, ARA&A, 45, 339
- Bisschop et al. (2006) Bisschop, S. E., Fraser, H. J., Öberg, K. I., van Dishoeck, E. F., & Schlemmer, S. 2006, A&A, 449, 1297
- Bourke et al. (2012) Bourke, T. L., Myers, P. C., Caselli, P., Di Francesco, J., Belloche, A., Plume, R., & Wilner, D. J. 2012, ApJ, 745, 117
- Brinch et al. (2009) Brinch, C., Jørgensen, J. K., & Hogerheijde, M. R. 2009, A&A, 502, 199
- Caselli et al. (2003) Caselli, P., van der Tak, F. F. S., Ceccarelli, C., & Bacmann, A. 2003, A&A, 403, L37
- Caselli et al. (2008) Caselli, P., Vastel, C., Ceccarelli, C., van der Tak, F. F. S., Crapsi, A., & Bacmann, A. 2008, A&A, 492, 703
- Caselli et al. (2002) Caselli, P., Walmsley, C. M., Zucconi, A., Tafalla, M., Dore, L., & Myers, P. C. 2002, ApJ, 565, 344
- Chiang et al. (2012) Chiang, H.-F., Looney, L. W., & Tobin, J. J. 2012, ApJ, 756, 168
- Commerçon et al. (2012) Commerçon, B., Levrier, F., Maury, A. J., Henning, T., & Launhardt, R. 2012, A&A, 548, A39
- Crapsi et al. (2007) Crapsi, A., Caselli, P., Walmsley, M. C., & Tafalla, M. 2007, A&A, 470, 221
- Di Francesco et al. (2004) Di Francesco, J., André, P., & Myers, P. C. 2004, ApJ, 617, 425
- Di Francesco et al. (2008) Di Francesco, J., Johnstone, D., Kirk, H., MacKenzie, T., & Ledwosinska, E. 2008, ApJS, 175, 277
- Dunham et al. (2011) Dunham, M. M., Chen, X., Arce, H. G., Bourke, T. L., Schnee, S., & Enoch, M. L. 2011, ApJ, 742, 1
- Dunham et al. (2008) Dunham, M. M., Crapsi, A., Evans, II, N. J., Bourke, T. L., Huard, T. L., Myers, P. C., & Kauffmann, J. 2008, ApJS, 179, 249
- Dzib et al. (2013) Dzib, S. A., Loinard, L., Mioduszewski, A. J., Rodríguez, L. F., Ortiz-León, G. N., Pech, G., Rivera, J. L., Torres, R. M., Boden, A. F., Hartmann, L., Evans, II, N. J., Briceño, C., & Tobin, J. 2013, ApJ, 775, 63
- Enoch et al. (2011) Enoch, M. L., Corder, S., Duchêne, G., Bock, D. C., Bolatto, A. D., Culverhouse, T. L., Kwon, W., Lamb, J. W., Leitch, E. M., Marrone, D. P., Muchovej, S. J., Pérez, L. M., Scott, S. L., Teuben, P. J., Wright, M. C. H., & Zauderer, B. A. 2011, ApJS, 195, 21
- Enoch et al. (2008) Enoch, M. L., Evans, II, N. J., Sargent, A. I., Glenn, J., Rosolowsky, E., & Myers, P. 2008, ApJ, 684, 1240
- Evans et al. (2009) Evans, N. J., Dunham, M. M., Jørgensen, J. K., Enoch, M. L., Merín, B., van Dishoeck, E. F., Alcalá, J. M., Myers, P. C., Stapelfeldt, K. R., Huard, T. L., Allen, L. E., Harvey, P. M., van Kempen, T., Blake, G. A., Koerner, D. W., Mundy, L. G., Padgett, D. L., & Sargent, A. I. 2009, ApJS, 181, 321
- Feigelson et al. (2007) Feigelson, E., Townsley, L., Güdel, M., & Stassun, K. 2007, Protostars and Planets V, 313
- Friesen et al. (2010) Friesen, R. K., Di Francesco, J., Myers, P. C., Belloche, A., Shirley, Y. L., Bourke, T. L., & André, P. 2010, ApJ, 718, 666
- Friesen et al. (2009) Friesen, R. K., Di Francesco, J., Shirley, Y. L., & Myers, P. C. 2009, ApJ, 697, 1457
- Friesen et al. (2005) Friesen, R. K., Johnstone, D., Naylor, D. A., & Davis, G. R. 2005, MNRAS, 361, 460
- Fuente et al. (2005) Fuente, A., Rizzo, J. R., Caselli, P., Bachiller, R., & Henkel, C. 2005, A&A, 433, 535
- Furuya et al. (2012) Furuya, K., Aikawa, Y., Tomida, K., Matsumoto, T., Saigo, K., Tomisaka, K., Hersant, F., & Wakelam, V. 2012, ApJ, 758, 86
- Gagné et al. (2004) Gagné, M., Skinner, S. L., & Daniel, K. J. 2004, ApJ, 613, 393
- Galli & Shu (1993a) Galli, D. & Shu, F. H. 1993a, ApJ, 417, 220
- Galli & Shu (1993b) —. 1993b, ApJ, 417, 243
- Garrod et al. (2007) Garrod, R. T., Wakelam, V., & Herbst, E. 2007, A&A, 467, 1103
- Getman et al. (2006) Getman, K. V., Feigelson, E. D., Townsley, L., Broos, P., Garmire, G., & Tsujimoto, M. 2006, ApJS, 163, 306
- Giardino et al. (2006) Giardino, G., Favata, F., Silva, B., Micela, G., Reale, F., & Sciortino, S. 2006, A&A, 453, 241
- Girart et al. (2009) Girart, J. M., Rao, R., & Estalella, R. 2009, ApJ, 694, 56
- Hamaguchi et al. (2005) Hamaguchi, K., Corcoran, M. F., Petre, R., White, N. E., Stelzer, B., Nedachi, K., Kobayashi, N., & Tokunaga, A. T. 2005, ApJ, 623, 291
- Hildebrand (1983) Hildebrand, R. H. 1983, QJRAS, 24, 267
- Hovey et al. (2000) Hovey, G. J., Burgess, T. A., Casorso, R. V., Dent, W. R., Dewdney, P. E., Force, B., Lightfoot, J. F., Willis, A. G., & Yeung, K. K. 2000, in Society of Photo-Optical Instrumentation Engineers (SPIE) Conference Series, Vol. 4015, Radio Telescopes, ed. H. R. Butcher, 114–125
- Johnstone et al. (2000) Johnstone, D., Wilson, C. D., Moriarty-Schieven, G., Joncas, G., Smith, G., Gregersen, E., & Fich, M. 2000, ApJ, 545, 327
- Jørgensen et al. (2007) Jørgensen, J. K., Bourke, T. L., Myers, P. C., Di Francesco, J., van Dishoeck, E. F., Lee, C.-F., Ohashi, N., Schöier, F. L., Takakuwa, S., Wilner, D. J., & Zhang, Q. 2007, ApJ, 659, 479
- Jørgensen et al. (2004) Jørgensen, J. K., Hogerheijde, M. R., van Dishoeck, E. F., Blake, G. A., & Schöier, F. L. 2004, A&A, 413, 993
- Jørgensen et al. (2009) Jørgensen, J. K., van Dishoeck, E. F., Visser, R., Bourke, T. L., Wilner, D. J., Lommen, D., Hogerheijde, M. R., & Myers, P. C. 2009, A&A, 507, 861
- Kamazaki et al. (2003) Kamazaki, T., Saito, M., Hirano, N., Umemoto, T., & Kawabe, R. 2003, ApJ, 584, 357
- Kirk et al. (2005) Kirk, J. M., Ward-Thompson, D., & André, P. 2005, MNRAS, 360, 1506
- Larson (1969) Larson, R. B. 1969, MNRAS, 145, 271
- Lee et al. (2012) Lee, K., Looney, L., Johnstone, D., & Tobin, J. 2012, ApJ, 761, 171
- Leous et al. (1991) Leous, J. A., Feigelson, E. D., Andre, P., & Montmerle, T. 1991, ApJ, 379, 683
- Loinard et al. (2008) Loinard, L., Torres, R. M., Mioduszewski, A. J., & Rodríguez, L. F. 2008, ApJ, 675, L29
- Looney et al. (2003) Looney, L. W., Mundy, L. G., & Welch, W. J. 2003, ApJ, 592, 255
- Machida et al. (2011) Machida, M. N., Inutsuka, S.-I., & Matsumoto, T. 2011, PASJ, 63, 555
- Machida et al. (2005) Machida, M. N., Matsumoto, T., Hanawa, T., & Tomisaka, K. 2005, MNRAS, 362, 382
- Maloney et al. (1996) Maloney, P. R., Hollenbach, D. J., & Tielens, A. G. G. M. 1996, ApJ, 466, 561
- Masunaga et al. (1998) Masunaga, H., Miyama, S. M., & Inutsuka, S.-i. 1998, ApJ, 495, 346
- Maury et al. (2014) Maury, A. J., Belloche, A., André, P., Maret, S., Gueth, F., Codella, C., Cabrit, S., Testi, L., & Bontemps, S. 2014, A&A, 563, L2
- McMullin et al. (2007) McMullin, J. P., Waters, B., Schiebel, D., Young, W., & Golap, K. 2007, in Astronomical Society of the Pacific Conference Series, Vol. 376, Astronomical Data Analysis Software and Systems XVI, ed. R. A. Shaw, F. Hill, & D. J. Bell, 127
- Millar et al. (1989) Millar, T. J., Bennett, A., & Herbst, E. 1989, ApJ, 340, 906
- Motte et al. (1998) Motte, F., Andre, P., & Neri, R. 1998, A&A, 336, 150
- Murillo & Lai (2013) Murillo, N. M. & Lai, S.-P. 2013, ApJ, 764, L15
- Murillo et al. (2013) Murillo, N. M., Lai, S.-P., Bruderer, S., Harsono, D., & van Dishoeck, E. F. 2013, A&A, 560, A103
- Nakamura et al. (2012) Nakamura, F., Takakuwa, S., & Kawabe, R. 2012, ApJ, 758, L25
- Offner et al. (2012) Offner, S. S. R., Capodilupo, J., Schnee, S., & Goodman, A. A. 2012, MNRAS, 420, L53
- Oliveira et al. (2003) Oliveira, C. M., Hébrard, G., Howk, J. C., Kruk, J. W., Chayer, P., & Moos, H. W. 2003, ApJ, 587, 235
- Ossenkopf & Henning (1994) Ossenkopf, V. & Henning, T. 1994, A&A, 291, 943
- Pezzuto et al. (2012) Pezzuto, S., Elia, D., Schisano, E., Strafella, F., Di Francesco, J., Sadavoy, S., André, P., Benedettini, M., Bernard, J. P., di Giorgio, A. M., Facchini, A., Hennemann, M., Hill, T., Könyves, V., Molinari, S., Motte, F., Nguyen-Luong, Q., Peretto, N., Pestalozzi, M., Polychroni, D., Rygl, K. L. J., Saraceno, P., Schneider, N., Spinoglio, L., Testi, L., Ward-Thompson, D., & White, G. J. 2012, A&A, 547, A54
- Pickett et al. (1998) Pickett, H. M., Poynter, R. L., Cohen, E. A., Delitsky, M. L., Pearson, J. C., & Müller, H. S. P. 1998, J. Quant. Spec. Radiat. Transf., 60, 883
- Pineda et al. (2011a) Pineda, J. E., Arce, H. G., Schnee, S., Goodman, A. A., Bourke, T., Foster, J. B., Robitaille, T., Tanner, J., Kauffmann, J., Tafalla, M., Caselli, P., & Anglada, G. 2011a, ApJ, 743, 201
- Pineda et al. (2011b) Pineda, J. E., Goodman, A. A., Arce, H. G., Caselli, P., Longmore, S., & Corder, S. 2011b, ApJ, 739, L2
- Poglitsch et al. (2010) Poglitsch, A., Waelkens, C., Geis, N., Feuchtgruber, H., Vandenbussche, B., Rodriguez, L., Krause, O., Renotte, E., van Hoof, C., Saraceno, P., Cepa, J., Kerschbaum, F., Agnèse, P., Ali, B., Altieri, B., Andreani, P., Augueres, J.-L., Balog, Z., Barl, L., Bauer, O. H., Belbachir, N., Benedettini, M., Billot, N., Boulade, O., Bischof, H., Blommaert, J., Callut, E., Cara, C., Cerulli, R., Cesarsky, D., Contursi, A., Creten, Y., De Meester, W., Doublier, V., Doumayrou, E., Duband, L., Exter, K., Genzel, R., Gillis, J.-M., Grözinger, U., Henning, T., Herreros, J., Huygen, R., Inguscio, M., Jakob, G., Jamar, C., Jean, C., de Jong, J., Katterloher, R., Kiss, C., Klaas, U., Lemke, D., Lutz, D., Madden, S., Marquet, B., Martignac, J., Mazy, A., Merken, P., Montfort, F., Morbidelli, L., Müller, T., Nielbock, M., Okumura, K., Orfei, R., Ottensamer, R., Pezzuto, S., Popesso, P., Putzeys, J., Regibo, S., Reveret, V., Royer, P., Sauvage, M., Schreiber, J., Stegmaier, J., Schmitt, D., Schubert, J., Sturm, E., Thiel, M., Tofani, G., Vavrek, R., Wetzstein, M., Wieprecht, E., & Wiezorrek, E. 2010, A&A, 518, L2
- Ramanlal & Tennyson (2004) Ramanlal, J. & Tennyson, J. 2004, MNRAS, 354, 161
- Roberts & Millar (2000) Roberts, H. & Millar, T. J. 2000, A&A, 364, 780
- Saigo & Tomisaka (2006) Saigo, K. & Tomisaka, K. 2006, ApJ, 645, 381
- Saigo et al. (2008) Saigo, K., Tomisaka, K., & Matsumoto, T. 2008, ApJ, 674, 997
- Sault et al. (1995) Sault, R. J., Teuben, P. J., & Wright, M. C. H. 1995, in Astronomical Society of the Pacific Conference Series, Vol. 77, Astronomical Data Analysis Software and Systems IV, ed. R. A. Shaw, H. E. Payne, & J. J. E. Hayes, 433
- Schnee et al. (2010) Schnee, S., Enoch, M., Johnstone, D., Culverhouse, T., Leitch, E., Marrone, D. P., & Sargent, A. 2010, ApJ, 718, 306
- Schnee et al. (2012) Schnee, S., Sadavoy, S., Di Francesco, J., Johnstone, D., & Wei, L. 2012, ApJ, 755, 178
- Sipilä et al. (2013) Sipilä, O., Caselli, P., & Harju, J. 2013, A&A, 554, A92
- Smith et al. (2008) Smith, H., Buckle, J., Hills, R., Bell, G., Richer, J., Curtis, E., Withington, S., Leech, J., Williamson, R., Dent, W., Hastings, P., Redman, R., Wooff, B., Yeung, K., Friberg, P., Walther, C., Kackley, R., Jenness, T., Tilanus, R., Dempsey, J., Kroug, M., Zijlstra, T., & Klapwijk, T. M. 2008, in Society of Photo-Optical Instrumentation Engineers (SPIE) Conference Series, Vol. 7020, Society of Photo-Optical Instrumentation Engineers (SPIE) Conference Series
- Stark et al. (1999) Stark, R., van der Tak, F. F. S., & van Dishoeck, E. F. 1999, ApJ, 521, L67
- Terebey et al. (1984) Terebey, S., Shu, F. H., & Cassen, P. 1984, ApJ, 286, 529
- Tobin et al. (2013) Tobin, J. J., Hartmann, L., Chiang, H.-F., Wilner, D. J., Looney, L. W., Loinard, L., Calvet, N., & D’Alessio, P. 2013, ApJ, 771, 48
- Tobin et al. (2010) Tobin, J. J., Hartmann, L., Looney, L. W., & Chiang, H.-F. 2010, ApJ, 712, 1010
- Tomida et al. (2013) Tomida, K., Tomisaka, K., Matsumoto, T., Hori, Y., Okuzumi, S., Machida, M. N., & Saigo, K. 2013, ApJ, 763, 6
- Tomida et al. (2010) Tomida, K., Tomisaka, K., Matsumoto, T., Ohsuga, K., Machida, M. N., & Saigo, K. 2010, ApJ, 714, L58
- Tomisaka (2002) Tomisaka, K. 2002, ApJ, 575, 306
- Toomre (1964) Toomre, A. 1964, ApJ, 139, 1217
- Tsuboi et al. (2001) Tsuboi, Y., Koyama, K., Hamaguchi, K., Tatematsu, K., Sekimoto, Y., Bally, J., & Reipurth, B. 2001, ApJ, 554, 734
- Vastel et al. (2006) Vastel, C., Caselli, P., Ceccarelli, C., Phillips, T., Wiedner, M. C., Peng, R., Houde, M., & Dominik, C. 2006, ApJ, 645, 1198
- Walawender et al. (2005) Walawender, J., Bally, J., Kirk, H., & Johnstone, D. 2005, AJ, 130, 1795
- Walmsley et al. (2004) Walmsley, C. M., Flower, D. R., & Pineau des Forêts, G. 2004, A&A, 418, 1035
- Ward-Thompson et al. (1994) Ward-Thompson, D., Scott, P. F., Hills, R. E., & Andre, P. 1994, MNRAS, 268, 276
- Wilson et al. (1999) Wilson, C. D., Avery, L. W., Fich, M., Johnstone, D., Joncas, G., Knee, L. B. G., Matthews, H. E., Mitchell, G. F., Moriarty-Schieven, G. H., & Pudritz, R. E. 1999, ApJ, 513, L139
- Young et al. (2004) Young, C. H., Jørgensen, J. K., Shirley, Y. L., Kauffmann, J., Huard, T., Lai, S.-P., Lee, C. W., Crapsi, A., Bourke, T. L., Dullemond, C. P., Brooke, T. Y., Porras, A., Spiesman, W., Allen, L. E., Blake, G. A., Evans, II, N. J., Harvey, P. M., Koerner, D. W., Mundy, L. G., Myers, P. C., Padgett, D. L., Sargent, A. I., Stapelfeldt, K. R., van Dishoeck, E. F., Bertoldi, F., Chapman, N., Cieza, L., DeVries, C. H., Ridge, N. A., & Wahhaj, Z. 2004, ApJS, 154, 396
- Zapata et al. (2013) Zapata, L. A., Loinard, L., Rodríguez, L. F., Hernández-Hernández, V., Takahashi, S., Trejo, A., & Parise, B. 2013, ApJ, 764, L14