On the missing second generation AGB stars in NGC 6752
In recent years the view of Galactic globular clusters as simple stellar populations has changed dramatically, as it is now thought that basically all globular clusters host multiple stellar populations, each with its own chemical abundance pattern and colour-magnitude diagram sequence. Recent spectroscopic observations of asymptotic giant branch stars in the globular cluster NGC 6752 have disclosed a low [Na/Fe] abundance for the whole sample, suggesting that they are all first-generation stars, and that all second-generation stars fail to reach the AGB in this cluster. A scenario proposed to explain these observations invokes strong mass loss in second-generation horizontal branch stars –all located at the hot side of the blue and extended horizontal branch of this cluster– possibly induced by the metal enhancement associated to radiative levitation. This enhanced mass loss would prevent second generation stars from reaching the asymptotic giant branch phase, thus explaining at the same time the low value of the ratio between horizontal branch and asymptotic giant branch stars (the parameter) observed in NGC6752. We have critically discussed this mass-loss scenario, finding that the required mass-loss rates are of the order of , significantly higher than current theoretical and empirical constraints. By making use of synthetic horizontal branch simulations, we demonstrate that our modelling predicts correctly the parameter for NGC6752, without the need to invoke very efficient mass loss during the core He-burning stage. As a test of our stellar models we show that we can reproduce the observed value of for both M3, a cluster of approximately the same metallicity and with a redder horizontal branch morphology, and M13, a cluster with an horizontal branch very similar to NGC6752. Our simulations for NGC6752 horizontal branch predict however the presence of a significant fraction - at the level of % - second generation stars along the cluster asymptotic giant branch. We conclude that there is no simple explanation for the lack of second generation stars in the spectroscopically surveyed sample, although the interplay between mass loss (with low rates) and radiative levitation may play a role in explaining this puzzle.
Key Words.:
stars: abundances – stars: horizontal-branch – stars: AGB and post-AGB – globular clusters: general – globular clusters: individual: NGC67521 Introduction
In the last decade, the ‘classical’view of Galactic globular clusters (GGCs) as simple (single-age, single initial chemical composition) stellar populations has changed, thanks to a large body of photometric and spectroscopic observations (see, e.g., Gratton et al. 2012; Piotto et al. 2012, and references therein for reviews). We now know that probably all GGCs host multiple stellar populations, each one with its own chemical abundance pattern. A typical GGC is populated by a stellar component born with the standard -enhanced metal distribution typical of the halo field population, plus additional sub-populations displaying light element (anti-)correlations, that is, a range of C and O (sometimes also Mg) depletions, together with N and Na (sometimes also Al) enhancements. These additional sub-populations are characterized also by moderate (sometime large) helium enhancements (see, i.e., Milone et al. 2014). Depending on the photometric filters (see, i.e., Sbordone et al. 2011; Cassisi et al. 2013), the cluster sub-populations may lie onto separate sequences in the colour-magnitude diagrams (CMDs), due to the effect of the multiple abundance distributions on isochrones and/or bolometric corrections. This broad picture is nowadays denoted as the globular cluster ‘multiple population phenomenon’.
The main scenarios devised to explain the formation of sub-populations within individual clusters (see, e.g. Decressin et al. 2007; de Mink et al. 2009; D’Ercole et al. 2011; Conroy & Spergel 2011; Valcarce & Catelan 2011) assume that the chemical patterns are produced by multiple star formation episodes during the early stages of the cluster evolution. After the formation of a first generation (FG) of stars with metal abundance ratios (and He abundance) typical of the halo field population, successive generations (SG stars) originate from matter ejected by preexisting FG stars (polluters) – massive asymptotic giant branch stars or massive stars – diluted with material of FG composition not yet involved in star formation episodes. A different scenario proposed recently by Bastian et al. (2013) assumes instead that stars with SG composition are actually FG low mass stars polluted during their fully convective pre-main sequence phase (pre-MS – hence their chemical composition at the beginning of the MS is essentially uniform, like the multiple star formation scenario) by the ejecta of short-lived massive stars. Throughout the paper we denote as FG stars the cluster sub-population with metal mixture and He abundances typical of the Galactic halo field population, and as SG stars the other populations, irrespective of their origin.
Tracing the distribution of SG stars along the observed cluster CMDs is very important to both study the evolutionary properties of SG stars, and shed more light on their formation and the nature of the polluters.
One striking feature of SG stars is, at least in some clusters, the difference between the number ratios of SG to FG objects along the asymptotic giant branch (AGB) and the red giant branch (RGB). While stars with very strong CN bands –a signature, together with high-Na and low-O abundances, of SG composition– are abundant along the RGB of any GGC, the majority of AGB stars in these clusters usually seem to be FG objects. This early discovery by Norris et al. (1981) has been confirmed by more recent investigations (Campbell et al. 2010; Gratton et al. 2010). Using spectroscopic measurements of Na, Campbell et al. (2013) have found no SG stars in a sample of AGB stars hosted by NGC6752. On the other hand, in clusters such as M 5 (Smith & Norris 1993) and possibly 47 Tuc (Campbell et al. 2006), CN-strong/Na-rich AGB stars have been observed, and the discrepancy with the ratios observed along the RGB is probably not large. It is evident that additional observational effort has to be devoted to this issue.
Recently, an attempt to connect the lower incidence of SG stars along the AGB to the multiple population phenomenon has been made by Gratton et al. (2010) (but see also the pioneering works by Norris et al. 1981; Norris 1981). These authors found a correlation between the relative frequency of AGB stars and the minimum mass of stars along the horizontal branch (HB) in a given cluster (that is a ‘proxy’ of the maximum effective temperature along the HB, and hence of the HB morphology), with a further dependence on the cluster metallicity. Clusters with the lowest number ratio of AGB to HB stars (the so called parameter, Caputo et al. (1989)) are those with the bluest HB morphology. In fact, objects with extended HB blue tails like NGC 2808 and NGC 2419 display the lowest values, e.g. , to be compared with typical values 0.12 for redder morphologies (see e.g. Sandquist 2000), and the very high for M5 (Sandquist & Bolte 2004).
To connect this result to the cluster multiple populations, we recall that moving towards the blue side of the HB (e.g. towards lower masses) when the evolving mass drops below 0.6 (the exact value depending on the initial chemical composition) the ratio of HB to AGB timescales increases steadily, until reaching a minimum HB mass (equal to about 0.5 ) below which stars do not evolve to the AGB phase – the so-called AGB-manqué objects – (Greggio & Renzini 1990; Dorman et al. 1993). After central-He exhaustion these stars move to the white dwarf cooling sequence. SG stars are indeed expected to have a lower mass along the HB due to the fact that they are typically He-enhanced, hence they are originated by RGB stars with a lower mass (at a given age, He-enhanced stars have shorter main sequence lifetimes) and end up with a –on average– lower mass along the HB if the RGB mass loss is approximately the same for FG and SG sub-populations (see, e.g. D’Antona et al. 2002; Dalessandro et al. 2011, 2013; Gratton et al. 2011; Marino et al. 2011, 2014, and references therein for a more detailed explanations). One expects therefore that the AGB of clusters with a blue HB should lack at least part of the SG component, compared to what is seen along the previous RGB phase.
In this paper we have studied in detail the case of the AGB population of NGC6752, in light of the recent results by Campbell et al. (2013). These authors have performed an accurate spectroscopic analysis of both RGB and AGB stars, determining Na abundances. As also stated by these authors, Na abundance estimates in cool giants should be more robust than other light elements such as C and N, because they are less affected by molecular band formation and surface gravity estimates, and/or by the possibility of in situ variations due to evolutionary process(es) (see, e.g. Norris et al. 1981; Salaris et al. 2002; Denissenkov et al. 2014, and references therein). Campbell et al. (2013) found that all 20 AGB stars in their sample display Na abundances typical of FG stars. To explain the lack of SG AGB stars and the observed low value of (), these authors envisaged the following scenario. All FG stars populate the redder side of the observed HB, and all objects hotter than 11500 K –the so-called Grundahl’s jump (Grundahl et al. 1999), corresponding to the observed effective temperature of the onset of radiative levitation for HB stars– miss the AGB phase, even though standard stellar evolution predicts that at the cluster metallicity only stars evolving on the HB at larger than 24000 K do skip this phase (Dorman et al. 1993; Pietrinferni et al. 2004).
The implication is that objects in the range between 11500 K and at least 24000 K, must have lost mass very efficiently during the HB phase, to avoid the AGB phase. We note that the effect of an efficient mass loss during the HB evolution has been already explored in previous analyses (see, e.g. Yong et al. 2000, and references therein). By employing the Reimers (Reimers 1975) mass loss law, Campbell et al. (2013) estimated a value for the free parameter 10 to explain the lack of SG stars along the AGB, an enhancement of a factor 20 compared to the standard value used in the calculation of RGB models. Such an enhancement compared to standard values of is tentatively attributed to the metal enhancement in the envelopes of these stars, caused by radiative levitation (see, e.g., Michaud et al. 2008). If the evolution of NGC6752 HB stars is ‘typical’ of GGCs with long blue HB tails, this scenario implies that a cluster like M13, with a very similar HB morphology, [Fe/H] and age, should display the same lack of SG stars along the AGB.
In this analysis we have first revisited the HB mass loss scenario discussed by Campbell et al. (2013), considering additional constraints from independent theoretical considerations and observations (Section 2). As a second step, we have performed synthetic HB modelling, using canonical HB models without mass loss during the core He-burning stage, to establish more accurately whether the observed low value of does really require very efficient mass loss along the HB. We have then studied the AGB population in our synthetic samples, to check its expected composition in terms of FG and SG components (Section 3). We conclude with a discussion of the results and a comparison with the abundances measured in M13, a cluster whose properties are very similar to those of NGC 6752 (Section 4).
2 Mass loss on the hot HB
In the scenario envisaged by Campbell et al. (2013), all NGC6752 HB stars hotter than K fail to reach the AGB due to enhanced mass loss, possibly associated to the surface metal enhancement caused by radiative levitation. This temperature is assumed to mark the transition between FG and SG stars along the cluster HB, consistent with spectroscopic measurements (Villanova et al. 2009) of nine HB stars in the range between K and K, that show how all objects but one have [Na/Fe] ratios typical of FG stars, and the average He abundance is consistent also with the FG component.
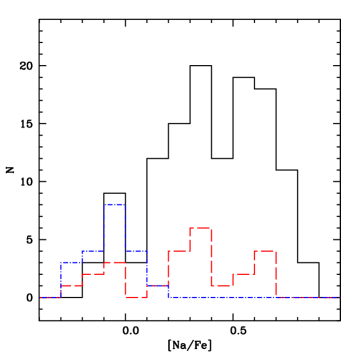
As discussed in the introduction, this enhanced mass loss efficiency is invoked by Campbell et al. (2013) to explain both the observed low value of , and the observed [Na/Fe] distribution along the AGB when compared to the RGB counterpart, as displayed by Fig. 1. In the same figure we have shown also the [Na/Fe] RGB distribution determined by Carretta et al. (2007) with a larger sample of stars. A Kolmogorov-Smirnov test shows that the two RGB abundance distributions determined by Campbell et al. (2013) and Carretta et al. (2007) are statistically consistent. The three ’peaks‘ in the histogram of the RGB abundances correspond to [Na/Fe]0.05 (FG), +0.35 and +0.60 (both SG), respectively, and can be nicely associated on a one-to-one basis to the components of the cluster triple MS discovered by Milone et al. (2013). It is very clear that the AGB abundances match the distribution of the lowest peak of the RGB Na distribution, corresponding to the FG composition.
Regarding the overall fraction and He abundance of SG stars in the cluster, the photometric analysis by Milone et al. (2013) revealed the presence of a triple MS with a ‘normal’ cosmological Y0.245 (the FG component), Y0.254 and 0.27-0.28 respectively, these latter two sequences being identified as the SG component. The number ratios among the three populations, that could be traced also along sub-giant branch and RGB are approximately 30:40:30, that correspond to a 70% fraction of SG stars. This fraction is consistent with the RGB distribution of Na, displayed in Fig. 1. Milone et al. (2013) do not find any evidence radial gradients of the population ratios out to about 2.5 half-mass radii.
Our first test was to revisit Campbell et al. (2013) results about the required efficiency of the Reimers mass loss law to deplete the AGB population of NGC6752. To this purpose, we have calculated -enhanced ([/Fe]=0.4) HB models with Y=0.273, Z=0.001 –corresponding to [Fe/H]1.6, consistent with the spectroscopic estimate [Fe/H]=1.56 reported by Carretta et al. (2010), and He-abundance appropriate for the more He-rich SG population of NGC6752– for a large range of masses, with the same code, input physics, metal mixture and procedures of the BaSTI database (Pietrinferni et al. 2006) 111The whole BaSTI library is available at the URL: http://www.oa-teramo.inaf.it/BASTI.. From the BaSTI database we have considered a set of enhanced HB stellar models for Y=0.246, Z=0.001, the counterpart of the FG cluster composition, that will be used later on in the next section222Although SG stars appear to be O-depleted compared to the FG counterpart, as long as the sum is kept constant, the evolutionary and structural properties of HB stars are barely affected (Pietrinferni et al. 2009). Given that SG stars in NGC 6752 do not show any evidence of CNO enhancement (Carretta et al. 2005; Yong et al. 2013), our assumption of adopting the same enhanced mixture for stellar models representing both FG and SG stars is justified.
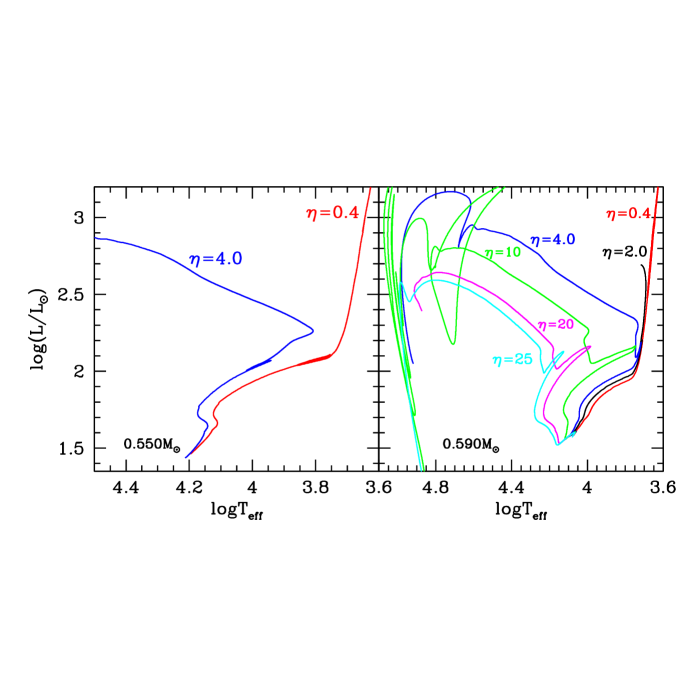
From the calculations with Y=0.273 we singled out the track with mass equal to , whose Zero Age HB (ZAHB) is 11500 K –corresponding to the Grundahl’s jump– and a hotter one of , with ZAHB 16000 K. For these two masses we computed additional models considering the Reimers mass loss law with several choices of the free parameter . The Hertzsprung-Russell (H-R) diagrams of the resulting evolutionary tracks are displayed in Fig. 2
The tracks reach the AGB for increasing up to 2.0. This latter model climbs the AGB to a luminosity , before moving towards the hot side of the H-R diagram. The track with barely reaches the AGB stage, whereas for the track behaves as an AGB-manqué star. Typical mass loss rates for the tracks with are a few times .
As for the hotter models, the tracks become AGB-manqué for . Also in this case the critical mass loss rates are a few times . These ‘threshold’ values of are a factor 10-25 higher than the typical values adopted for RGB evolutionary calculations with mass loss (see i.e. Pietrinferni et al. 2004, 2006; Campbell et al. 2013). In fact, employing such high values of would prevent RGB models from experiencing the He-flash (Castellani & Castellani 1993).
Our results are qualitatively in agreement with those obtained by Campbell et al. (2013), even though these latter authors considered a more massive HB model with a higher Y. These mass loss rates are however much larger than constraints from the more physically motivated mass loss law by Vink & Cassisi (2002). These authors computed HB mass-loss rates under the hypothesis that radiation pressure on spectral lines drives a stellar wind during the He-burning stage; their mass loss law333, where is in Kelvin, and the other symbols have their usual meaning. is expected to be much more appropriate for HB models than the Reimers formula, and is applicable in the range between 12500 and 35000 K. The predicted rates are 2-3 orders of magnitude lower than required. Even considering solar surface abundances for the HB models, to mimic the effect of radiative levitation444Spectroscopic analyses (see e.g. Behr 2003; Pace et al. 2006) have shown that iron and other heavy elements such as Ti and Cr can reach values around solar or even higher, as a consequence of radiative levitation in the atmosphere we found that the rates predicted by Vink & Cassisi (2002) equation must be increased by a factor 20-50 (depending on the mass of the HB model) in order to attain the mass loss efficiency required to force a HB star to miss the AGB stage.
There are also some independent constraints on the efficiency of mass loss in HB stars, albeit for very hot objects, in a range where models at constant mass already skip the AGB. The constraints arise from the fact that mass loss affects the efficiency of atomic diffusion and radiative levitation, and mass loss rates too high would produce surface abundances inconsistent with observations. Michaud et al. (2011) considered a HB model with K and determined that mass loss rates compatible with the observed abundances for these stars can not be larger than . Another independent constraint on the mass loss efficiency in hot HB stars come from the evidence that some sdB stars undergo non radial pulsations. A recent analysis (see Hu et al. 2011, and references therein) shows that, if mass loss is efficient in these objects, the rates cannot by larger than , otherwise the driving mechanism of the pulsations (an opacity-driven mechanism enabled by Fe that accumulate diffusively in the stellar envelope) would not work. Assuming the mass loss scaling (rather than the absolute values) along the HB predicted by Vink & Cassisi (2002) is correct, the expected variation between temperatures of the order of 30000 K and 12000 K is within a factor 2-3. In conclusion, the huge mass loss rates required to force all HB stars with ZAHB location hotter than K to miss the AGB stage seem to be disfavoured by the previous theoretical and observational considerations. In any case, additional work on both the theoretical and observational side has to be done in order to settle this issue.
3 Synthetic HB simulations
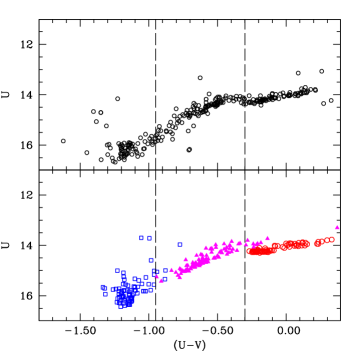
With the goal to determine whether the observed value of is consistent with a large fraction of HB stars missing the AGB, we have performed an analysis based on synthetic HB calculations (see, e.g., Rood 1973; Catelan 1993, for details about this technique), made with the code described by Dalessandro et al. (2013). As observational counterpart we have considered the UV CMD by Momany et al. (2002), whose HB (cleared of the field contamination) is displayed in Fig. 3. The shape of the cluster blue HB in the U-(U-V) CMD is more sensitive to the He-abundance than ‘classical’optical CMDs. As for the theoretical models, we have employed BaSTI -enhanced HB tracks for Z=0.001, with Y=0.246 and Y=0.273, described in the previous section. We are assuming that the age of SG and FG stars is the same, equal to Gyr. This assumption is appropriate because studies of multiple populations in GGCs have shown that age differences between FG and SG stars is at most of the order of 100 Myr (see, e.g. Cassisi et al. 2008; Marino et al. 2012, and references therein). The precise value of this common age is also not crucial, because a different absolute age would simply cause a variation of the RGB mass loss required to reproduce the observed mass distribution along the HB. The input physics of BaSTI models is detailed in Pietrinferni et al. (2004) and references therein. Crucial to the prediction of HB and AGB evolutionary timescales is the treatment of core mixing during central He-burning. Our models include semiconvection with breathing pulses suppressed (see Pietrinferni et al. 2004, and references therein). Notice how also very recently Gabriel et al. (2014) have shown that the inclusion of semiconvection in the calculation of HB models (that extends the He-burning lifetime and the final He-depleted core mass) seems to be an adequate approach to treat core mixing during central He-burning. As for the breathing pulses (a mixing instability occurring at the boundary of the convective core when central He is substantially depleted), the analysis by Cassisi et al. (2001) shows that their inclusion would smooth out the AGB clump, at odds with the observations, that display very concentrated and prominent AGB clumps in well populated photometries of GGCs (see, e.g., M3 and 47Tuc photometries by Buonanno et al. 1994; Beccari et al. 2006, respectively, as just two examples). As discussed by Cassisi et al. (2003), the different techniques available to suppress this instability do not affect the predicted value of . In general, the inclusion of breathing pulses would decrease the predicted value of by 30% for models at the red side of the HB.
Once the mixing treatment is fixed, the main source of uncertainty in the predicted values is given by the current uncertainty in the , that affect this parameter at the level of 0.01.
Detailed analyses of the uncertainties affecting He-burning, low-mass stellar models can be found in Cassisi et al. (1998, 1999, 2001, 2003, 2007) and reference therein.
As described before, we considered HB models with two values of Y; synthetic stars with intermediate values of the initial He mass fraction were obtained by interpolation during the synthetic HB calculations. The BaSTI HB tracks include also the AGB evolution until the first thermal pulse (TP); given that in low mass stars the TP lifetime is largely negligible compared to the AGB timescales before the first TP (see e.g. the recent AGB calculations by Weiss & Ferguson 2009, for the case of 1.0 models at various metallicities), our simulations can predict consistently the value of for a given HB morphology. SG stars with enhanced He are represented by models with standard FG chemical composition and the appropriate He abundance.
To account for the effect of radiative levitation in the stellar atmospheres, that affects stars hotter than the Grundahl’s jump, we have applied to the bolometric luminosities predicted by the models, bolometric corrections to the U and V photometric bands for [Fe/H]=0.0 (and scaled-solar mixture) when is above 12000 K555Only the morphology of the evolutionary tracks is affected by the choice of the bolometric corrections, as shown in Fig. 7 of Dalessandro et al. (2011), not the evolutionary timescales.. This is a crude approximation, due to the lack of extended grids of both stellar evolution and atmosphere models with a large range of chemical compositions, that include consistently the effect of radiative levitation during the whole HB evolution. However, the use of this approximation in synthetic HB modelling has allowed Dalessandro et al. (2011) to recover the different magnitude levels of NGC 2808 sub-populations with the three He-abundances inferred from the multimodal main sequence, in optical-ultraviolet CMDs of the HB. Also, the distribution of NGC 2808 extreme HB stars determined from the simulations was found in good agreement with the spectroscopic estimates by Moehler et al. (2004) As shown by Fig. 3, we divided the observed CMD of the cluster HB into three boxes, with (red box) , (intermediate box), and (blue box). The blue edge of the red box corresponds approximately to the colour of the Grundahl’s jump, while the blue edge of the intermediate box is chosen to have approximately 30:40:30 number ratios of HB stars in the three regions (red:intermediate:blue), the same as the estimated ratios of the three cluster sub-populations (in order of increasing Y) along MS and RGB, that we use as input.
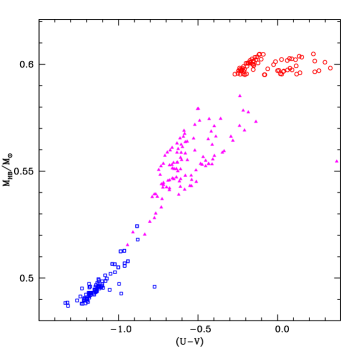
In our modelling we assumed that stars belonging to the three sub-populations are fed at a continuous rate onto the HB (see, e.g., Rood 1973), and that the FG component is located in the red box, consistent with spectroscopic observations. The slope of the observed HB in the intermediate box is sensitive to Y, and is consistent with the location of synthetic stars from the SG component with Y=0.254. As a consequence, the most He-enriched stars must be largely confined to the blue box. With these constraints on the simulations, the relative number of stars in the different boxes, plus the magnitude and colour location of the HB were reproduced with E(B-V)=0.03 (consistent with E(B-V)=0.040.005 and systematic error of 0.011, as estimated by Gratton et al. 2003), =13.12 (consistent, i.e., with the cluster white dwarf distance by Renzini et al. 1996) and the mass distribution displayed in Fig. 4. The simulations have included also a Gaussian random photometric error whose mean value for the various filters was taken from Momany et al. (2002) photometry.
Figure 3 shows one realization of the HB, with the number of synthetic stars (275) equal to the one in Momany et al. (2002) photometry. As discussed before, empirical and theoretical constraints dictate that the three components should mainly populate separate regions, and in this synthetic CMD only evolved SG stars cross the boundaries between boxes, causing just a minor ‘contamination’ of the neighbouring population.
Assuming a common age of 12.5 Gyr, the mass distribution of Fig. 4 corresponds to the following total RGB mass loss () for the FG and SG populations:
-
1.
FG – ranging from 0.180 to 0.190 with a flat probability distribution;
-
2.
SG, Y=0.254 – =(0.220 0.014) with a Gaussian probability distribution;
-
3.
SG, Y=0.273 – =(0.2820.002) Gaussian for 80% of stars, and - 0.2680.006 for 20% of stars.
Small variations of this age and/or possible small age differences between FG and SG stars will affect the values necessary to reproduce the mass distribution of Fig. 4. For example, an age change by 0.5 Gyr around 12.5 Gyr changes the evolving RGB mass by 0.01 .
It is obvious from Fig. 3 that an exact match of the observed colour (hence mass) distribution of HB stars within each box would require (especially in the intermediate and blue box) more complex mass loss laws. There is no ‘a priori’ reason why a simple flat or Gaussian probability distribution should represent the correct mathematical form of the total RGB mass loss, but on the other hand they provide an approximation that is sufficient for most purposes. In fact, the value of the parameter we obtained from our simulations is basically unaffected (changes by less than 0.01) by modifying the mass distributions within each box, i.e. varying slightly the mean value and/or the spread of the Gaussian distributions, or switching from Gaussian to flat distribution, while keeping unchanged the number of objects within each box.
Simulations with a large total number of HB stars (about 50 times the observed number in our adopted photometry) provide =0.07, in very good agreement with the observed =0.060.02 (see data in Table 1 of Sandquist 2000). When considering multiple realizations of the HB with the same number of stars in Momany et al. (2002), we obtain statistical variations of –due to small number statistics– of about 0.01 around =0.07. Coincidentally, for the number of HB stars in our adopted CMD, one expects a number of AGB stars approximately equal to the number sampled spectroscopically by Campbell et al. (2013).
This agreement with our models at constant mass disfavours the possibility that a large number of stars miss the AGB phase due to mass loss during the core He-burning stage, apart from the bluest object that ‘naturally’ skip the AGB. In the hypothesis that all SG stars along the HB miss the AGB phase, our simulations predict a too small value =0.03. The agreement with the observed value of comes instead from the decreasing ratio between AGB and HB lifetimes when moving towards the blue side of the HB. This is shown clearly by Fig. 5, that displays the ratio of AGB to HB lifetimes for the models used in our simulations. Notice the steep drop below 0.56-0.58 –for the sake of comparison the upper mass limit in the synthetic CMD is 0.6, see Fig. 4. In this region the lifetime ratio is independent of the composition. He-rich models have slightly higher ratios above this mass threshold, because of a more efficient H-burning shell during HB phase.

As a test, we have calculated a well populated synthetic HB with the parameters listed above, considering just the FG component. We obtained in this case =0.11. The same test considering only the SG population with Y=0.254 provided =0.09, while the case with just the SG population with Y=0.273 gave =0.02. The progression towards decreasing values of when considering increasingly bluer morphologies is clear. It is important to notice that all stars belonging to the SG population with Y=0.254 are expected to evolve to the AGB. All stars predicted to miss the AGB belong to the SG population with Y=0.273; however, also a very small fraction of this population is expected to evolve to the AGB.
By examining the AGB population in our simulations we found that about 50% of the stars belong to the FG, and about 50% to the SG sub-population with Y=0.254. From multiple synthetic realizations of the HB we determined a probability of only 60% to find a single AGB star belonging to the SG with Y=0.273 within a sample of 20 AGB objects, i.e. the size of Campbell et al. (2013) AGB sample.
We close this section by recalling that also the recent study by Charbonnel et al. (2013) considered the enhanced initial He in SG stars as the likely explanation for the results by Campbell et al. (2013). The authors however did not perform any detailed synthetic HB simulations and employed a somewhat larger He-abundance range in SG stars compared to the current observational constraints (see also their discussion on this subject).
3.1 Consistency checks
To establish whether our theoretical predictions of are biased by possible systematic errors in the evolutionary lifetimes predicted by the HB tracks hence the agreement with NGC6752 is just fortuitous, we have performed additional tests. The most important one was to check whether our simulations are able to reproduce the value of also for a cluster with a redder morphology, for which one expects all HB stars to end up evolving along the AGB. To this purpose we examined the detailed simulations of the HB of M3 –a cluster with metallicity very similar to NGC 6752 but with essentially all HB stars cooler than the Grundahl’s jump– presented in Dalessandro et al. (2013), obtained with the same evolutionary tracks and code employed here. The work by Dalessandro et al. (2013) makes use of far-ultraviolet(UV)/optical colour-magnitude diagrams for clusters with extended HBs, that enable to estimate the initial He abundance along the HB blue-tails. This is because in UV filters the HB becomes almost horizontal at high effective temperatures, and He variations cause variations of the UV magnitude levels (see Dalessandro et al. 2011, 2013, for details).
The analysis by Cho et al. (2005) determined an observed value =0.120.03 for M3 (we estimated the error bar on using Poisson statistics). The simulations by Dalessandro et al. (2013) match the observed stellar distribution and magnitude levels along the cluster HB with a range of initial Y abundances equal to 0.02, starting from a minimum Y=0.246. From these simulations we derived =0.11, in agreement with the observed value.
We have then considered another cluster with an extended blue HB and basically the same metallicity and age as NGC6752, namely M13 (see e.g. Dalessandro et al. 2013, and references therein). The HB ratio, –where B, V and R are the number of stars at the blue side, within, and at the red side of the RR Lyrae instability strip, respectively– is 0.97 for M 13 and 1.0 for NGC 6752 (see e.g. Carretta et al. 2007).
The study by Cho et al. (2005) derived , consistent with the result for NGC 6752. Our detailed simulations for this cluster HB have been discussed by Dalessandro et al. (2013), who estimated a range of initial Y from 0.246 up to 0.31. This inferred higher range of Y values compared to NGC6752 is consistent with the fact that M13 displays a larger range of Na abundances. The simulations provide obtained =0.06 (as for NGC6752) again in very good agreement with the observations.
The study by Cho et al. (2005) provides also another very interesting test for the evolutionary timescales of the models. These authors determined (we calculated the error bar from Poisson statistics) when considering all AGB stars but only the reddest component along the HB – e.g. all HB stars located at roughly lower than the Grundahl’s jump location. On the simulation side, this reddest HB component corresponds to the synthetic HB stars with Y below 0.26 in the analysis by Dalessandro et al. (2013). Restricting the synthetic HB population to this component, while keeping the full AGB population, the simulations provide =0.15, again in agreement with observations. It is worth noticing that, within this test, if synthetic stars with Y higher than 0.26 (all HB stars hotter than the Grundahl’s jump) do not contribute to the AGB population, the simulations would give =0.11, much lower than the value observed. Unfortunately the large statistical error on the observed of this test provides only an additional qualitative indication that HB models at this metallicity predict values consistent with observations.
4 Discussion and conclusions
In this paper we have explored the scenario proposed by Campbell et al. (2013) to explain the [Na/Fe] abundances measured along the AGB of NGC6752, and the low value of the parameter, that envisages strong mass loss for all SG HB stars (located at hotter than the temperature for the onset of radiative levitation), that prevents their evolution to the AGB. We have found that the required mass loss rates are of the order of , much higher than current empirical and theoretical constraints.
Our synthetic modelling –with our adopted stellar models– of the observed HB has provided a value of consistent with the observations. Imposing that SG stars do not reach the AGB phase would produce a value of too low compared to the observed one. Consistent synthetic HB analyses of M3 (a cluster with the same metallicity, age but a much redder HB morphology) and M13 (a cluster with also almost the same HB morphology of NGC6752) provide values again in agreement with observations. As a conclusion, our HB models predict correctly , at least at the metallicity of NGC6752, and no strong mass loss during the core He-burning stage is required to reproduce the observed cluster .
The HB simulations also predict that for the size of NGC6752 spectroscopic AGB sample, about 50% of the population is made of FG stars, and the rest belongs to the SG population with the lower Y mass fraction. The theoretical prediction that SG stars populate the AGB is consistent with the spectroscopic analysis by Villanova et al. (2009), who found in their small sample of HB stars cooler than the Grundahl’s jump, one object with high Na, brighter than the bulk of the HB stars. This object can be understood as an evolved HB SG star, that is moving towards the AGB. The presence of some evolved SG stars at below the Grundahl’s jump is expected from the HB simulations (see Fig. 3).
On the other hand, only FG stars are observed in the AGB sample analyzed spectroscopically (see Fig. 1). This is hard to explain, given the indications presented in this paper against the hypothesised enhanced mass loss. The situation gets even more puzzling when considering the results for AGB stars in M13. The spectroscopic analysis of a sample of its AGB and RGB stars by Johnson & Pilachowski (2012) shows that the AGB stars span almost the whole range of [Na/Fe] values covered by RGB stars. There is no indication that only FG stars inhabit the AGB. Given the close similarity of M13 and NGC6752 in terms also of the HB morphology, it is difficult to find a mechanism to deplete SG AGB stars that works in NGC6752 but not in M13.
We conclude mentioning a final point that may be relevant to this issue. Campbell et al. (2013) measured Na abundances in RGB and AGB stars, and derived [Na/Fe] ratios by considering a uniform [Fe/H] value for all stars, as determined in the literature on RGB stars. In case of M13, Johnson & Pilachowski (2012) determined both Na and Fe abundances for their AGB stars. What would be important to consider is the effect of the interplay between radiative levitation and mass loss. For example, Michaud et al. (2011) show that both Na and Fe are strongly enhanced in the outer layers of a 0.59 (initial Z=0.0001) HB model at 14000 K. If mass loss is efficient even only at the low level required to preserve the efficiency of radiative levitation, some amount of Na and Fe is certainly lost from the star. When convection homogenises the remaining envelope on the AGB, the surface abundances of these two elements will be depleted to some degree (maybe negligible) compared to the RGB abundances. If both Na and Fe are depleted by roughly the same amount, the measured [Na/Fe] on the AGB should reflect the original ratios along the RGB. If however only Na is measured and Fe is assumed equal to the RGB values, one may in principle underestimate the AGB [Na/Fe] ratio for objects affected by radiative levitation along the HB (as it is the case of SG stars in NGC6752 and M13).
At the moment there are no available calculations of the full evolution from the HB to the AGB, self-consistently accounting for diffusion and radiative levitation, and mass loss. It would be certainly important to attempt these computations, with the aim of establishing whether the interplay between radiative levitation and mass loss plays a major role in explaining the puzzling chemical composition of AGB stars in NGC6752 and the difference with M13.
Acknowledgements.
We warmly thank R. Gratton for the very useful suggestions and discussions about uncertainties of light element spectroscopy in globular cluster cool giants. SC acknowledges financial support from PRIN-INAF 2011 ”Multiple Populations in Globular Clusters: their role in the Galaxy assembly” (PI: E. Carretta), and from PRIN MIUR 2010-2011, project ‘The Chemical and Dynamical Evolution of the Milky Way and Local Group Galaxies’, prot. 2010LY5N2T (PI: F. Matteucci).References
- Bastian et al. (2013) Bastian, N., Lamers, H. J. G. L. M., de Mink, S. E., et al. 2013, MNRAS, 436, 2398
- Beccari et al. (2006) Beccari, G., Ferraro, F. R., Lanzoni, B., & Bellazzini, M. 2006, ApJ, 652, L121
- Behr (2003) Behr, B. B. 2003, ApJS, 149, 67
- Buonanno et al. (1994) Buonanno, R., Corsi, C. E., Buzzoni, A., et al. 1994, A&A, 290, 69
- Campbell et al. (2013) Campbell, S. W., D’Orazi, V., Yong, D., et al. 2013, Nature, 498, 198
- Campbell et al. (2006) Campbell, S. W., Lattanzio, J. C., & Elliott, L. M. 2006, Mem. Soc. Astron. Italiana, 77, 864
- Campbell et al. (2010) Campbell, S. W., Yong, D., Wylie-de Boer, E. C., et al. 2010, Mem. Soc. Astron. Italiana, 81, 1004
- Caputo et al. (1989) Caputo, F., Tornambe, A., & Castellani, V. 1989, A&A, 222, 121
- Carretta et al. (2007) Carretta, E., Bragaglia, A., Gratton, R. G., Lucatello, S., & Momany, Y. 2007, A&A, 464, 927
- Carretta et al. (2010) Carretta, E., Bragaglia, A., Gratton, R. G., et al. 2010, A&A, 516, A55
- Carretta et al. (2005) Carretta, E., Gratton, R. G., Lucatello, S., Bragaglia, A., & Bonifacio, P. 2005, A&A, 433, 597
- Cassisi et al. (2001) Cassisi, S., Castellani, V., Degl’Innocenti, S., Piotto, G., & Salaris, M. 2001, A&A, 366, 578
- Cassisi et al. (1999) Cassisi, S., Castellani, V., degl’Innocenti, S., Salaris, M., & Weiss, A. 1999, A&AS, 134, 103
- Cassisi et al. (1998) Cassisi, S., Castellani, V., degl’Innocenti, S., & Weiss, A. 1998, A&AS, 129, 267
- Cassisi et al. (2013) Cassisi, S., Mucciarelli, A., Pietrinferni, A., Salaris, M., & Ferguson, J. 2013, A&A, 554, A19
- Cassisi et al. (2007) Cassisi, S., Potekhin, A. Y., Pietrinferni, A., Catelan, M., & Salaris, M. 2007, ApJ, 661, 1094
- Cassisi et al. (2003) Cassisi, S., Salaris, M., & Irwin, A. W. 2003, ApJ, 588, 862
- Cassisi et al. (2008) Cassisi, S., Salaris, M., Pietrinferni, A., et al. 2008, ApJ, 672, L115
- Castellani & Castellani (1993) Castellani, M. & Castellani, V. 1993, ApJ, 407, 649
- Catelan (1993) Catelan, M. 1993, A&AS, 98, 547
- Charbonnel et al. (2013) Charbonnel, C., Chantereau, W., Decressin, T., Meynet, G., & Schaerer, D. 2013, A&A, 557, L17
- Cho et al. (2005) Cho, D.-H., Lee, S.-G., Jeon, Y.-B., & Sim, K. J. 2005, AJ, 129, 1922
- Conroy & Spergel (2011) Conroy, C. & Spergel, D. N. 2011, ApJ, 726, 36
- Dalessandro et al. (2011) Dalessandro, E., Salaris, M., Ferraro, F. R., et al. 2011, MNRAS, 410, 694
- Dalessandro et al. (2013) Dalessandro, E., Salaris, M., Ferraro, F. R., Mucciarelli, A., & Cassisi, S. 2013, MNRAS, 430, 459
- D’Antona et al. (2002) D’Antona, F., Caloi, V., Montalbán, J., Ventura, P., & Gratton, R. 2002, A&A, 395, 69
- de Mink et al. (2009) de Mink, S. E., Pols, O. R., Langer, N., & Izzard, R. G. 2009, A&A, 507, L1
- Decressin et al. (2007) Decressin, T., Meynet, G., Charbonnel, C., Prantzos, N., & Ekström, S. 2007, A&A, 464, 1029
- Denissenkov et al. (2014) Denissenkov, P., VandenBerg, D., Hartwick, D., et al. 2014, ArXiv e-prints
- D’Ercole et al. (2011) D’Ercole, A., D’Antona, F., & Vesperini, E. 2011, MNRAS, 415, 1304
- Dorman et al. (1993) Dorman, B., Rood, R. T., & O’Connell, R. W. 1993, ApJ, 419, 596
- Gabriel et al. (2014) Gabriel, M., Noels, A., Montalban, J., & Miglio, A. 2014, ArXiv e-prints
- Gratton et al. (2003) Gratton, R. G., Bragaglia, A., Carretta, E., et al. 2003, A&A, 408, 529
- Gratton et al. (2012) Gratton, R. G., Carretta, E., & Bragaglia, A. 2012, A&A Rev., 20, 50
- Gratton et al. (2010) Gratton, R. G., D’Orazi, V., Bragaglia, A., Carretta, E., & Lucatello, S. 2010, A&A, 522, A77
- Gratton et al. (2011) Gratton, R. G., Lucatello, S., Carretta, E., et al. 2011, A&A, 534, A123
- Greggio & Renzini (1990) Greggio, L. & Renzini, A. 1990, ApJ, 364, 35
- Grundahl et al. (1999) Grundahl, F., Catelan, M., Landsman, W. B., Stetson, P. B., & Andersen, M. I. 1999, ApJ, 524, 242
- Hu et al. (2011) Hu, H., Tout, C. A., Glebbeek, E., & Dupret, M.-A. 2011, MNRAS, 418, 195
- Johnson & Pilachowski (2012) Johnson, C. I. & Pilachowski, C. A. 2012, ApJ, 754, L38
- Marino et al. (2014) Marino, A. F., Milone, A. P., Przybilla, N., et al. 2014, MNRAS, 437, 1609
- Marino et al. (2012) Marino, A. F., Milone, A. P., Sneden, C., et al. 2012, A&A, 541, A15
- Marino et al. (2011) Marino, A. F., Villanova, S., Milone, A. P., et al. 2011, ApJ, 730, L16
- Michaud et al. (2008) Michaud, G., Richer, J., & Richard, O. 2008, ApJ, 675, 1223
- Michaud et al. (2011) Michaud, G., Richer, J., & Richard, O. 2011, A&A, 529, A60
- Milone et al. (2014) Milone, A. P., Marino, A. F., Dotter, A., et al. 2014, ApJ, 785, 21
- Milone et al. (2013) Milone, A. P., Marino, A. F., Piotto, G., et al. 2013, ApJ, 767, 120
- Moehler et al. (2004) Moehler, S., Sweigart, A. V., Landsman, W. B., Hammer, N. J., & Dreizler, S. 2004, A&A, 415, 313
- Momany et al. (2002) Momany, Y., Piotto, G., Recio-Blanco, A., et al. 2002, ApJ, 576, L65
- Norris (1981) Norris, J. 1981, ApJ, 248, 177
- Norris et al. (1981) Norris, J., Cottrell, P. L., Freeman, K. C., & Da Costa, G. S. 1981, ApJ, 244, 205
- Pace et al. (2006) Pace, G., Recio-Blanco, A., Piotto, G., & Momany, Y. 2006, A&A, 452, 493
- Pietrinferni et al. (2004) Pietrinferni, A., Cassisi, S., Salaris, M., & Castelli, F. 2004, ApJ, 612, 168
- Pietrinferni et al. (2006) Pietrinferni, A., Cassisi, S., Salaris, M., & Castelli, F. 2006, ApJ, 642, 797
- Pietrinferni et al. (2009) Pietrinferni, A., Cassisi, S., Salaris, M., Percival, S., & Ferguson, J. W. 2009, ApJ, 697, 275
- Piotto et al. (2012) Piotto, G., Milone, A. P., Anderson, J., et al. 2012, ApJ, 760, 39
- Reimers (1975) Reimers, D. 1975, Memoires of the Societe Royale des Sciences de Liege, 8, 369
- Renzini et al. (1996) Renzini, A., Bragaglia, A., Ferraro, F. R., et al. 1996, ApJ, 465, L23
- Rood (1973) Rood, R. T. 1973, ApJ, 184, 815
- Salaris et al. (2002) Salaris, M., Cassisi, S., & Weiss, A. 2002, PASP, 114, 375
- Sandquist (2000) Sandquist, E. L. 2000, MNRAS, 313, 571
- Sandquist & Bolte (2004) Sandquist, E. L. & Bolte, M. 2004, ApJ, 611, 323
- Sbordone et al. (2011) Sbordone, L., Salaris, M., Weiss, A., & Cassisi, S. 2011, A&A, 534, A9
- Smith & Norris (1993) Smith, G. H. & Norris, J. E. 1993, AJ, 105, 173
- Valcarce & Catelan (2011) Valcarce, A. A. R. & Catelan, M. 2011, A&A, 533, A120
- Villanova et al. (2009) Villanova, S., Piotto, G., & Gratton, R. G. 2009, A&A, 499, 755
- Vink & Cassisi (2002) Vink, J. S. & Cassisi, S. 2002, A&A, 392, 553
- Weiss & Ferguson (2009) Weiss, A. & Ferguson, J. W. 2009, A&A, 508, 1343
- Yong et al. (2013) Yong, D., Meléndez, J., Grundahl, F., et al. 2013, MNRAS, 434, 3542
- Yong et al. (2000) Yong, H., Demarque, P., & Yi, S. 2000, ApJ, 539, 928