Techniques and tools for measuring energy efficiency of scientific software applications
Abstract
The scale of scientific High Performance Computing (HPC) and High Throughput Computing (HTC) has increased significantly in recent years, and is becoming sensitive to total energy use and cost. Energy-efficiency has thus become an important concern in scientific fields such as High Energy Physics (HEP). There has been a growing interest in utilizing alternate architectures, such as low power ARM processors, to replace traditional Intel x86 architectures. Nevertheless, even though such solutions have been successfully used in mobile applications with low I/O and memory demands, it is unclear if they are suitable and more energy-efficient in the scientific computing environment. Furthermore, there is a lack of tools and experience to derive and compare power consumption between the architectures for various workloads, and eventually to support software optimizations for energy efficiency. To that end, we have performed several physical and software-based measurements of workloads from HEP applications running on ARM and Intel architectures, and compare their power consumption and performance. We leverage several profiling tools (both in hardware and software) to extract different characteristics of the power use. We report the results of these measurements and the experience gained in developing a set of measurement techniques and profiling tools to accurately assess the power consumption for scientific workloads.
1 Introduction
The Large Hadron Collider (LHC) [1] at the European Laboratory for Particle Physics (CERN) in Geneva, Switzerland, is an example of a scientific project whose computing resource requirements are larger that those likely to provided in a single computer center. Data processing and storage are distributed across the Worldwide LHC Computing Grid (WLCG) [2], which uses resources from 160 computer centers in 35 countries. Such computational resources have enabled the CMS [3] and ATLAS [4] experiments to discover the Higgs Boson [5, 6], for example. The WLHC requires a massive amount of computational resources (250,000 x86 cores in 2012) and, proportionally, energy. In the future, with planned increases to the LHC luminosity [7], the dataset size will increase by 2-3 orders of magnitude, presenting even more challenges in terms of energy consumption.
In order to find and develop better solutions for improving energy efficiency in High Energy Physics (HEP) computing, it is important to understand how energy is used by the HEP systems themselves. We describe several tools and techniques that facilitate researchers to reach that goal.
As energy efficiency becomes a concern, new solutions have been considered to develop energy efficient systems. One potential solution is to replace the traditional Intel x86 architectures by low power architectures such as ARM. A comparison of the energy efficiency between ARMv7 and x86 Intel architecture is conducted in this article. The experiments use CMS workloads and rely on the techniques and tools described earlier to perform the measurements.
This article is structured as following. Firstly, we describe where is energy consumed in a HTC system and outline some of the tools and techniques available to measure and monitor energy consumption on HTC systems (Section 2). Secondly, we present the results of a comparison between ARMv7 and Intel Xeon architecture using CMS workloads (Section 3). Finally, we present IgProf, a general purpose, open source application performance profile. In addition, we describe its recent added energy profiling features and 64-bit ARM support.
2 Tools and techniques for energy measurement
When optimizing power usage, there are two granularities at which one can look at a computing system. The coarser granularity takes into account the behavior of the whole node (or some of its passive parts, e.g. the transformer) as part of a rack in a datacenter. This is usually investigated when engineering and optimizing computing centers. Alternatively, a more detailed approach is to look into the components which make up the active parts of a node, in particular the CPU and its memory subsystem since these are responsible for a sizeable fraction of the consumed power. They are also the place where the largest gains in terms of efficiency can be obtained through optimizations in the software.
If one is simply interested in the coarse power consumption by node, external probing devices can be used: monitoring interfaces of the rack power distribution units, plugin meters and non-invasive clamp meters (allowing measurement of the current pulled by the system by induction without making physical contact with it). They differ mostly in terms of flexibility. Their accuracy is typically a few percent for power, whereas their time resolution is in the order of seconds. This is more than enough to optimize electrical layout of the datacenters or to provide a baseline for more detailed studies.
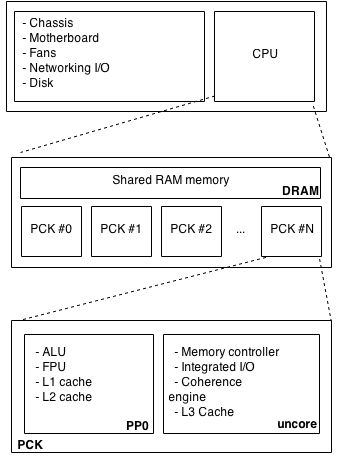
A alternative approach takes into account the internal structure of a computing element of an HTC system, as shown in figure 1. Nowadays, every board manufacturer provides on-board chips which monitor energy consumption of different components of the system. These allow energy measurements of fine grained detail, as it is possible to individually monitor energy consumption of components such as the CPU, its memory subsystem, and others. An example of this chip monitors is the Texas Instruments TI INA231 [8] current-churn and power monitor which is found on the ARMv7 developer board which we used for our studies. It is quite common in the industry. Compared to external methods, these on-board components provide high accuracy and reasonably high precision measurements (millisecond level).

A special and slightly different case of these on-board monitors is a new technology called Running Average Power Limit (RAPL), provided by Intel beginning from the Sandy Bridge family of processors.
Contrary to other solutions, which are implemented as discrete chips, RAPL is embedded as part of the CPU package itself and provides information on the CPUs own subsystems. In particular RAPL provides data for three different domains: package (pck), which measures energy consumed by the system’s sockets, power plane 0 (pp0), which measures energy consumed by the CPU core(s), and dram, which accounts for the sum of energy consumed by memory in a given socket, therefore excluding the on-core caches [9]. As for the discrete components case, the timing resolution of measurements is in the millisecond range [10]. This is fine enough to permit exploiting such data to build an energy consumption sampling profiler for applications, similar to how performance sampling profilers work (see section 4). Finally, in addition to power monitoring of the sockets, RAPL can limit the power consumed by the different domains. This feature, usually referred as power capping, allows the user to define the average power consumption limit of a domain in a defined time window and allows more accurate independent measurements of the non limited components.
3 Power efficiency measurements with x86-64 and ARMv7
In this section, we demonstrate the potential of some of the tools we previously described. To that end, we perform several measurements of workloads from CERN, running on different architectures. The workloads used in the experiment run on top of Intel x86-64 architecture, traditionally used in HTC and data centers and 32 bit ARMv7 architectures (for similar studies for 64bit ARMv8 and Xeon Phi, please refer to [11]). The ARM architecture, initially developed for mobile devices, has been considered [12, 13] as a potential alternative to Intel in HTC, given its energy efficient computing. We also present a brief comparison between ARM and Intel architectures from the energy consumption perspective, based on the results obtained.
3.1 Tools and techniques
For the Intel architecture, we used the RAPL technology to perform measurements of the energy consumed by the package, DRAM and cores (figure 1). The external measurements for the baseline were performed using a rack PDU, which provides an online API to gather the energy consumed by the system on the rack at a sampling rate of 1 second. For the ARM board, we used the Texas Instrument power monitor chip TI INA231 which allows reading of the energy consumed by the cores and dram at a sampling rate of microseconds. The chip was embedded in the board from the vendor. For the external measurements, we used an external plug-in power monitor with a computer interface for gathering and storing the results. In both cases we read the data as it was exposed to the system via the sysfs / devfs knobs. The machine specifications can be seen in figure 2.

3.2 Experiment setup
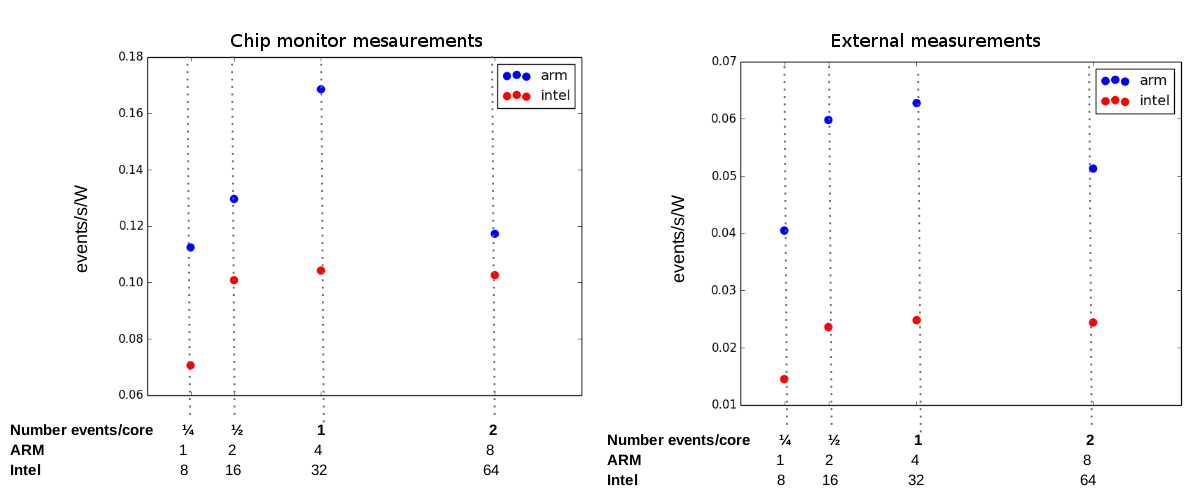
The workload used for the experiments was ParFullCMS, a multi-threaded Geant4 [14] benchmark application which uses a complex CMS geometry for its simulation. Using ParFullCMS, we ran simulation tasks on both the Intel and ARM machines (figure 3). The workflow was run several times with different number of threads in each machine. The number of threads run in each experiment is chosen according to the number of the cores of the machines.
3.3 Analysis
As expected, the ARMv7 architecture shows encouraging results from the energy efficiency perspective than Intel in all the experiments performed. Also as expected, both architectures do not perform better when overcommitted (more threads than the physical number of cores). Notice ARM results when overcommitted (8 threads) are much worse then Intel ones. This is due to the relatively modest amount of available DRAM (figure 2), causing the machine started swapping, greatly affecting performance. While this was expected, since the ARM system used is just a development board for mobile applications, this is a clear indication that when doing a final assessment of power efficiency for an architecture, one needs to have a full server-grade system in order to make a proper comparison.

4 Profiling for power efficiency
The hardware components described above provide measurements that are related to the full set of processes running on the machine. For the simple case where only a single benchmark application is running, these can be used to make comparisons between architectures. A further step is to try to see if there is a way to map the energy consumption measurements to functions and methods within an executing process. Such a mapping would allow for optimizations of the software itself. This kind of mapping can be done in two different ways, which we call instrumentation and sampling profiling.
In the instrumentation case, effective readings of profiled quantities (e.g. energy consumption), or quantities correlated with them (e.g. CPU power state transitions) are done at the beginning and the end of a profiled task and the difference between the two is used to estimate average power consumption over that period of time. By bookkeeping starting and stop values for monitored tasks one can get a fairly complete picture of what is happening to the system, provided the measured interval is large compared to the temporal precision of the measure being done. This is both to avoid a large error on the average estimation and to reduce performance overhead due to the measure itself.
Sampling profiling, on the other hand, has a different approach where a given quantity is sampled regularly and at each sample the measured quantity is accumulated until it overflows a user provided limit. When this happens the profiler increments a counter for the process / function being executed in that precise moment. Assuming that the distribution of where time is spent in a system is constant over time (which is typically true for large data processing tasks), such a sampling algorithm converges to the actual distribution of the measured quantity. The advantage of this approach is that the fidelity of the measurement to first approximation depends only on the number of samples made, regardless of the error on the profiled quantity. This also allows minimizing the performance overhead by tuning the sampling period to be much larger than the measurement itself.
IgProf is a general purpose, open source application performance profiler. It was developed in HEP, but it is capable of profiling all types of software applications. The profiler has been available on the x86 and x86-64 platforms since many years [15, 16], and recently we have also ported it to ARMv7 and ARMv8. Moreover we have now added a statistical sampling energy profiling module which provides function level energy cost distribution [17]. Such a module uses the PAPI library to read energy measurements from the RAPL interface previously described.

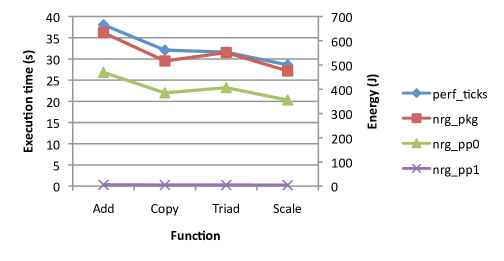
To illustrate the new module, we use it to profile the memory benchmark STREAM [18]. Figure 4 compares the results from performance and energy profiling of the benchmarking tool. The X-axis describes the four main functions contributing to the execution time and energy consumption of the stream tool: Add, Copy, Triad and Scale. The left scale of the Y-axis and the perf_ticks series describe the execution time spent in each function, whereas the right scale of the Y-axis and the nrg_pkg, nrg_pp0 and nrg_pp1 series describe the amount of energy spent in each function. The energy consumption of the processor package domain and the power plane 0 (describing the CPU cores) seem to follow the time spent in the functions, whereas the energy consumption of power plane 1 seems to be fairly constant to zero (describing the unused GPU) .
As we would expect from a simple benchmark, the profiling results of a simple single-threaded application shows a correlation between the execution time and the energy spent in a function. While the energy profiling module is now fully functional within IgProf, further work needs to be done to tune the measurements and to gain experience with how to use the profiles obtained for more complex applications.
5 Conclusions
Energy efficiency has become a major concern for HTC, given the large amount of computing resources - and thus energy - that recent experiments require. LHC computing is a prime example of the need for energy efficient facilities, given its present requirements and costs constraints. The need for energy efficiency drives an interest in accurately evaluating the different components of a HTC system to understand how and where energy is consumed and improve the overall efficiency. However, HTC systems are complex and composed of different components. In this paper we have presented a number of techniques and tools that provide insight into how and where energy is consumed from different perspectives and granularities. In addition, IgProf, an open source profiling tool, has been extended to run on 64-bit ARM and to provide function-level energy profiling capabilities. Using these tools and techniques we have also reported studies done to compare the energy performance of x86-64 and ARMv7 processors, confirming the potential of ARMv7 for efficient HTC systems should server grade systems be built around such chips.
Acknowledgements
This work was partially supported by the National Science Foundation, under Cooperative Agreement PHY-1120138, and by the U.S. Department of Energy. ARMv8 and energy profiling support in IgProf was also supported by Google Summer of Code (GSoC 2014).
References
References
- [1] Lyndon Evans and Philip Bryant. LHC Machine. JINST, 3:S08001, 2008.
- [2] Bird I. Computing for the Large Hadron Collider. Annual Review of Nuclear and Particle Science, 61, 2011.
- [3] S. Chatrchyan et al. The CMS experiment at the CERN LHC. JINST, 3:S08004, 2008.
- [4] Aad G et al (Atlas Collaboration). The Atlas Experiment at the CERN Large Hadron Collider. JINST, 3, S08003.
- [5] S. Chatrchyan et al. Observation of a new boson at a mass of 125 GeV with the CMS experiment at the LHC. Phys.Lett., B716:30–61, 2012.
- [6] G. Aad et al. Observation of a new particle in the search for the Standard Model Higgs boson with the ATLAS detector at the LHC. Phys.Lett., B716:1–29, 2012.
- [7] L Rossi and O Bruning. High Luminosity Large Hadron Collider A description for the European Strategy Preparatory Group. Technical Report CERN-ATS-2012-236, CERN, Geneva, Aug 2012.
- [8] Texas Instruments (TI) INA 231. http://www.ti.com/product/ina231. Last time accessed: 17-09-2014.
- [9] Intel 64 and IA-32 Software Developer Manuals - Volume 3. www.intel.com/content/www/us/en/processors/ architectures-software-developer-manuals.html.
- [10] Balaji Subramaniam and Wu chun Feng. Towards energy-proportional computing for enterprise-class server workloads. CPE ’13 Proceedings of the 4th ACM/SPEC International Conference on Performance Engineering, 2012.
- [11] David Abdurachmanov, Brian Bockelman, Peter Elmer, Giulio Eulisse, and Robert Knight. Heterogeneous High Throughput Scientific Computing with APM X-Gene and Intel Xeon Phi. to be published in ACAT 2014 proceedings, 2014.
- [12] David Abdurachmanov, Peter Elmer, Giulio Eulisse, and Shahzad Muzaffar. Initial explorations of arm processors for scientific computing. Journal of Physics: Conference Series, 523(1):012009, 2014.
- [13] David Abdurachmanov, Kapil Arya, Josh Bendavid, Tommaso Boccali, Gene Cooperman, Andrea Dotti, Peter Elmer, Giulio Eulisse, Francesco Giacomini, Christopher D Jones, Matteo Manzali, and Shahzad Muzaffar. Explorations of the viability of arm and xeon phi for physics processing. Journal of Physics: Conference Series, 513(5):052008, 2014.
- [14] S. Agostinelli et al. Geant4 — a simulation toolkit. Nuclear Instruments and Methods in Physics Research Section A: Accelerators, Spectrometers, Detectors and Associated Equipment, pages 250–303. DOI: 10.1016/S0168-9002(03)01368-8.
- [15] Giulio Eulisse and Lassi Tuura. IgProf Profiling Tool. Proc. Computing In High Energy Physics (CHEP04) (Interlaken), 2004.
- [16] IgProf, the Ignominous Profiler. http://igprof.org/. Accessed 2014-09-30.
- [17] Vincent M. Weaver, Matt Johnson, Kiran Kasichayanula, James Ralph, Piotr Luszczek, Dan Terpstra, and Shirley Moore. Measuring energy and power with PAPI. Proceedings of the International Conference on Parallel Processing Workshops, pages 262–268, 2012. DOI: 10.1109/ICPPW.2012.39.
- [18] John D. McCalpin. STREAM: Sustainable memory bandwidth in high performance computers. Web page. http://www.cs.virginia.edu/stream/. Accessed 2014-09-30.