Emergence of collective changes in travel direction of starling flocks
from individual birds fluctuations
Abstract
One of the most impressive features of moving animal groups is their ability to perform sudden coherent changes in travel direction. While this collective decision can be a response to an external perturbation, such as the presence of a predator, recent studies show that such directional switching can also emerge from the intrinsic fluctuations in the individual behaviour. However, the cause and the mechanism by which such collective changes of direction occur are not fully understood yet. Here, we present an experimental study of spontaneous collective turns in natural flocks of starlings. We employ a recently developed tracking algorithm to reconstruct three-dimensional trajectories of each individual bird in the flock for the whole duration of a turning event. Our approach enables us to analyze changes in the individual behavior of every group member and reveal the emergent dynamics of turning. We show that spontaneous turns start from individuals located at the elongated edges of the flocks, and then propagate through the group. We find that birds on the edges deviate from the mean direction of motion much more frequently than other individuals, indicating that persistent localized fluctuations are the crucial ingredient for triggering a collective directional change. Finally, we quantitatively show that birds follow equal radius paths during turning allowing the flock to change orientation and redistribute risky locations among group members. The whole process of turning is a remarkable example of how a self-organized system can sustain collective changes and reorganize, while retaining coherence.
I Introduction
Moving animal groups are a paradigmatic example of collective behavior in social species. The most striking features of such a collective motion are rapid, coherent changes in the direction of travel of the whole group. Each such change involves a collective decision that starts with a consensus-forming mechanism leading to the decision, and its actual execution by propagation through the entire group. At any moment of this process, the stakes of decreasing the fitness of any individual of the group are high. Both, slightest uncertainty and a slow and inefficient transport of information, are punished by decrease of cohesion, or even splitting of the group, leaving some individuals an easy pray to the predator. Determining the factors that govern the collective change of direction, and the mechanism ensuring efficient propagation of this collective decision, is thus a key to understanding the animal movement in groups.
Sudden collective changes of state in animal groups happen often couzin+krause_03 ; sumpter_06 ; buhl_06 ; radakov_1973 ; tunstrom_13 . Sometimes they may be a result of a global alarm cue, such is a shot heard by an entire flock of birds. In this case, the collective change of state is not necessarily a social response of the group. There is basically no transfer of information between the group members – all the birds react at the same moment, apart from individual differences in response times. More fascinating are collective decisions that have a localized spatial origin, starting from a few individuals that are close to each other. Consensus is achieved between nearby group members and a decision is formed, then the information to change state travels across the whole group and reaches all individuals.
In some cases, the cause of the localized spatial origin may be an external stimulus, such as a nearby predator that is seen by a small number of individuals in the group. Nevertheless, it has been shown that the collective directional switching can be also triggered spontaneously, without changes in the external environment buhl_06 . In fact, observation of natural starling flocks reveals that most of the time the flocks turn in absence of predators and with no apparent reason. Why, then, a collective turn occurs in the first place? What causes the first nearby birds to initiate a turn, and the others to follow? What are the consequences of turning?
Here we perform an experimental study in which we address these intriguing questions about collective turns in natural flocks of starlings. Using detailed data on individual trajectories in large groups we reveal the mechanism responsible for the initiation of spontaneous turning in starling flocks. We find that such turns always start from the elongated edges of the flock. This result suggests that the turn occurs because individual birds which are positioned in specific locations – with higher risks for predatory attacks and lesser social feedback from neighbors – are more prone to rearrange their position. In fact we find that the birds which initiate the turn display unusual deviations from the mean flock’s motion over longer periods than other birds. This persistent signal provokes a response of the neighboring birds, which leads to a decision to turn. Finally, we characterize the kinematics of turning and show that individuals follow equal radius paths. As a consequence, birds change their position with respect to the global direction of motion: dangerous edge locations become front/back ones and risk is redistributed through the group.
II Results
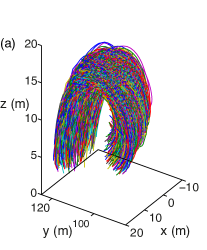
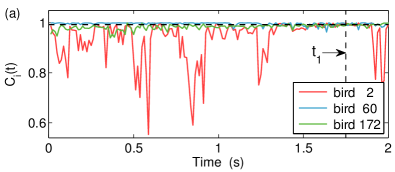
While returning to their roost shortly before sunset, starlings form sharp-bordered flocks which wheel and turn over the roosting place before setting down to the trees. They perform highly synchronized maneuvers while maintaining strong coherence, either as a response to a predator attack, but most often with no visible external influence. We concentrate exactly on the latter type of collective turns, where no changes in external environment are observed (Video 1). We collected data for turning events and tracked in time the positions of all individual birds in a flock. The full 3D dynamical trajectory of each bird in the flock is obtained during the whole duration of the turn by using a 3-cameras setup and a tracking algorithm developed in ref. attanasi+al_13b (see Methods for more information). In Fig.1-a and in Video 1 we show a typical collective turn.
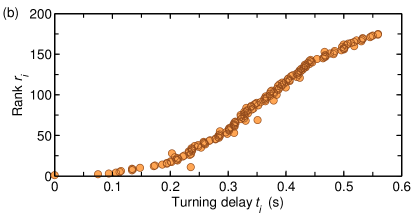
Having the full reconstructed trajectories, we can rank all birds in the flock according to their turning order, using the ranking procedure developed in ref. attanasi+al_14 . We can therefore say who is the first to turn, who is second, and so on. In this ranking, each bird is labelled by its rank , and by its absolute turning time , that is the turning delay with respect to the top bird in the rank – the initiator. The ranking curve in Fig.1-b is obtained by plotting the rank of each bird as a function of its absolute turning time .
In attanasi+al_14 we showed that the ranking curves for all turning events summarized in Table S1 take similar shape, indicating that turns are initiated by a small number of birds, whose reaction times are relatively long as the turn starts. Moreover, the first birds to turn are physically close to each other. Hence, the decision to turn has a spatially localized origin and it then propagates across the flock through a social transfer of information from bird to bird. This information flow is illustrated in Video 2 in which each bird changes color (from grey to red) once it starts turning, resulting in a turning wave that propagates through the whole flock.
The mechanism through which such propagation occurs is by far non trivial, with directional information traveling undamped with a speed of propagation that is larger the more ordered the flock is. In attanasi+al_14 we quantified in detail the features of this propagation, which is not described by standard models of self-propelled motion, and introduced a new mathematical theory able to explain it attanasi+al_14 ; cavagna+al_14 . There are, however, a few fundamental questions that remain to be addressed: why such a collective change of state started in the first place; who and why initiated the turn; and what are the consequences of turning in terms of global structure and individual rearrangements.

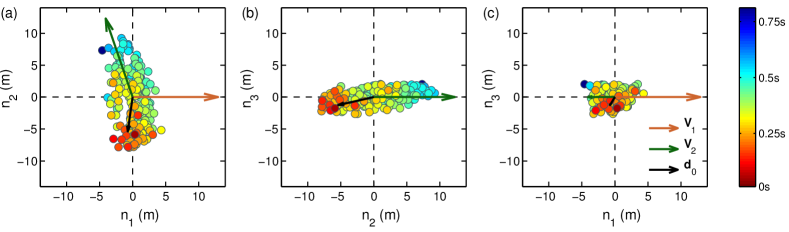
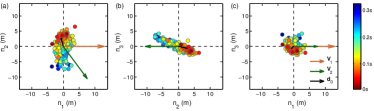
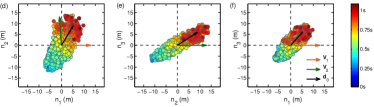
To investigate these questions, we first look at the spatial position of the top ranked birds within the flock and how from there the directional information propagates through the group. Flocks have three-dimensional shapes and it is therefore difficult to represent the spatial modulation of the turn propagation by using two-dimensional figures. To simplify the analysis, we exploit the fact that the trajectories of birds during a turn lie approximately on a plane (see Fig.1-a and Fig.S1). We can conveniently define a coordinate system with unit vectors , where lie on the turning plane and is perpendicular to it, with being the direction of motion of the flock at the beginning of the turn (see SI for details). This coordinate system is very useful to visualize turns. An example is given in Fig.2, where we show the birds positions at moment of the start of the turn.
At time the flock is moving with the velocity (along the axis). Velocity indicates a new flight direction, which is assumed after the collective turn is performed. For a flock of birds, flock’s velocity is defined as , where is velocity of bird at time . The birds are colored according to their turning time delays, revealing a response chain from the first to the last bird. This figure shows a few very interesting facts.
The top ranked birds (colored in red) are close to each other and are located close to one of the elongated edges of the flock. Once the turn starts, the information propagates from the initiating birds in all directions, ending with the birds close to the opposite elongated edge of the flock. As in Video 2, spatial modulation of the turning wave indicates a social nature of the response. Finally, the orientation of the flock with respect to the direction of motion changes upon turning, with the flock initially moving perpendicularly to its longest axis and ending with a direction of motion parallel to it. All the features we have qualitatively described so far can be precisely quantified. As we shall discuss in the remaining of the paper they hold systematically in all the turning events we have analyzed, indicating that spontaneous turns occur with a generic mechanism.
II.1 Origin of the turn
We can quantitatively locate the origin of the turn by looking at the positions of the first birds that turn within the flock. Let us define the average position of the top-ranked birds at the start of the turn with respect to the barycenter of the flock:
| (1) |
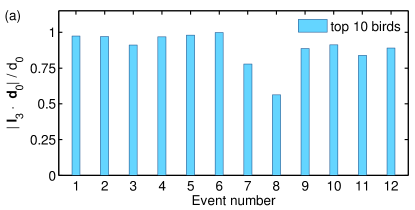
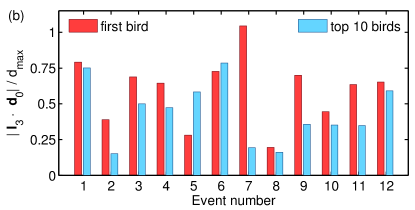
where is position of bird with rank at , and is position of the center of mass of the flock. In Fig.2 we can see that the first turning birds are positioned along the longest axis of the flock and close to its edge. To quantify this behavior, we compute the absolute scalar product of the normalized vector with the unitary vector of the longest elongation axis at the start of the turn (see SI for details on flocks’ elongation axes). This quantity gives a measure of the orientation of the initiating birds with respect to and is displayed for all the turning events in Fig.3-a (see also Table S1). The large values (close to ) indicate that the first birds to turn are situated along the longest elongation axis for all the analyzed turns. To quantify how close these birds are to the lateral tips of the flock, we calculate , where is the maximal possible value of a bird’s distance along axis, with going over all the birds on the side of the flock at which the turn started (since the two edges could be of different lengths). In Fig.3-b, we show the values of this quantity for both the first bird to start the turn and for the 10 top-ranked birds. The obtained values are quite high, confirming that initiators are typically close to the lateral elongated edges.
In Table S1, we give values for other quantities that give additional information about the position of the origin of the turn. For example, we can look at the normalized scalar product between and the flock’s velocity at the start of the turn (see column in Table S1). Its low values indicate that in most events the initiating birds are situated on the sides of the flock and not in the front or in the back, consistent with our previous analysis of Fig.3. In the same way, we can calculate the normalized scalar product between and the velocity assumed by the flock after the turn (column in Table S1). For most of the flocks, this product is negative suggesting that once the top ranked birds initiate the turn they try to move towards the center of the flock, therefore “pushing” the whole flock to turn in the direction opposite to vector as visually displayed in the flocks’ projections of Fig.2 and Fig.S2.
II.2 Equal radius paths and global reorientation during turns
Once the turn initiates at the edges of the flock, a turning wave propagates through the group according to the ranking curve displayed in Fig.1-b. During this process, two things happen: each bird performs its own individual turn following a specific trajectory in space; and the flock as a whole performs a global collective turn. These two dynamics are in fact strictly interconnected, and the way individuals coordinate turning with each other determines how the flock turns as a whole. Let us now show in detail how this occurs.
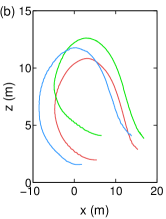
A few experimental and numerical studies in the past ballerini+al_08b ; heppner_92 ; cavagna+al_14 ; hemelrijk+al_10 observed that, when turning, birds follow equal radius paths. Having the full 3D trajectories of all individuals, we can investigate in detail this issue. In Fig.4 we report the individual trajectories during a turn, which clearly show very similar radii of curvature and trajectory crossing. A quantitative investigation of how the whole network changes during the turn confirms that birds indeed follow equal radius turning (see SI and Fig.S3). Our analysis in attanasi+al_14 ; cavagna+al_14 also shows that this kind of turning is intimately related to the fast and efficient way turns occur, where each bird starting to turn transfers to its neighbors information on its direction of motion and path curvature through a social interaction mechanism, giving rise to a propagating wave of turning individuals.
Equal radius turning is thus very non-trivial. It is also completely different from how a rigid assembly of particles (like a plane, or any solid body) would turn: in that case all particles turn synchronously around the same rotation point, following parallel paths and having different speeds and radii of curvature. Birds in a flock, on the contrary, turn following a social transfer of information, using different rotation points, but with the same radius of curvature and speed. Interestingly, this way of turning is advantageous under many respects. On the one hand, individuals can keep approximately constant speed and produce amazingly quick collective turns. On the other hand, as we shall discuss, the reciprocal positions of individuals and the orientation of the flock in space change so as to redistribute boundary locations and alternate risk.
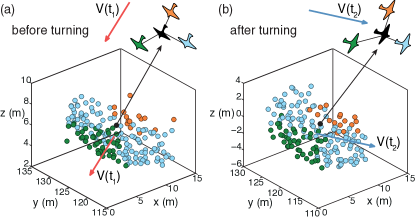

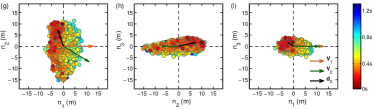
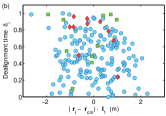
To understand how this occurs, let us look at Fig.5. In panel (a), we show a reconstructed flock at the initial time of the turn. A random bird is plotted in black, and the other birds are colored according to their angular position around this reference bird with respect to the barycenter velocity: green for the birds flying in front, light-blue for the ones on the sides, and orange for the birds flying behind. In panel (b) we show the same flock at time after performing a turn of , with the same colors previously assigned. The two figures reveal that the orientational topology changes with the change of the direction of motion, e.g., the birds which were in front of the reference bird (green) are now flying at the right of it. At the same time, the structural network of birds remains stable, that is, their angular relative position does not change considerably (see SI).
When looking at the flock as a whole, this implies that the group retains the same orientation with respect to an absolute reference frame, but its overall orientation with respect to the direction of motion changes. As one can see in Fig.2 (see also Fig.S2), shortly before the turn the flock has its longest elongation axis perpendicular to the direction of motion at time . After the turn at time , however, its new direction of motion (green arrow in Fig.2) is not anymore orthogonal to the longest elongation axis, but rather parallel to it. This behavior is characteristic for almost all the analyzed flocks . To quantify it, we computed the normalized scalar product of the longest elongation axis and the flock’s velocity before and after the turn, i.e. at times and , for all our turning events. The result is displayed in Fig.5-c and shows that flocks tend to fly with their longest axis perpendicular to the direction of motion prior to turns (small ), while align this axis with the flock’s velocity after the turn (large ). A full analysis of the dynamical evolution of the three inertial axis during turns confirms this scenario (see SI and Fig.S1).
Interestingly, the flock’s reorientation during the turn significantly changes the positional role of individuals in the group. Birds that were located at the largely populated front or back boundaries of the flock end up on the side, while birds on the lateral sparse tips, i.e. the same birds that initiated the turn in the first place, move to the front or back.
II.3 Individual deviations from the global direction
In the previous sections we have characterized the kinematics of turning. We have shown where turns originate in the flock and how, due to the specific equal radius way of turning, individuals rearrange their positions with respect to direction of motion. What we would like to investigate in the remaining sections is the mechanism that triggers the start of the turn.
As we have seen, turns initiate spontaneously from the lateral elongated edges of the flock. There might be some important difference in the way birds located in these regions of the flock behave that can explain why this occurs. To elucidate this point we look in more detail at the characteristics of individual motion, and its variability through the flock. More specifically, since turns involve a permanent change in the direction of motion, we can quantify the individual tendency to deviate from the global flock’s direction prior to the occurrence of the turn itself.
To this end, we define a directional correlation between the direction of motion of an individual bird and the global direction of motion of the flock as
| (2) |
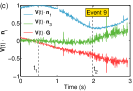
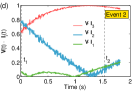
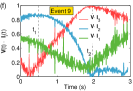
If at time bird is flying along the flock’s global direction of motion, the value of the correlation is , and we say that bird is completely aligned with the flock’s direction. However, birds are almost never completely aligned with the flock’s direction of motion, at the very least due to wing-flapping (zig-zag of the trajectories can be seen in Video 1). Therefore, values of fluctuate below, but close to , while sometimes we observe strong decline of this quantity, when a bird deviates strongly from the global direction of motion (see Fig.6-a).

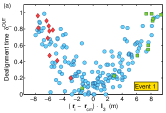
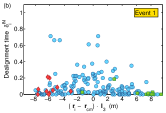
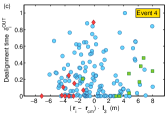
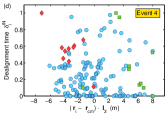
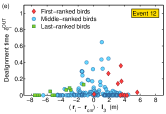
To understand which behaviour might trigger the collective decision to make the turn, we analyze a time interval shortly before the start of the turn at . During this interval we calculate the percentage of time during which bird deviates significantly from the global direction of motion. More specifically, we check how frequently its directional correlation is lower than some threshold value (e.g. the median of all ). We name this quantity a dealignment time factor (see SI and Eq.(S2) for precise definition).
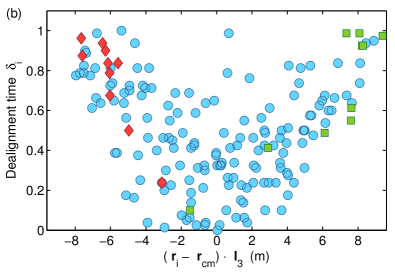
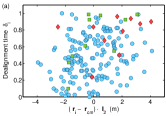
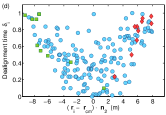
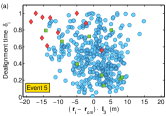
In general, one might expect that all birds are deviating from a mean behaviour in a similar way, so that half of the time they fly more aligned to the global direction of motion (i.e. with ), while other half of the time they deviate stronger from this direction (i.e. with ). That would imply that the values for are around for all the birds, independently of their position in the flock. This is not however what happens. As can be seen in Fig.6-b and Fig.S5 there is in fact a strong correlation between the location of an individual in the flock and the value of its dealignment factor: the farther away a bird is along the lateral elongation axis , the more frequently it exhibits consistent fluctuations from the global direction of motion. On the contrary, no such correlation exists when looking along the other elongation axes, or along the direction of motion (see Fig.S4).
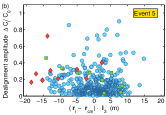
The top ranked birds (red diamonds in Fig.6-b), which are situated close to one edge, are among the individuals with the highest dealignment factor . We also computed the dealignment amplitude , which gives a measure of how strongly bird deviates from the mean behavior during the time interval (see SI and Eq.(S3)). While top ranked birds tend to have larger dealignment amplitude than average, they are not in general the individuals with strongest amplitude. There is not any clear correlation of the amplitude with the position along the elongation axis (see Fig.6-c). In fact, birds located centrally deviate as strongly or even stronger than the ones closer to the edges. However, their deviations are not followed by a global change of direction. These results indicate that what really is distinctive in the behavior of initiators is how persistently they deviate from the flock’s direction. The turning event is triggered by the presence of such repeated deviations from average motion and is not due to a big, but momentary lapse of alignment.
Why do initiators, and edge individuals more generally, behave differently? Due to the asymmetric elongated shape of flocks (see Fig.5 and Table S1), individuals in different locations can experience rather different boundary conditions. Birds in the bulk of the group are surrounded by many neighbors and well protected by external perturbations. They can momentarily fluctuate from the mean motion, but persistent large fluctuations are rare since volume confinement and social adaptation produce a strong feedback to the average. The same is not true for individuals at the border of the flock, and particularly for the ones on the extremal edges. These individuals are mostly surrounded by empty space. They can freely move towards the outside for a wide range of directions and experience an unbalanced social force by neighbors. They also are at large predatory risk, which might enhance their alertness and wish to relocate. All these factors contribute to produce persistent individual fluctuations, as signaled by the values of the dealignment time factor. Statistically this increases the probability of a coherent deviation of few individuals from the common flight direction, which might trigger spontaneous turns to occur.
III Discussion and Conclusions
Spontaneous turns occur continuously during aerial display and flocks keep changing their direction of motion even in the absence of predators or obstacles. While responding to an external cue is a natural anti-predatory strategy, the occurrence of spontaneous collective maneuvers poses intriguing questions as to why and how this kind of behavior arises. In this work we quantitatively characterized collective turning and offered an explanation of their highly non-trivial dynamics.
Our analysis, performed on 12 different turning events of various size and duration (see Table S1), outlines the following general scenario.
During straight flight flocks typically move level and acquire asymmetric shapes, with their longest elongation axis perpendicular to the flock’s velocity. This feature, that we clearly see in the data, has a well-known theoretical explanation: in self-propelled systems, orientational fluctuations perpendicular to the global direction of motion (and to gravity) are larger than in other directions toner+tu_98 ; chate+al_08 ; cavagna+al_13a , due to the breaking of the rotational symmetry in the polarized state. As a consequence, a coherent group gradually elongates with its main axis perpendicular to its velocity and to gravity (see Fig.5-c and Table S1). One of the main outcomes of this process is that birds situated in different regions of the flock experience rather different boundary conditions. In particular, the individuals in the elongated edges of the group have much less spatial confinement, and a strongly anisotropic distribution of neighbors. These conditions cause a larger directional mobility, and in fact our data show that individuals at the edges are the ones that more persistently deviate from the global direction of motion. For some of these birds this effect can become so strong as to compensate the feedback to average motion, and initiate a turn. Once the turn starts - locally at the lateral edges - it propagates through the group thanks to the social interactions between individuals. Birds turn following equal radius paths and rearrange their positions with respect to the global flock’s direction, so that at the end of the turn the very individuals that occupied lateral positions are in the front/back of the group, and the whole flock has its longest elongation axis oriented along the direction of motion.
There are a few interesting aspects of this collective phenomenon, which we would like to comment further.
One of our main findings is that turns systematically start on the outer tips of the flock. The fact that individuals on the border of a group behave differently has been already discussed in the literature on collective animal behavior. Staying on the border is not usually a preferential location during collective motion, since these positions suffer higher risk under a predator attack or any other external perturbation. Therefore one might expect border individuals to be particularly risk alert and exhibit a strong pressure to exchange position for a more favorable one. Several studies have been performed on feeding groups. While feeding on the ground, birds usually stay in flocks. Observations on starlings and other birds species show that individuals on the edges of the flock display stronger vigilance, that is, they scan the surrounding more frequently for predators and they feed more rapidly, etc. (see e.g.lazarus_78 ; jennings_80 ; inglis_81 ; black_92 ; fernandez_08 ). In the case of flying turning flocks, we find that border individuals deviate from the mean motion more frequently than others. It might be that due to their location these birds increase their alertness so that each of them becomes more sensitive and prone to changes, much as border individuals in feeding groups have a larger scanning and feeding rate. However this is not the only possible cause for their anomalous behavior. We know that when moving collectively birds coordinate with one another using local adaptation rules (i.e. ‘align with your neighbors’) aoki_82 ; vicsek+al_95 ; couzin+al_02 ; hemelrijk+al_11 ; bialek+al_12 . In this respect, being close to the edges implies having an atypical neighborhood, thereby experiencing a social force significantly different than inside the flock. This very fact can produce more persistent fluctuations at the border and trigger turns. While it is certainly very difficult to disentangle these effects in real data, the idea that social positional heterogeneities are important to explain the role of edge individuals is in our opinion worth investigating in future studies.
The fact that top ranked birds display unusual directional fluctuations is also interesting within another respect. We find that what really matters to initiate a turn is that these birds deviate from average motion much more frequently than others. On the other hand, we find no correlation between the strength of such behavioral deviations and turning (Figs. 6-c and S5). These results indicate that the response of the neighbors to the initiator of the turn is related to a repeated alarm signal–perceived as a deviation from the average motion–exhibited by the initiator, and not to a sudden and strong fluctuation. Similar results have been found in the works concerning vigilance behavior in feeding birds, where it has been shown that response to alarm cues occurs with repeated detection of an alarm signal cresswell_00 ; lima_94 . It has been argued that this strategy is useful for avoiding false alarms which are common, since taking flight in the course of feeding is both costly in energy and time (see e.g. proctor_01 ).
As we discussed so far, turns can and in fact do occur spontaneously. One can wonder why this is the case, and to what extent such a collective behavior can be advantageous to the individuals. On the one hand, spontaneous turns are a social response of the flock to the persistent deviations of some edge individuals. We can expect a similar mechanism to occur when an external repeated signal, like an approaching predator or an obstacle, is encountered. In this sense, spontaneous turns are a byproduct of the very ability of the group to respond collectively to local perturbations. On the other hand, our results show that during a turn individuals change their positions with respect to motion, with the remarkable consequence that birds who suffered extremal conditions before the turn acquire better locations after it. Risk is redistributed between individuals at no expense of global order. In this respect, the whole process of turning is a remarkable example of how a self-organized system can sustain collective changes and reorganize, while retaining coherence.
IV Acknowledgments
This work was supported by grants IIT–Seed Artswarm, ERC–StG n.257126 and US-AFOSR - FA95501010250 (through the University of Maryland).
References
- (1) Couzin, I. D. & Krause, J. Self-organization and collective behavior in vertebrates Adv. Study Behav. 32, 1–75 (2003).
- (2) Sumpter, D.J.T. The principles of collective animal behaviour Philos. Trans. R. Soc. B 361 5–22 (2006).
- (3) Buhl J., Sumpter D.J.T., Couzin I.D., Hale J.J., Despland E., Miller E.R., Simpson S.J. From disorder to order in marching locusts Science 312, 1402–1406 (2006).
- (4) Radakov, D. V. Schooling and Ecology of Fish (New York: J. Wiley, 1973).
- (5) Tunstrøm, K., Katz, Y., Ioannou, C.C., Huepe, C., Lutz, M.J., and Couzin, I.D. Collective States, Multistability and Transitional Behavior in Schooling Fish PLoS Comp. Biol. 9 e1002915 (2013).
- (6) Attanasi, A., Cavagna, A., Del Castello, L., Giardina, I., Jelić, A., Melillo, S., Pohl, O., Shen, E., Silvestri, E., Viale, M. Tracking in three dimensions via recursive multi-path branching arXiv: 1305.1495.
- (7) Attanasi A., Cavagna A., Del Castello L., Giardina I., Grigera T.S., Jelić A., Melillo S., Poh, O., Shen E., Viale M. Information transfer and behavioural inertia in starling flocks Nat. Phys. 10, 691–696 (2014).
- (8) Cavagna, A., Del Castello, L., Giardina, I., Grigera, T., Jelic, A., Melillo, S., Mora T, Silvestri E., Viale M & Walczak, A. M. Flocking and turning: a new model for self-organized collective motion. J. Stat. Phys. (2014).(DOI: 10.1007/s10955-014-1119-3.)
- (9) Ballerini, M., Cabibbo, N., Candelier, R., Cavagna, A., Cisbani, E., Giardina, I., Orlandi, A., Parisi, G., Procaccini, A., Viale, M. & Zdravkovic, V., Empirical investigation of starling flocks: A benchmark study in collective animal behaviour. Anim. Behav. 76, 201–215 (2008).
- (10) Pomeroy, H. & Heppner F. Structure of turning in airborne Rock Dove (Columba livia) flocks. Auk 109, 256–267 (1992).
- (11) Hildenbrandt, H., Carere, C. & Hemelrijk, C. K. Self-organized aerial displays of thousands of starlings: a model. Behav. Ecol. 21 (6), 1349-1359 (2010).
- (12) Cavagna, A., Duarte Queirós, S. M., Giardina, I., Stefanini, F. & Viale, M., Diffusion of individual birds in starling flocks. Proc. R. Soc. B 280, 20122484 (2013).
- (13) Chaté, H., Ginelli, F., Gregoire, G., & Raynaud, F. Collective motion of self-propelled particles interacting without cohesion Phys. Rev. E 77, 046113 (2008).
- (14) Toner, J. & Tu, Y. Flocks, herds, and schools: A quantitative theory of flocking Phys. Rev. E 58, 4828–4858 (1998).
- (15) Lazarus, J. Vigilance, flock size and domain of danger size in the white-fronted goose Wildfowl 29 135–145 (1978).
- (16) Jennings, T and Evans SM, Influence of position in the flock and flock size on vigilance in the starling, Sturnus vulgaris Anim. Behav. 28, 634–635 (1980).
- (17) Inglis, I.R, and Lazarus, J, Vigilance and flock size in brent geese: the edge effect Zeitschrift für Tierpsychologie 57 193–200 (1981).
- (18) Black, JM, Carbone, C, Wells, RL , Owen, M, Foraging dynamics in goose flocks: the cost of living on the edge Anim. Behav. 44 41–50 (1992).
- (19) Fernández–Juricic, E., and Beauchamp, G., An Experimental Analysis of Spatial Position Effects on Foraging and Vigilance in Brown?Headed Cowbird flocks Ethology 114 105–114 (2008).
- (20) Aoki, I. A simulation study on the schooling mechanism in fish Bull. Jpn. Soc. Sci. Fish 48, 1081–1088 (1982).
- (21) Vicsek, T., Czirók, A., Ben-Jacob, E., Cohen, I., and Shochet, O. Novel type of phase transition in a system of self-driven particles Phys. Rev. Lett. 75, 1226–1229 (1995).
- (22) Couzin, I. D., Krause, J., James, R., Ruxton, G. D. & Franks, N. R. Collective memory and spatial sorting in animal groups. J. Theor. Biol. 218, 1–11 (2002).
- (23) Hemelrijk, C. K.& Hildenbrandt, H. Some Causes of the Variable Shape of Flocks of Birds. PLoS ONE 6 (8), e22479 (2011).
- (24) Bialek, W., Cavagna, A., Giardina, I., Mora, T., Silvestri, E., Viale, M. & Walczak, A. M. Statistical mechanics for natural flocks of birds. Proc. Natl. Acad. Sci. USA 109, 4786–4791 (2012).
- (25) Lima, S. L. Collective detection of predatory attack by birds in the absence of alarm signals Journal of Avian Biology 25 319–326 (1994).
- (26) Cresswell, W., Hilton, G.F., and Ruxton, G.D. Evidence for a rule governing the avoidance of superfluous escape flights Proc. R. Soc. B 267 733–737 (2000).
- (27) Proctor, C. J., Broom, M., and Ruxton, G. D. Modelling antipredator vigilance and flight response in group foragers when warning signals are ambiguous J. theor. Biol. 211 409–417 (2001).
- (28) Cavagna, A., Giardina, I., Orlandi, A., Parisi, G., Procaccini, A., Viale, M. & Zdravkovic, V. The starflag handbook on collective animal behaviour: 1. empirical methods Anim. Behav. 76, 217–236 (2008).
- (29) Lima, SL, Ecological and evolutionary perspectives on escape from predatory attack: a survey of North American birds Wilson Bull. 105, 1–47 (1993).
SUPPLEMENTARY INFORMATION
Methods
Experiments. During winter, flocks of European starlings (Sturnus vulgaris) are a common sight in Rome, where they populate several roosting sites. We collected data shortly before dusk at the site of Piazza dei Cinquecento, between November 2010 and December 2012. The video sequences are acquired using the trifocal stereometric setup described in ref. cavagna+al_08a . Two cameras separated by a baseline distance m are the stereometric pair. A third camera, placed at a shorter distance m from the first one, allows us to exploit the trifocal constraint for solving the stereo correspondence (matching) problem cavagna+al_08a . We employ three high–speed cameras IDT-M5 with monochromatic CMOS sensor with resolution pixels, shooting at fps. Cameras store images on off-board memory using the Camera Link protocol. Lenses used are Schneider Xenoplan mm . Typical exposure parameters are: aperture between and ; exposure time between and ms. Intrinsic camera parameters are calibrated every two weeks in the laboratory using a set of images of a planar target. The accuracy of the 3D system is regularly tested using laser-metered artificial targets. Flocks perform turns typically at a distance of -m from the cameras. The error on the relative distance between two neighbouring birds is m. Time duration of the recorded events is between and s. We reconstructed the 3D positions and velocities of individual birds using the techniques developed in ref. attanasi+al_13b . The data set consists of 12 distinct flocking events, each one including one collective turn, as reported in Table S1. If on the recorded sequence the flock performs more than one turn, the time lag is chopped and different turns are studied as independent events (e.g. events E11 and E12 in Table S1).
| Event | Event | ||||||||||
|---|---|---|---|---|---|---|---|---|---|---|---|
| number | label | at | at | at | at | at | at | at | |||
| E1 | 20110208_ACQ3 | 176 | 0.806 | 0.95 | 0.15 | 0.47 | 0.14 | 0.93 | 0.97 | 0.08 | -0.91 |
| E2 | 20111124_ACQ1 | 125 | 0.959 | 0.97 | 0.15 | 0.01 | 0.65 | 0.99 | 0.97 | 0.81 | -0.78 |
| E3 | 20111125_ACQ1 | 50 | 0.866 | 0.86 | 0.42 | 0.26 | 0.41 | 0.88 | 0.91 | 0.05 | -0.82 |
| E4 | 20111214_ACQ4_F1 | 154 | 0.940 | 0.69 | 0.72 | 0.03 | 0.12 | 0.63 | 0.97 | 0.10 | -0.83 |
| E5 | 20111215_ACQ1 | 384 | 0.801 | 0.97 | 0.16 | 0.13 | 0.24 | 0.92 | 0.98 | 0.05 | -0.94 |
| E6 | 20111125_ACQ2 | 502 | 0.841 | 0.98 | 0.16 | 0.35 | 0.38 | 0.89 | 1.00 | 0.43 | 0.74 |
| E7 | 20110217_ACQ2 | 404 | 0.854 | 0.91 | 0.32 | 0.39 | 0.34 | 0.96 | 0.78 | 0.83 | -0.89 |
| E8 | 20111220_ACQ2 | 197 | 0.907 | 0.98 | 0.03 | 0.94 | 0.30 | 0.90 | 0.56 | 0.20 | -0.53 |
| E9 | 20111201_ACQ3_F1 | 133 | 0.793 | 0.76 | 0.46 | 0.04 | 0.21 | 0.99 | 0.89 | 0.21 | 0.78 |
| E10 | 20110211_ACQ1 | 595 | 0.757 | 0.94 | 0.10 | 0.34 | 0.03 | 0.36 | 0.91 | 0.37 | -0.96 |
| E11 | 20111214_ACQ4_F2_T1 | 139 | 0.890 | 0.35 | 0.87 | 0.67 | 0.92 | 0.56 | 0.84 | 0.74 | 0.08 |
| E12 | 20111214_ACQ4_F2_T2 | 139 | 0.808 | 0.66 | 0.74 | 0.11 | 0.58 | 0.79 | 0.89 | 0.15 | 0.39 |
Reorientation during turns
Global orientation of the flock
Turning plane. It has previously been observed that the trajectories of birds during a turn lie approximately on a plane (see ref. attanasi+al_14 and Fig.1-a). We exploit this fact in order to simplify the representation of a turn propagation through the flock and subsequent analysis. We determine the ‘turning plane’ by using two average flock velocity vectors: at time of the start of the turn, and at time shortly after the turn is finished. The average flock velocity at time is calculated as , where is the velocity of bird at time . The ‘turning plane’ can then be defined by its normal unit vector which is perpendicular to the plane, and the flock’s barycenter position at time . Vector is obtained as a unit vector orthogonal to , as well as to , that both lie within the ‘turning plane’, that is . Finally, the normal to the plane , together with a unit vector along the direction of motion at the start of the turn , and a unit vector , form an orthogonal coordinate system (see Fig.1-a). We typically use this coordinate system for data visualization in the paper. Note that times and are not necessarily initial and final times of the acquisition, but the times before and after the flock turns. They are estimated either from the trajectories themselves, or from the calculated velocities and radial accelerations.
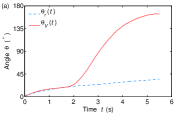
During the turn, between and , the flock turns on the above defined turning plane. This can be verified by looking at the scalar product between the unit vector of velocity (representing direction of motion) and the normal to the plane . Indeed, in Fig. S1 one can see that this scalar product, , fluctuates around zero, thus confirming the ’turning plane’ observation. Other scalar products of interest are also given, such as: that quantifies the change of the flock’s direction of motion over time with respect to the start of the turn at , and (with being gravity unit vector) that shows whether a flock is flying parallel to the ground or not.
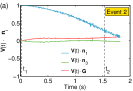
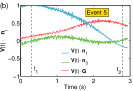

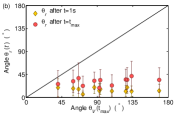
Elongation axes. It is convenient to consider the three principal elongation axes of the flock , , and . Since flocks typically have asymmetric flat shapes the dimensions of the group along these axes are . The smallest dimension characterizes the thinness of the flock and its relative axis defines the yaw axis of the flock. Flocks typically fly parallel to the ground with their yaw axis parallel to gravity (see ballerini+al_08b and Table S1). To study the re-orientation of the flock during the turn, we computed the angles between the three axes and the flock’s velocity and checked their evolution in time from the start to the end of the turn (see Fig. S1). Since turns are almost planar, a synthetic description of this dynamics is given by the normalized scalar product of the longest elongation axis and the flock’s velocity before and after the turn, i.e. at times and for all our turning events. The result is displayed in Fig.5, and confirms what is qualitatively observed in Fig.2. The values of these scalar products reported in Table S1 confirm that prior to the turn the flock’s longest axis tends to be perpendicular to its direction of motion (small values at ), while during the turn it aligns more with the flock’s velocity (high values at ).
Typically, the values of the scalar product at the start of the turn are below , corresponding to an angle between and between the longest axis and velocity. There are a few exceptions to this general conclusion, which can be easily explained. On the one hand, the exceptions are events E11 and E12 which correspond to two consecutive turns of the same flock, and occur after a merging of two separate flocks into one (as revealed by the original videos of the events), which might be the reason why the reorientation is different. In addition, for these two events we find that the longest elongation axis is more aligned to gravity than the yaw axis , contrary to all other flocks we analyzed (see Table S1) and results in ballerini+al_08b . On the other hand, for event E2, the data acquisition initiated too late to capture the very start of the turn. Although this did not hinder the determination of the ranking curve, the orientation of the flock already started to change prior to the start of the acquisition, preventing us from obtaining the initial orientation angle.
Propagation during turns
In Fig. S2 we show how the information to change the direction of motion propagates from the first bird through an entire flock. In the same way as in Fig. 2, we project the birds’ positions at the start of the turn to the ‘turning plane’ coordinate system centered at the flock’s barycenter at time . The color used for each bird reveals its turning time delay with respect to the first bird to turn to which we assign the delay s. The values of the time delays are used from the established ranking in ref. attanasi+al_14 .
Equal radius paths and network rearrangement
Trajectories of individual birds of a flock performing a collective turn show that birds follow paths of very similar radii of curvature, causing their trajectories to cross (see Fig.4). We can be more quantitative in our characterization of this phenomena. Let us call the position of bird relative to bird . We can monitor the orientational change of between the initial time of the event and a later time . This is described by the angle between the two vectors and
| (S1) |
Averaging over all pairs of birds and , we obtain , which quantifies the angular variation of the whole structural network of birds over time. In Fig. S3-a we show the evolution over time of and we compare it with , the angle between the global direction of motion of the flock at time and the one at time . The interesting point is that for parallel path turning the angles and must be highly correlated, with in the rigid-body limit. On the contrary, we find that while the angle increases strongly during the turn, measuring a change of the flock’s direction of motion, angle does not change considerably. Other turning events show similar behaviour, with small changes in over the time scales of the analyzed turns, see Fig.S3-b. Small changes in the angular variation of the network of the flock mean that the birds adapt the new direction of motion with no changes in their relative positions with respect to the absolute reference frame, a characteristic of the equal radius path turning. We show this illustratively in Fig.5-a,b. As discussed in the main text of the paper, reorientation of the birds in the flock in this way not only enables efficient and fast turning of a flock as a collective, it also significantly changes the positional role of individuals within the flock, so as to alternate risky positions over time.
Individual deviations from the global direction
Dealignment time factor. We define the dealignment time factor as a percentage of time during a time interval of length before the start of the turn , during which bird deviates from the mean direction of motion more than a given threshold value
| (S2) |
Here, is a Heaviside step function, so that for , and for . For the threshold value , we choose a median of the set of values . However, other thresholds can be also considered. For the choice of a median value as a threshold , the dealignment time factor gives the percentage of time during the time interval for which bird was more dealigned with the global direction of motion than at least of other birds in the flock.
As discussed in Section II.3, we find a strong correlation between the location of an individual within the flock and the value of its dealignment factor: the farther away a bird is along the lateral elongation axis , the more frequently it exhibits consistent fluctuations from the global direction of motion. We do not find, however, any obvious correlation when looking at the birds’ positions along the other two elongation axes, as shown in Fig. S4-a,b where we plot as a function of the bird’s position along other two axes and . There is also no correlation between and the birds’ position along the direction of motion , that is, whether it is situated in the front or in the back of the flock (see Fig. S4-c). The only correlation can be found between and the lateral (left-right) direction direction, which is not surprising as we showed that the longest elongation axis is almost parallel to it at the start of the turn , (see Fig. S4-d).

Dealignment amplitude. We also define a normalized dealignment amplitude , where is a maximal deviation from the mean flock’s direction of motion during the time interval before the start of the turn
| (S3) |
We note that the velocities of individual birds are calculated from the individual trajectories of each bird , by looking at its positions at the frequency of hz and not at the sampling frequency hz (however, we used all the available data points sampled at hz). This is because, as stated above, at such a high frequency of hz the deviations from the mean direction of motion would include the zig-zag part of the trajectories which are due to wing-flapping. We avoid this by choosing to calculate the velocities at the time interval of s, i.e. at hz which is exactly the frequency of the flapping. Finally, we present the data for the time interval s before the start of the turn at moment . However, for the turning events in which the turn starts at moment s from the start of the acquisition, the time interval starts from the beginning of the acquisition and, therefore, includes also time . Typically, we use time period of s which is short enough so that the results are not strongly influenced by this lack of data before the start of the turn, but long enough to give good statistics for dealignment.
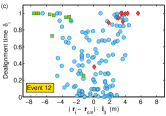
In Section II.3, we show that the top-ranked individuals, which are situated close to one edge of the flock, are among the individuals with the highest realignment factor . On the contrary, we find that there is not such a correlation between the dealignment amplitude and the location of an individual within the flock. Here we show this for some of the other turning flocks, see Fig. S5, confirming our conclusion that what triggers the turn is the presence of a repeated deviation from the flock’s global direction and not the strength of a single, momentary deviation from the average behaviour.

Outward and inward deviations. In this paper we show that, while flying straight, flocks typically acquire asymmetric shapes, with their longest elongation axis being oriented perpendicular to the flock’s velocity. Moreover, the results in Section II.3 demonstrate that birds deviate more and more frequently from the common flock direction, when being positioned closer and closer to the lateral edges of the flock. Here we contribute to these conclusions by distinguishing between the direction of these deviations, that is, whether they are directed towards the void space outside of the flock, or towards the inside of the flock where the space is occupied with other birds. For many flocks we find that most of the deviations performed by the birds closer to the elongated edges are towards the boundary of the flock (outward), and not towards the center of the flock (inward), as for the turning event E1 shown in Fig.S6-a,b. This result is consistent with the maximal diffusion along the wing’s axis found in cavagna+al_13a , and, in particular, the dynamics of the border. As discussed therein, the dynamics of the edge birds results from balancing the availability of void space outside the flock, staying at the border of a flock rather than going astray lima_93 , and the reluctance of their internal neighbours to give up a more favourable position. Finally, as this effect builds up in time, some of these birds successfully manages to move inwards, compensating the feedback to average motion,. This incites a response of their neighbours, followed by a collective turn of the whole flock. In fact, in some of the turning events, we could clearly detect the inwards fluctuations performed by the top-ranked birds, which are the cause of the turn. In Fig. S6 we also show the distinction between outwards and inwards deviations from the common direction for two other events for which we noticed different pattern than the one discussed here. In particular, for event E12, the turn follows the joining of two separate flocks shortly before which could be the reason for it differing from the observed standard scenario.