The radial gradient of the near-surface shear layer of the Sun
Abstract
Context. Helioseismology has provided unprecedented information about the internal rotation of the Sun. One of the important achievements was the discovery of two radial shear layers: one near the bottom of the convection zone (the tachocline) and one near the surface. These shear layers may be important ingredients for explaining the magnetic cycle of the Sun.
Aims. We measure the logarithmic radial gradient of the rotation rate () near the surface of the Sun using 15 years of f mode rotational frequency splittings from the Michelson Doppler Imager (MDI) and four years of data from the Helioseismic and Magnetic Imager (HMI).
Methods. We model the angular velocity of the Sun in the upper Mm as changing linearly with depth and use a multiplicative optimally localized averaging inversion to infer the gradient of the rotation rate as a function of latitude.
Results. Both the MDI and HMI data show that is close to from the equator to 60∘ latitude and stays negative up to 75∘ latitude. However, the value of the gradient is different for MDI and HMI for latitudes above . Additionally, there is a significant difference between the value of using an older and recently reprocessed MDI data for latitudes above .
Conclusions. We could reliably infer the value of up to 60∘, but not above this latitude, which will hopefully constrain theories of the near-surface shear layer and dynamo. Furthermore, the recently reprocessed MDI splitting data are more reliable than the older versions which contained clear systematic errors in the high degree f modes.
Key Words.:
Sun: Helioseismology – Sun: Interior – Sun: Rotation1 Introduction
Helioseismology has had a significant impact on our understanding of the internal structure and dynamics of the Sun. One of the most important results has been the inference of the rotation profile (Schou et al., 1998). Two shear layers have been identified, one located near the base of the convection zone (Christensen-Dalsgaard & Schou, 1988; Brown et al., 1989), known as the tachocline (Spiegel & Zahn, 1992), and one in the upper 35 Mm, the near-surface shear layer (NSSL, Thompson et al., 1996). Explaining the current picture of the internal rotation profile in theoretical terms is a major challenge. (Kichatinov & Rudiger, 1993; Kitchatinov & Rüdiger, 2005).
The rotation profile in general and shear layers in particular may play a crucial role for the solar dynamo (e.g., Brandenburg & Subramanian, 2005; Charbonneau, 2010). This led to further investigation of the NSSL using helioseismic measurements (Basu et al. 1999; Corbard & Thompson 2002, hereafter CT; Howe et al. 2006; Zaatri & Corbard 2009) and its role in dynamo theory (Dikpati et al., 2002; Mason et al., 2002; Brandenburg, 2005; Käpylä et al., 2006). The logarithmic radial gradient of the rotation rate () evaluated at the surface was measured by CT using f modes. They used 23 data sets (each from 72-day time series) of 18 odd -coefficients from the Medium- program (Scherrer et al., 1995) of the Michelson Doppler Imager (MDI) onboard the Solar and Heliospheric Observatory (SOHO) covering the years 1996 through 2001. Their main result was that up to latitude, reverses sign around latitude and stays positive at higher latitudes. However, they also noted that there are indications of systematic errors mostly affecting high latitudes. We address this issue by analyzing splittings from MDI and the Helioseismic and Magnetic Imager (HMI; Schou et al., 2012) onboard the Solar Dynamics Observatory (SDO).
2 Observations
Thousands of oscillation mode frequencies can be measured on the Sun, where , , and are the radial order, the spherical harmonic degree, and the azimuthal order, respectively. The mode frequencies are expanded using so-called -coefficients (Schou et al., 1994)
| (1) |
where is the mean multiplet frequency and are orthogonal polynomials of degree . This work considers only f modes, for which , and so we suppress in the following. We use two sets of -coefficients. The first is from the MDI Medium- program and contains 74 sets of splittings from independent 72-day time series (Larson & Schou in prep.). These data cover about 15 years from 1996 May 1 to 2011 April 24, except for 1998 from July 2 to October 17 and 1998 December 23 to 1999 February 2 due to technical problems with SOHO. The second set is from HMI and contains 20 sets of splittings from consecutive 72-day time series (Larson & Schou in prep.), covering four years of observation from 2010 April 30 to 2014 April 8. Additionally, in order to compare our results with the results obtained by CT, we also use older version of the MDI data. The differences between these versions come from various improvements to the analysis, as described in Larson & Schou (2009) and (Larson & Schou in prep.). We refer to the older version as “old MDI” and to the latest “new MDI”. The f modes we use cover the range for MDI and for HMI. We note that the number of available modes changes with time because of noise.
3 Analysis of f mode data
The odd -coefficients are related to the angular velocity by
| (2) |
where the kernels are known functions, , is the co-latitude, and is the distance to the center of the Sun divided by the photospheric radius. Using the results of Pijpers (1997), one can show that the kernels can be separated in the variables and ,
| (3) |
where the functions and are the radial and latitudinal parts of the kernels. The function is
| (4) |
where , and are given by
| (5) | |||||
| (6) | |||||
| (7) |
In the above equations is the density, , and are the radial and horizontal displacement eigenfunctions as defined by Pijpers (1997), and . The latitudinal part of the kernels is given by
| (8) |
where are associated Legendre polynomials of degree and order one. As seen later, the form of Eq. (3) is useful in that the latitudinal part of the kernels is independent of .
We use f modes to calculate close to the surface of the Sun in several steps. In the first step, we assume that the rotation rate changes linearly with depth at each latitude
| (9) |
where is the slope and is the value of the rotation rate at the surface. Combining Eq. (9) with Eqs. (2) and (3) we obtain
| (10) |
where and is the center of gravity of . The quantities and are the latitudinal averages
| (11) | |||||
| (12) |
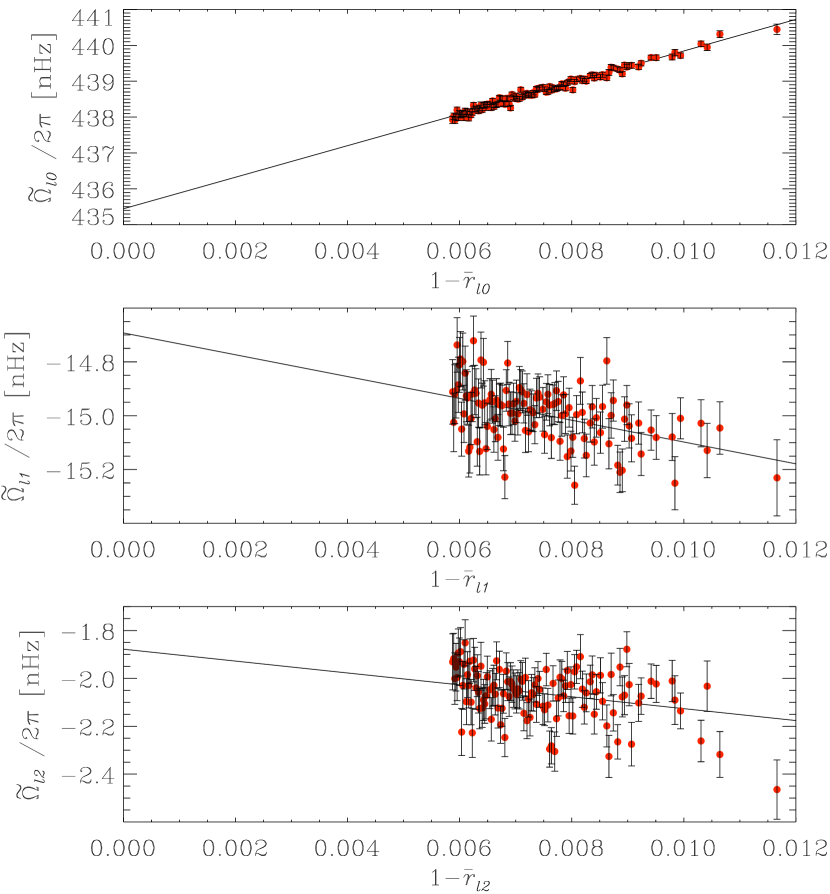
By performing an error weighted linear least squares fit of versus we can estimate and . This procedure is applied for all with for each individual 72-day data set. To illustrate this, Fig. 1 shows as a function of for and for one time period. We note that the values of correspond to a depth range of about Mm, and that the kernels have a significant extent in depth. Our estimates of at the surface are thus in effect extrapolations and the values of are averages, both estimated from roughly the outer 10 Mm.
Next we invert and to obtain estimates and of and , where is the target point for the inversion. Following Schou (1999), we use a multiplicative optimally localized averaging inversion method with a trade-off parameter . This implies that the averaging kernels for and are the same as those shown in Figure 4 of Schou (1999).
Finally, we obtain an estimate of the surface value of the logarithmic radial gradient of the angular velocity at each as
| (13) |
4 Results
Latitude [deg] MDI HMI 0 10 20 30 40 50 60 70
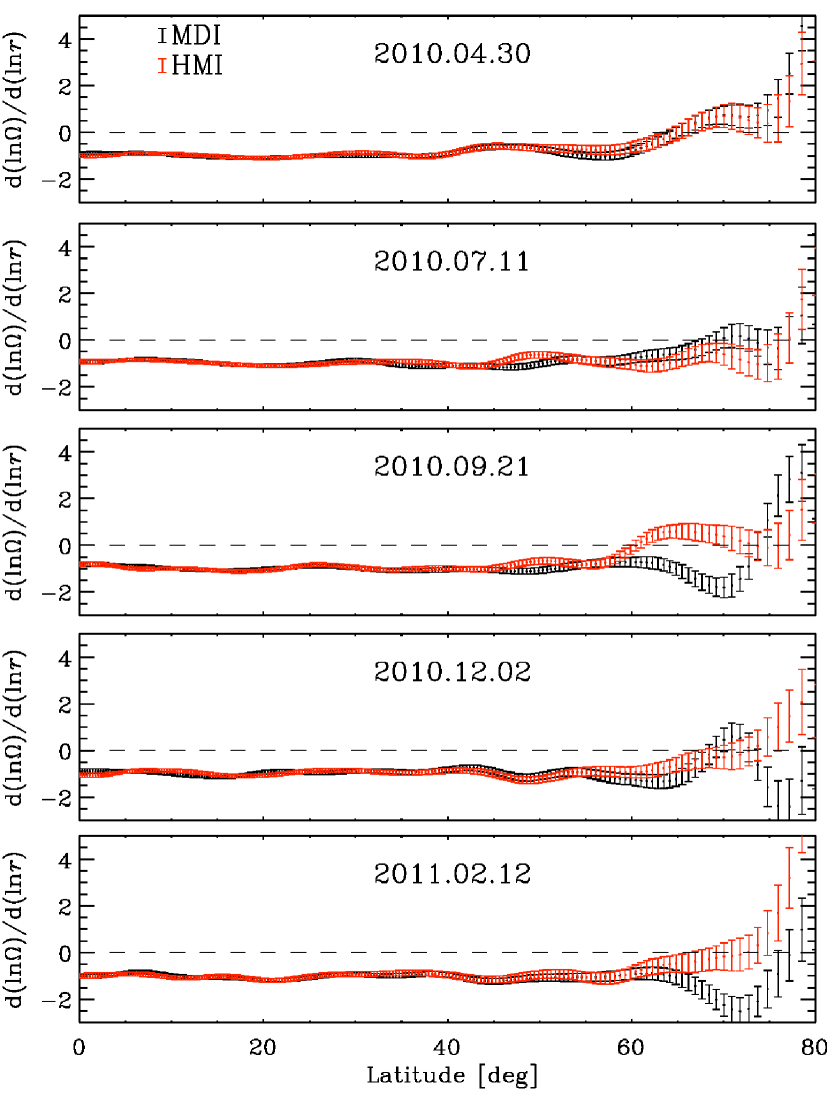
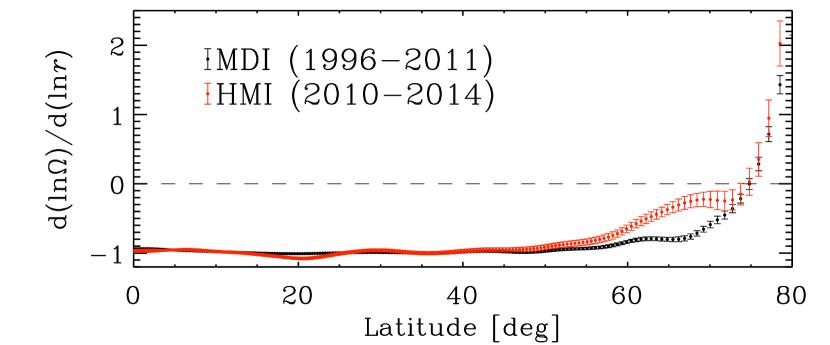
In Fig. 2 we plot the estimates of as a function of target latitude () averaged over time for 15 years of new MDI data and 4 years of HMI data; in Table LABEL:LRG-target we give the results. The results are similar and very close to from the equator to latitude, while above they diverge. The differences at high latitudes could be due to either systematic errors or a solar cycle effect (the data sets cover different parts of the solar cycle). To investigate this discrepancy, Fig. 3 shows the results of applying our method to the HMI and MDI data sets from the five common 72-day periods between 2010 April 30 and 2011 April 24. The results are consistent up to within 2-, but show significant inconsistencies at higher latitudes. An analysis using only the common modes and the average errors does not significantly reduce this high latitude discrepancy. This indicates that there are systematic errors in at least one of the data sets, as opposed to only differences in the mode coverage or error estimates. The source of the systematic errors is unknown, but could be related to inaccurate estimates of the optical distortion of the instruments or similar geometric errors (Larson & Schou in prep.). Another possible source is the different duty cycles. For example, the last three data sets for MDI had duty cycles of 88%, 73%, and 81%, while the corresponding HMI duty cycles were 97%, 99%, and 96%. In either case we conclude that the results above should be treated with caution.
The results presented here are significantly different from those obtained by CT. They found that is close to from the equator to latitude, while our result shows this up to latitude. They also found that their results changed significantly if they restricted the degree range. To investigate the origin of these differences we examine the effects of each of the differences between their data and analysis and ours.
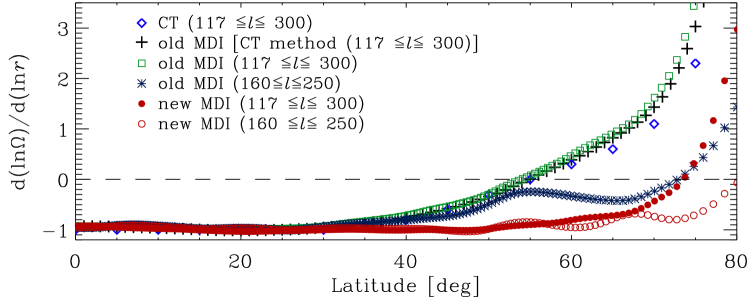
First, we compare the results of applying our method and theirs to the 23 time periods they used (covering the period 1996 May 1 to 2001 April 4). Corbard & Thompson (2002) first made an error weighted time average of an older version of the MDI data and then applied their Eq. (9). If we repeat this procedure on the same data sets we obtain results visually identical to theirs. The difference between the data sets used by CT and old MDI is that a few modes were accidentally removed from the older set. We then changed the processing order to first apply their Eq. (9) to old MDI and then make an unweighted time average. As shown in Fig. 4, this results in minor differences at high latitude and an analysis applying each change separately shows that only the change from weighted fits to unweighted fits leads to a noticable difference.
We then restricted the old MDI mode set to . As shown in Fig. 4, this results in large changes above , in agreement with what CT found. This indicates that the linear model of the rotation rate (as given by Eq. (9)) is incorrect or that there are systematic errors.
Finally, we apply our method to the old MDI and new MDI data sets. As can be seen in Fig. 4 we see a significant difference above latitude. The result using the new MDI data does not show any change of the sign up to latitude and is up to latitude. The results using the new MDI data sets also show good agreement between the results of the complete and restricted mode sets up to almost latitude, indicating that the model of linear change of the angular velocity with depth represents those data better than the old MDI data.
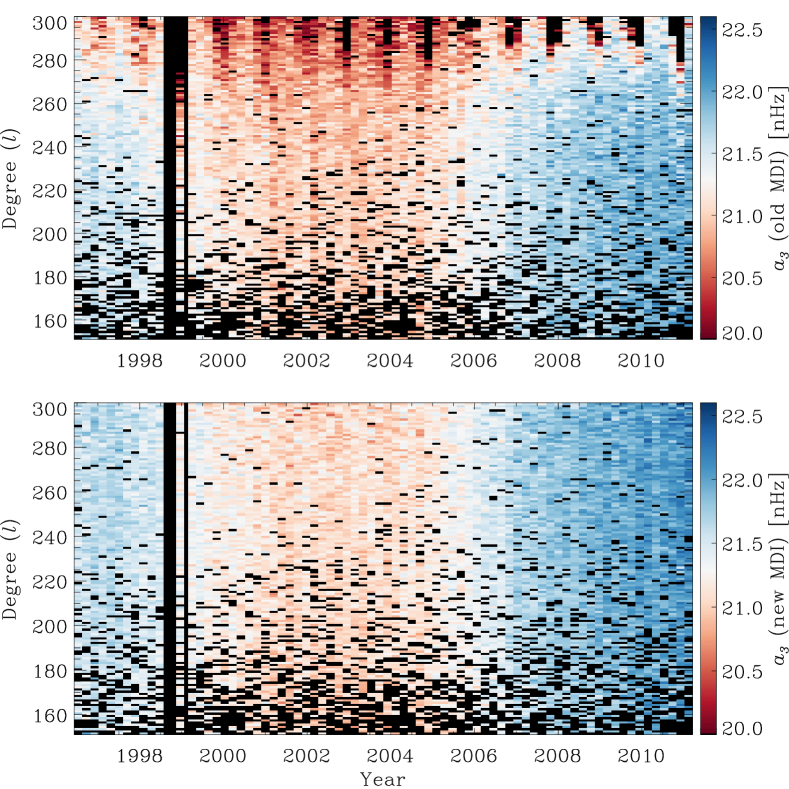
As almost all the differences between the results obtained by CT and ours come from the differences between old and new MDI, we compare the -coefficients directly. As an example, Fig. 5 shows for the modes with for all 74 periods. The main differences between new and old MDI appear for . In the new MDI data most of the missing modes (shown in black) in the old MDI data are recovered and the yearly oscillatory pattern disappears. These differences clearly show that the old MDI data have significant systematic errors in the high degree f modes. We also note that the new values of are shifted towards higher values.
5 Conclusion
We analyze 15 years (1996-2011) of reprocessed MDI data and 4 years (2010-2014) of HMI data to infer the logarithmic radial gradient of the angular velocity of the Sun in the upper Mm. By using data from two instruments and applying a different method than CT did, we confirm their value of at low latitudes (); unlike CT, we show that stays nearly constant and close to up to latitude. With further analysis we conclude that the inconsistency between their results and ours for latitudes above is due to systematic errors in the old MDI data. This implies that work done using old MDI data should be revisited. By comparing the results obtained from new MDI and HMI data, we also conclude that at least one of the data sets is likely still suffering from some systematic errors which leads to the discrepancy above latitude.
The measured value is inconsistent with the standard picture of angular momentum conservation where is (Foukal, 1977; Gilman & Foukal, 1979). More recently, hydrodynamical mean-field simulations of a larger part of the convection zone by Kitchatinov & Rüdiger (2005) show a NSSL with a negative radial gradient of the angular velocity from the equator to latitude. Their theory (Kichatinov & Rudiger, 1993; Kitchatinov & Rüdiger, 1999; Kitchatinov, 2013) states that the formation of the NSSL is due to the balance of the -effect (Ruediger, 1989) and the eddy viscosity. However, producing a NSSL with the correct radial gradient remains a challenge for direct numerical simulations of the Sun (e.g., Warnecke et al., 2013; Guerrero et al., 2013) and we still do not understand why the value of at the surface is nearly constant and so close to .
We note here that we measure only in the upper Mm which is only about one third of the NSSL. To extend this range one would need to use p modes, which unfortunately have much more noise. A preliminary analysis shows that shows little solar cycle variation, though there are weak hints of a torsional oscillation-like signal. However, this requires further analysis.
Acknowledgements.
We thank T. P. Larson for discussions regarding details of the MDI and HMI peakbagging, T. Corbard and M. J. Thompson for clarifying details of their analysis, and A. Birch for various discussions. SOHO is a project of international cooperation between ESA and NASA. The HMI data are courtesy of NASA/SDO and the HMI science team.References
- Basu et al. (1999) Basu, S., Antia, H. M., & Tripathy, S. C. 1999, ApJ, 512, 458
- Brandenburg (2005) Brandenburg, A. 2005, ApJ, 625, 539
- Brandenburg & Subramanian (2005) Brandenburg, A. & Subramanian, K. 2005, Phys. Rep, 417, 1
- Brown et al. (1989) Brown, T. M., Christensen-Dalsgaard, J., Dziembowski, W. A., et al. 1989, ApJ, 343, 526
- Charbonneau (2010) Charbonneau, P. 2010, Living Reviews in Solar Physics, 7, 3
- Christensen-Dalsgaard & Schou (1988) Christensen-Dalsgaard, J. & Schou, J. 1988, in ESA Special Publication, Vol. 286, Seismology of the Sun and Sun-Like Stars, ed. E. J. Rolfe, 149–153
- Corbard & Thompson (2002) Corbard, T. & Thompson, M. J. 2002, Sol. Phys., 205, 211
- Dikpati et al. (2002) Dikpati, M., Corbard, T., Thompson, M. J., & Gilman, P. A. 2002, ApJ, 575, L41
- Foukal (1977) Foukal, P. 1977, ApJ, 218, 539
- Gilman & Foukal (1979) Gilman, P. A. & Foukal, P. V. 1979, ApJ, 229, 1179
- Guerrero et al. (2013) Guerrero, G., Smolarkiewicz, P. K., Kosovichev, A. G., & Mansour, N. N. 2013, ApJ, 779, 176
- Howe et al. (2006) Howe, R., Komm, R., Hill, F., et al. 2006, Sol. Phys., 235, 1
- Käpylä et al. (2006) Käpylä, P. J., Korpi, M. J., & Tuominen. 2006, Astronomische Nachrichten, 327, 884
- Kichatinov & Rudiger (1993) Kichatinov, L. L. & Rudiger, G. 1993, A&A, 276, 96
- Kitchatinov (2013) Kitchatinov, L. L. 2013, in IAU Symposium, Vol. 294, IAU Symposium, ed. A. G. Kosovichev, E. de Gouveia Dal Pino, & Y. Yan, 399–410
- Kitchatinov & Rüdiger (1999) Kitchatinov, L. L. & Rüdiger, G. 1999, A&A, 344, 911
- Kitchatinov & Rüdiger (2005) Kitchatinov, L. L. & Rüdiger, G. 2005, Astronomische Nachrichten, 326, 379
- Larson & Schou (2009) Larson, T. & Schou, J. 2009, in Astronomical Society of the Pacific Conference Series, Vol. 416, Solar-Stellar Dynamos as Revealed by Helio- and Asteroseismology: GONG 2008/SOHO 21, ed. M. Dikpati, T. Arentoft, I. González Hernández, C. Lindsey, & F. Hill, 311
- Mason et al. (2002) Mason, J., Hughes, D. W., & Tobias, S. M. 2002, ApJ, 580, L89
- Pijpers (1997) Pijpers, F. P. 1997, A&A, 326, 1235
- Ruediger (1989) Ruediger, G. 1989, Differential rotation and stellar convection. Sun and the solar stars (Berlin: Akademie Verlag, 1989)
- Scherrer et al. (1995) Scherrer, P. H., Bogart, R. S., Bush, R. I., et al. 1995, Sol. Phys., 162, 129
- Schou (1999) Schou, J. 1999, ApJ, 523, L181
- Schou et al. (1998) Schou, J., Antia, H. M., Basu, S., et al. 1998, ApJ, 505, 390
- Schou et al. (1994) Schou, J., Christensen-Dalsgaard, J., & Thompson, M. J. 1994, ApJ, 433, 389
- Schou et al. (2012) Schou, J., Scherrer, P. H., Bush, R. I., et al. 2012, Sol. Phys., 275, 229
- Spiegel & Zahn (1992) Spiegel, E. A. & Zahn, J.-P. 1992, A&A, 265, 106
- Thompson et al. (1996) Thompson, M. J., Toomre, J., Anderson, E. R., et al. 1996, Science, 272, 1300
- Warnecke et al. (2013) Warnecke, J., Käpylä, P. J., Mantere, M. J., & Brandenburg, A. 2013, ApJ, 778, 141
- Zaatri & Corbard (2009) Zaatri, A. & Corbard, T. 2009, in Astronomical Society of the Pacific Conference Series, Vol. 416, Solar-Stellar Dynamos as Revealed by Helio- and Asteroseismology: GONG 2008/SOHO 21, ed. M. Dikpati, T. Arentoft, I. González Hernández, C. Lindsey, & F. Hill, 99