On the superconductivity of the LixRhBy compositions
Abstract
We observed superconductivity ( 2-3 K) in LixRhBy intermetallics wherein and vary over a wide compositional range. The crystal structure consists of cubic unit-cell ( 12.1 Å) with centro-symmetric space group . A weak but positive pressure-induced increase of was observed. The correlations between the composition and each of the followings were followed over a wide range of and : the unit-cell dimensions, , Sommerfeld coefficient , Debye temperature , and critical fields Hc1 and Hc2. The thermal evolution of the electronic specific heat within the superconducting phase was observed to follow a quadratic-in- behavior. In addition, a paramagnetic Meissner Effect (PME) is manifested during a low-field-cooled magnetization cycle. This manifestation of quadratic-in- behavior and PME feature will be discussed.
I Introduction
Recently we reportedTakeya et al. (2011) the observation of superconductivity ( 2 to 3 K at ambient pressure) in a novel ternary LixRhBy phase. This phase was found to be stable over a wide range of the Li and B content (namely ) while maintaining (i) the same cubic unit-cell (12.1 Å, see Fig. 1), (ii) the same normal-state properties (e.g. Sommerfeld constant 3 mJ/molK2 and Debye temperatures 250K), and (iii) the same superconducting properties (e.g. 3K, 65Oe, 14 kOe). It happened that there is a difficulty in reconciling its thermodynamic properties with the reported symmetry of its crystal structure (see below).Takeya et al. (2011) In this work we resolve this difficulty by carrying out extensive structural, magnetic, magnetoresistivity, and thermal characterizations.
Our earlier structural analysis showed that based on the observed extinction rule [absence of (00l) lines for l=odd], the possible space groups was proposed to be either P213 or P4232. Given that these groups are characterized by a non-centrosymetric feature and that the Rh atom has a high -number, then it was concluded that Anisotropic Spin-Orbit Coupling, ASOC, effects should be manifested.Sigrist and Ueda (1991); Bauer et al. (2005); Sigrist et al. (2007); Frigeri et al. (2004) In general, the presence of such ASOC would lead to characteristic features such as: (i) A removal of the spin degeneracy which, in turn, would lead to an enhanced normal-state Pauli paramagnetism. (ii) An admixture of even-parity spin-singlet and odd-parity spin-triplet pairing states which may cause a manifestation of nodes in the structure of the quasiparticle gap function. As a results of such ASOC influences, many thermodynamical properties should exhibit a characteristic thermal evolution:Sigrist and Ueda (1991); Bauer et al. (2005); Sigrist et al. (2007); Frigeri et al. (2004) e.g. (i) the superconducting specific heat, , should manifest a power-in- behavior,Sigrist and Ueda (1991); Bauer et al. (2005); Sigrist et al. (2007); Frigeri et al. (2004) (ii) the susceptibility of the superconducting state should be increased, and (iii) the upper critical field should exceed the Pauli paramagnetic limit 3.Frigeri et al. (2005)
Our earlier thermodynamical characterization on LixRhBy indicated that while does exhibit a quadratic-in- behavior (expected for line nodes), neither the susceptibility nor the evolution of curve confirm such an unconventional character. One of the objectives of the present work is to address this contradiction.
It is shown below that the present structural analysis, carried out on more than four dozens of samples, indicate that the space group of these LixRhBy compositions is the centro-symmetric rather than the earlier reported non-centro-symmetric P213 or P4232:Takeya et al. (2011) this remove the contradiction between structural and thermodynamic properties. On the other hand, the above-mentioned contradiction among the thermodynamic properties will be discussed in term of conventional (rather than nonconventional) influences. Finally, we followed the evolution of the superconducting properties with the variation in the hydrostatic pressure as well as in the structural and material properties of these compositions (e.g. the unit-cell volume, stoichiometry, sample purity, defects concentrations ..etc.).
II Experimental
To the best of our knowledge, the stabilization of ternary Li-Rh-B compound was reported only for the following nonsuperconducting cases: (i) the hexagonal Li2RhB2 ( =8.45 Å and =4.287 Å),Jung and Schmidt (1976) and (ii) the orthorhombic Li2Rh3B2 ( =5.7712 Å, =9.4377 Å, =2.8301 Å).Baileya et al. (2007) Badica et al.Badica et al. (2007) attempted a synthesis of Li2Rh3B but the product was found to be multi-phasic consisting mainly of binary boride and elemental Li and B.
Polycrystalline samples of various LixRhBy compositions (0.4 3 and 1 2) were synthesized by standard solid state reaction of pure Li lump (99.9 %), Rh powder (99.95 %), and crystalline B powder (99 %). Rh and B were, first, mixed and pressed into pellets and afterwards, together with Li lump, were placed in a Ta foil or a BN crucible and sealed in a stainless container under an argon atmosphere. The container was heated up to 700-900 ∘C for 20 h and followed by furnace cooling. Afterwards these products were annealed at the same temperature range.
| Nominal | measured | ||||||||||||
|---|---|---|---|---|---|---|---|---|---|---|---|---|---|
| x,y | x | y | K | Å | Oe | kOe | nm | nm | kOe | mJ/molK2 | mJ/molK4 | J/molK | |
| Li0.8RhB1.5 | 0.87 | 1.47 | 2.4 | 12.079(1) | 83.5 | 13.7 | 15.5 | 15.7 | 0.29 | 9.6 | 3.3 | 0.46 | 0.024 |
| Li1.0RhB1.5 | 0.95 | 1.48 | 2.6 | 12.086(7) | 77 | 8.1 | 20.2 | 20.6 | 0.17 | 5.6 | 2.8 | 0.37 | 0.024 |
| Li1.2RhB1.5 | 1.02 | 1.52 | 2.6 | 12.089(9) | 65.6 | 14.2 | 14.4 | 14.5 | 0.3 | 9.8 | 2.4 | 0.40 | 0.024 |
The weight loss during the heating process was found to be less than 0.2 %. This result had been confirmed by the elemental analysis which was conducted using the Inductively Coupled Plasma (ICP) method on representative samples. Before the analysis, we used aqua regia first and then K2S2O7 to completely dissolve Rh. The analytical determinations of each element (given in Table 1) are close to the nominal compositions: an assuring result considering that both Li and B are light elements and the former is volatile.
Structural analysis of all investigated polycrystalline samples were carried out on a monochromatic Cu diffractometer equipped with a Si detector (representative diagrams are shown in Fig. 1). Magnetization curves were measured on a superconducting quantum interference device (SQUID) magnetometer. Bulk samples were cut into a cylindrical shape (0.45 x0.50 cm) and sealed in a gelatin capsule (all handled in an inert-gas glove box). Pressure-dependent magnetization curves were measured with a low-temperature hydrostatic micro pressure cell (up to 1 GPa) operated within a SQUID environment. Daphne oil was used as a pressure-transmitting fluid while Sn as a manometer. Magnetoresistance curves were measured on parallelepiped samples of typical 0.11x0.12x0.45 cm3 dimensions. We used a conventional DC, four-points method (1 mA) in a home-made probe which was operated within the environment of the above-mentioned magnetometer. Zero-field specific heat measurements were carried out on a semi-adiabatic calorimeter operating within the range of 0.5 23 K with a precision better than 4%.
During all experiments, care was exercised so as to avoid air/moisture exposure since such exposure was found to cause a dimming of metallic luster and, furthermore, a reduction in both and superconducting volume fraction. As such, samples were usually covered with apiezon N grease and guarded in an inert atmosphere (for remeasurement, grease was wiped off).
Some samples show double superconducting transitions in the magnetization, resistivity, or specific heat. Given that of these transitions are 2 to 3 K and that the measured diffractograms do not exhibit any of the known superconducting contaminant phases (see caption of Fig. 1 and text below), then the manifestation of such double transitions is most probably related to the granular character of these samples or to an unknown ternary phase.
III Results
III.1 Structural Analysis
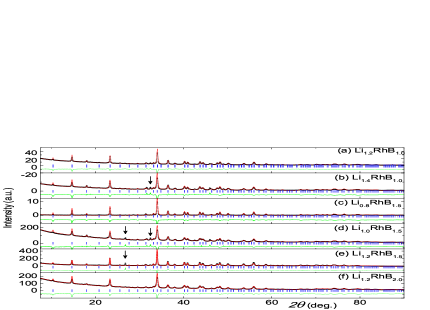
Extensive structural and elemental analyses were carried out on more than four dozens of LixRhBy compositions covering the range of 0.6 1.4 and 0.5 2 while keeping Rh stoichiometry fixed. As can be seen in the representatives Figs. 1-2(upper panel) and Table 1 as well as the electron diffraction patterns of Ref. Takeya et al., 2011, the almost single phase is stable over the range 0.8 1.5 and 1 2 but its concentration is strongly decreased when or is far from this range. All related Bragg lines can be indexed if one adopts a large-sized cubic unit-cell (see, e.g., Fig. 1).
The wide variation in Li and B content as well as their low atomic scattering factors make it extremely difficult to ascertain correctly their stoichiometry or to calculate the involved density. Nonetheless, application of extinction rules on resolution-improved diffractograms suggested that the space group is the centrosymmetric . Furthermore, using Le-Bail method and Patterson maps, the atomic position of the heavier Rh atoms are conclusively identified (for more details see Ref.Amorim et al., ): Rh occupies the Wyckoff positions and . Furthermore, it seems that B occupies the position leading to the formation of some distorted and others undistorted octahedrons: a features also common in other Rh-B compositions. It is noted that although these structural considerations lead only to partial determination and that further elucidation requires the identification of the exact stoichiometry and positions of Li and B atoms (a task which would be much effectively served by using, e.g., neutron diffraction analysis), nonetheless the calculated Rietveld patterns (Fig. 1) compares favorably with experiments and, as such, confirm the correct identification of the space group, all Rh positions, and one position of B.Amorim et al. Another encouraging evidence is that on taking LixRhBy with, say, 1 or 1.5, one calculates a density of 6.8 to 7.3 g/cm3 which is comparable to 7.35 g/cm3 of Li2Rh3B2;Baileya et al. (2007) unfortunately, due to the strong porous character of these materials, we were unable to measure their density by conventional methods.Amorim et al.
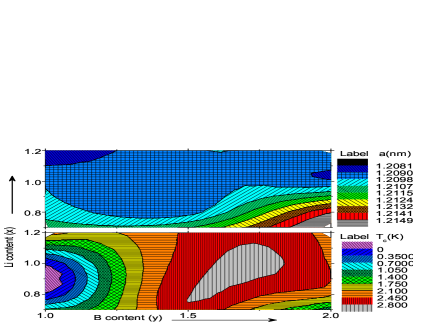
The correlation of the unit-cell -parameter with the Li/B content is shown in the upper contour plot of Fig. 2: evidently, on fixing Li (B) content and varying B (Li) concentration, the evolution of the -parameter does not reflect any Vegard’s law. In fact, a variation in the small-sized Li and B in LixRhBy over the whole range of 0.4 3 and 1 2 modifies the unit-cell volume by only 1.1%: this emphasizes the crucial role of Rh sublattice.
III.2 Magnetization
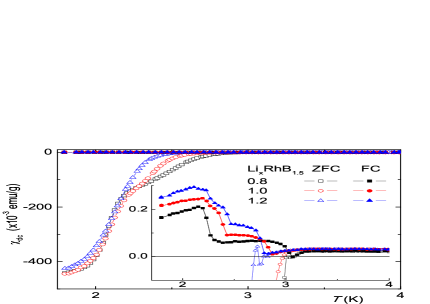
Zero-Field-Cooled (ZFC) magnetization of LixRhBy (Fig. 3) exhibit a strong shielding signal. Field-Cooled (FC) magnetization, on the other hand, indicates a Paramagnetic Meissner Effect (PME): a negative drop immediately below followed by a surge of a net (positive) paramagnetism, indicative of spontaneous magnetic moment, well below . The XRD diffractograms of these three representative samples are shown in Fig. 1(c, d, e), each is practically a single-phase cubic structure. This together with the observed thermal evolution of this effect (as well as that of isothermal field-dependent magnetization for ) indicate that it is not related to an extrinsic contaminating paramagnetic centres. Generally, PME appears in granular superconductors wherein inverse Josephson Couplings (the so-called contacts) are formed at the boundaries of multiply-connected superconducting grains.Khomskii (1994); Li (2003); Sigrist and Rice (1995) Such boundaries may arise either due to extrinsic (such as disorder or impurity) or intrinsic factors (such as boundaries that connect differently oriented crystallites of superconductors with unconventional pairingSigrist and Rice (1995)). As that the space group is centrosymmetric then no strong ASOC effects are expected and the presence of PME is most probably related to extrinsic factors or extreme porosity:Amorim et al. indeed the strength of the PME varies within different batches of the same sample.
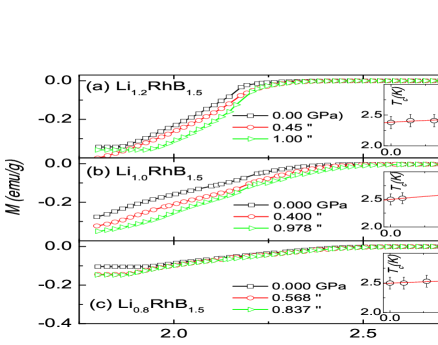
The obtained is shown as a function of the Li/B content in Fig. 2: reaches a maximum within an approximate triangle-shape region having () vertices as (0.8, 1.5), (1.0, 1.8) and (1.2, 1.6). Accordingly, the three LixRhB1.5 () samples were extensively studied since they are faithful representatives of the whole series. Their -parameters stabilize around 12.08-12.10 Å (see Fig. 2). Furthermore, a variation in their Li/B content influences , most probably through an induced variation in (), Debye temperature , or pairing interaction [e.g. as in the BCS relation ]. As most of these parameters can be varied through pressure, we investigated as well the influence of applied pressure () on the superconductivity of these LixRhBy compositions. The pressure-dependent magnetization (Fig. 4) indicates that both the superconducting fraction and are weakly enhanced. In particular, for pressure up to 1 GPa and to a second order in , ( in GPa) where = 2.50, 2.50, 2.38 K; =0.09, 0.24, 0.13 K/GPa; = 0.01,-0.09, -0.05 for LixRhB1.5 (=0.8,1.0,1.2, resp.). Evidently the overall pressure influence is almost linear and rather weak. Relatively, Li1.0RhB1.5 (mid-panel of Fig. 4) exhibits a more pronounced -induced variation.
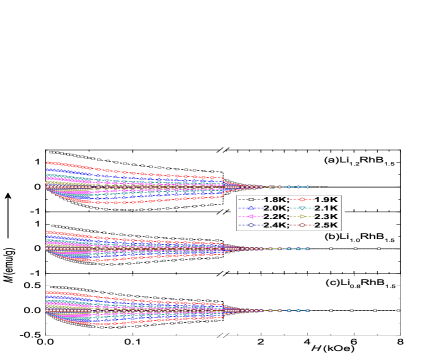
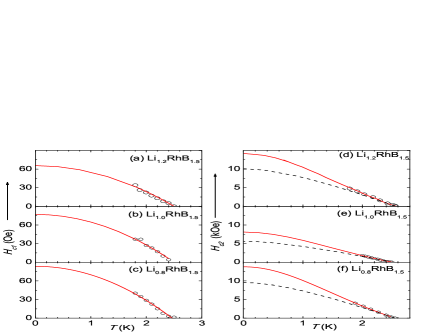
Figure 5 shows the isothermal magnetization curves of LixRhB1.5: typical type-II curves with no strong positive normal-state paramagnetic susceptibility (absence of strong polarization). This latter result is in agreement with the same features exhibited in Figs. 3-4: all confirm the absence of ASOC effects. Based on these isothermal curves of Fig. 5, we determined the thermal evolution of (for , see below) which, as can be seen in Figs. 6(a-c), follows reasonably well the relation =[1-()2] wherein and are as given in Table 1.
III.3 Magnetoresistivity
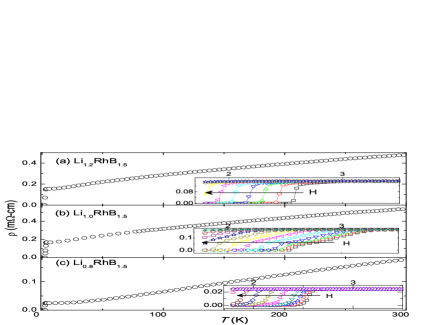
The thermal evolution of the resistivity of LixRhB1.5, K, shown in Fig. 7, indicates a metallic normal state. For most samples, 300 K) 0.48 m-cm while the residual resistivity (in the immediate range above ) is 0.12 m-cm: that RRR4 suggests additional scattering processes (e.g. a random atomic distribution, interstitial or substitutional defects related to Li/B nonstoichiometry). Fig. 7 indicate also a superconducting state with a transition which, due to percolation, are much sharper and narrower than the ones observed in the magnetizations or specific heats. Because of these advantageous features, , Fig. 6, was determined from the midpoint of the transition occurring in each of curve of Fig. 7 rather than from the event occurring in each isotherm of Fig. 5.
III.4 Specific Heat
The specific heats of LixRhBy samples evolves, within K, as [Ref.Takeya et al., 2011]: and are given in Table 1. Just like and lattice parameter, there is a weak Li-dependence of both and ; , in particular, decreases slightly as Li content is increased.
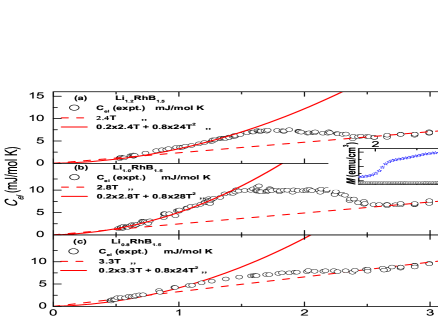
The electronic contribution, , obtained after subtracting the Debye part (), is shown in Fig. 8. For a conventional BCS-type gapped superconductor, the electronic contribution below is dominated by an exponential-in- behavior. Fig. 8 does not show any exponential evolution and as such the gap is either not fully-developed or blurred by some anomalous behavior. The origin behind such a behavior may be revealed if one obtains an analytical expression of the thermal evolution of . But first let us evaluate whether is due solely to the superconducting phase contribution. In that regard, the inset of Fig. 8 indicate that the typical superconducting shielding fraction of these samples is 80% of the signal obtained from a similar-sized Sn sample.Takeya et al. (2011) It was assumed that the residual normal-state gives rise to a contribution. Fig. 8 indicates that the relation = describes reasonably well the electronic contribution. The obtained values of are similar for all compositions, namely 24 mJ/molK: this suggests a correlation between and the electronic contribution of the Rh sublattice since such a contribution does not vary across the studied samples. Though the arguments given in Ref. Takeya et al., 2011 attributed such a quadratic-in- behavior to line nodes, our present understanding (based on the above-mentioned crystallographic and thermodynamics arguments) is that this power relation may be related to distribution effects arising from, say, variation in the Li/B content (for evidences regarding see below).
IV Discussion and Conclusions
Based on the correlation between and the volume (V) shown in Fig. 2, one expects:
where is the compressibility of the solid. Although there are no information on , V, or lattice anisotropy, it is possible to correlate the observed weak pressure-dependence of with the general features of the upper panel of Fig. 2: these particular samples are situated within a Li/B region wherein the overall variation of with V (thus with pressure) is weak; even more weaker dependence is observed for regions with an excess or deficiency of the Li content. From these features (see also Table 1), it can be concluded that a variation in pressure or Li content (B is fixed) would not bring about any strong variation in , (), , or .
The thermal evolution of each curve, shown in Figs. 6 (d-f), was analyzed in terms of (i) the quadratic Ginzburg-Landau relation () = [(1-)/(1+)] and (ii) the Werthamer–Helfand–Hohenberg (WHH) expressionWerthamer et al. (1966); Hake (1967) which is usually parameterized in terms of (a measure of the Pauli spin effect) and (a measure of the spin-orbit scattering). While is a fit parameter, is taken to be determined experimentally, based on the relationWerthamer et al. (1966); Hake (1967) , giving 0.17, 0.29, 0.3 for =0.8, 1.0 and 1.2, respectively. As expected, both descriptions of reproduce satisfactorily the measured curves within the range . In fact, both descriptions are reasonable within the available temperature range since this range is still very close to (). In general, the WHH description is more appropriate for the range : accordingly, we used the relation to evaluate giving 5.6, 9.6 and 9.8 kOe for =0.8, 1.0 and 1.2, respectively. Such values are surprisingly low. In fact it is one order of magnitude lower than the paramagnetic limit 3 80 kOe. As such this constitutes an additional evidence which (together with the above-mentioned ones) confirms the absence of ASOC effects. Indeed, in spite of the higher value of Rh, the WHH analysis of (Fig. 6) indicate no significant role for the parameter. Accordingly, in these LixRhBy compositions is taken to be determined by the standard orbital driven depairing process.
In summary, LixRhBy compositions form a new class of Li-based superconductors. The variation in Li/B ratio is accompanied by a weak change in the unit-cell length, in the normal-state properties (e.g. , ), and in the superconducting properties (e.g. , , and ). Many of the studied parameters are interrelated: as an example, the -parameter and are correlated and, furthermore, this same correlation is evident in the positive pressure dependence of . As these materials are centrosymmetric superconductors, the observations of PME during the field-cooled cycle and a quadratic-in- superconducting specific heat are attributed to conventional (rather than nonconventional) features such as inhomogeneous distribution of defects or Li/B atoms. Indeed the thermal evolution of can be described by a conventional WHH expression. Finally, based on the observed correlation between composition, and of LixRhBy, it would be very interesting to carry out a systematic study on the Li-- series (= transition metal, =B, As, Si, Ge).
Acknowledgements.
The authors are grateful to the ”Foundation for Promotion of Material Science and Technology of Japan (MST Foundation)” for the financial support. We also acknowledge the partial support received from the Japan Society for the Promotion of Science.References
- Takeya et al. (2011) H. Takeya, H. Fujii, M. ElMassalami, F. Chaves, S. Ooi, T. Mochiku, Y. Takano, K. Hirata, and K. Togano, J. Phys. Soc. Jpn. 80, 013702 (2011).
- Sigrist and Ueda (1991) M. Sigrist and K. Ueda, Rev. Mod. Phys. 63, 239 (1991).
- Bauer et al. (2005) E. Bauer, I. Bonalde, and M. Sigrist, Low Temp. Phys. 31, 748 (2005).
- Sigrist et al. (2007) M. Sigrist, D. F. Agterberg, P. A. Frigeri, N. Hayashi, R. P. Kaur, A. Koga, I. Milat, K. Wakabayashia, and Y. Yanase, J.M.M.M, 310, 536 (2007).
- Frigeri et al. (2004) P. A. Frigeri, D. F. Agterberg, and M. Sigrist, New J. Phys 6, 115 (2004).
- Frigeri et al. (2005) P. Frigeri, D. Agterberg, A. Koga, and M. Sigrist, Physica B: Condensed Matter 359-361, 371 (2005), proceedings of the International Conference on Strongly Correlated Electron Systems.
- Jung and Schmidt (1976) W. Jung and B. Schmidt, Naturwissenschaften 63, 583 (1976).
- Baileya et al. (2007) M. S. Baileya, E. B. Lobkovskyb, D. G. Hinksa, H. Claus, Y. S. Hora, J. A. Schluetera, and J. F. Mitchella, J. Solid State Chem. 180, 1333 (2007).
- Badica et al. (2007) P. Badica, K. Togano, H. Takeya, K. Hirata, S. Awaji, and K. Watanabe, Physica C 460-462, 91 (2007).
- (10) H. S. Amorim et al., To be published.
- Thompson et al. (1995) D. J. Thompson, M. S. M. Minhaj, L. E. Wenger, and J. T. Chen, Phys. Rev. Lett. 75, 529 (1995).
- Khomskii (1994) D. Khomskii, Journal of Low Temperature Physics 95, 205 (1994).
- Li (2003) M. S. Li, Physics Reports 376, 133 (2003).
- Sigrist and Rice (1995) M. Sigrist and T. M. Rice, Rev. Mod. Phys. 67, 503 (1995).
- Werthamer et al. (1966) N. R. Werthamer, E. Helfand, and P. C. Hohenberg, Phys. Rev. 147, 295 (1966).
- Hake (1967) R. R. Hake, Phys. Rev. 158, 356 (1967).