11email: marat@sao.ru 22institutetext: Kazan Federal University, 18 Kremlyovskaya St., Kazan, 420008, Russia 33institutetext: Finnish Centre of Astronomy with ESO (FINCA), University of Turku, Väisäläntie 20, FI-21500 Piikkiö, Finland 44institutetext: Aalto University Metsähovi Radio Observatory, Metsähovintie 114, 02540 Kylmälä, Finland
RATAN-600 multi-frequency data for the BL Lac objects ††thanks: The catalogue is presented in interactive form and available at Special Astrophysical Observatory of the Russian Academy of Sciences website http://www.sao.ru/blcat/
Abstract
Aims. We present a new catalogue of the RATAN-600 multi-frequency measurements for BL Lac objects. The purpose of this catalogue is to compile the BL Lac multi-frequency data that is acquired with the RATAN-600 simultaneously at several frequencies. The BL Lac objects emit a strongly variable and polarized non-thermal radiation across the entire electromagnetic spectrum from radio to rays and represent about 1% of known AGNs. They belong to the blazar population and differ from other blazars’ featureless optical spectrum, which sometimes have absorption lines, or have weak and narrow emission lines. One of the most effective ways of studying the physics of BL Lacs is the use of simultaneous multi-frequency data.
Methods. The multi-frequency broadband radio spectrum was obtained simultaneously with an accuracy of up to 1-2 minutes for four to six frequencies: 1.1, 2.3, 4.8, 7.7, 11.2, and 21.7 GHz. The catalogue is based on the RATAN-600 observations and on the data from: equatorial coordinate and redshift, R-band magnitude, synchrotron peak frequency, SED classes and object type, literature.
Results. The present version of the catalogue contains RATAN-600 flux densities measurements over nine years (2006–2014), radio spectra at different epochs, and their parameters for more than 300 BL Lacs objects and candidates. The BL Lacs list is constantly updated with new observational data of RATAN-600.
Key Words.:
galaxies: BL Lacertae objects: general – catalogues1 Introduction
The objects of BL Lacertae-type (BL Lac or BLO) are a relatively rare class of active galactic nuclei (AGN); they represent about 1% of known AGN (Plotkin et al., 2008). They emit electromagnetic radiation across the entire spectrum from radio to rays (Urry & Padovani, 1995). The BL Lacs are characterised by the absent or weak emission lines in the optical spectrum, the strong and rapid variations in intensity, and polarization (Strittmatter et al., 1972; Kollgaard, 1994; Urry & Padovani, 1995; Snellen et al., 1998). These objects are known to be radio-loud; it is usually explained with the presence of relativistic jet, which is disposed at a small angle to the line of sight of the observer ( ). Thereby, relativistic effects play a major role in the formation of observational properties of BL Lacs (Blandford & Rees, 1978). Systematic studies of BL Lacs objects were historically limited to the shallow surveys and small incomplete observation samples, which had a major systemic effect on the results (Plotkin et al., 2008; Massaro et al., 2009). Unlike other types of AGNs, BLO objects were detected in radio and X-ray surveys (Stocke et al., 1990), which are followed by separation of the class into two large groups, XBLs (X-ray selected BLOs) and RBLs (radio-selected BLOs). Various observational properties (intensity, polarization variability, and luminosity) suggest that these objects may have a different nature. Radio-selected objects are on average more luminous, variable, and polarized, and their structure is more core-dominated than that of X-ray-selected objects (Perlman & Stocke, 1993; Jannuzi et al., 1994; Morris et al., 1991; Padovani, 1992). In the past ten years, the Sloan Digital Sky Survey (SDSS) has presented an opportunity to search for BL Lac objects by exploiting their featureless optical continuum one of their defining characteristics. The SDSS surveys have been used to produce a catalogue of candidate BL Lac objects by finding quasi-featureless spectra within their huge spectroscopic databases (Collinge et al., 2005). This type of BLOs could be classified as optically-selected (OBLs).
The spectral energy distribution (SED) of the blazars is characterised by two broad features. The feature peaking at lower energy is generally explained in terms of synchrotron emission and the second feature, which peaks at higher energies, is likely due to the Inverse Compton scattering. We adopt BL Lac classification from Nieppola et al. (2006). According to the synchrotron peak frequency (), the BL Lacs can be separated to three subclasses: HSPs, ISPs and LSPs (HSPs, which are BL Lacs having higher than , LSPs, which have a lower than and ISPs, which have an intermediate synchrotron peak). In general, HSPs are very weak at the radio band (Nieppola et al., 2007) and often correspond to X-ray-selected objects, while LSPs are related to radio-selected objects.
Most of BL Lac samples are based on the cross-correlation of existing radio and X-ray catalogues (Turriziani et al., 2007). “Roma-BZCAT: a multi-frequency catalogue of blazars” (Massaro et al., 2009) is the most popular catalogue of the blazars for today. It is based on multi-frequency data from various surveys and includes 1221 objects of BL Lac type (for Edition 4.1.1). For this catalogue and some others (e.g., Plotkin et al. (2008)), the multi-frequency and simultaneous observation data covering long time intervals are presented for a relatively small number of objects. The number of new BL Lac candidates is growing constantly, and this is due to the large number of the new sky missions in different frequency ranges. Many of BL Lacs have only been observed once or twice, and their nature is still not clear.
Long-term monitoring is also important because of the variability present in BL Lacs. Sometimes, some sources show changes in the flux density of up to hundreds of a percent, but they are also observed to remain in the quiescent state for years (see, e.g., Wagner & Witzel (1995)). A detailed, versatile, and prolonged research of BL Lacs is essential for understanding the AGN phenomenon, which are unusual properties of these objects and unique physical processes occurring there (emission mechanisms in details, origin of the emitted photons, jets structure, etc.). That is why it could be useful and important to collect multi-frequency data, which is measured quasi-simultaneously at one instrument for a long period of time.
Hereinafter, we refer to the catalogue as “BLcat”. Observational data and radio properties corresponding to each object from our catalogue are available in Mingaliev et al. (2001, 2007, 2012). In this paper, we present the common organisation of the electronic catalogue of the BL Lac objects. The paper is organized as follows. In Section 2, we describe RATAN-600 observations and characteristics of the receivers. In Section 3, we present the general organisation of the catalogue. The sample properties are given in Section 4, where we describe the flux densities, radio continuum spectra, variability, spectral indices, and also SED classes. The detail analysis of radio properties of objects from BLcat are presented in Mingaliev et al. 2014 (in preparation).
2 RATAN-600 observations
The observations were carried out with the RATAN-600 radio telescope during 2006-2014. This list originally included 108 objects from the Metsähovi BL Lac sample (Nieppola et al., 2006). Systematic monitoring was carried out during the period of 2006–2008 for these sources. In 2009–2011, we have observed only a part of sample, due to constraints on observing time. We considerably increased the size of (by more than a factor of three) our BL Lac sample since 2012, and thus, most of the newly added sources have been observed only a couple of times. Since 2012, we added sources with the flux density greater than 400 mJy at 1.4 GHz; since 2014, we began adding BL Lacs with a flux density greater than 100 mJy.
Observations were carried out with two sets of radiometers. The first ones (noted as “1” in Table 1) at the wavelength 1.38, 2.7, 3.9, 6.2 cm (cryogenically cooled), and 1.1 and 2.3 cm (uncooled). The second set is uncooled (noted as “2”) at the wavelength 1.38, 2.7, and 6.2 cm. All the radiometers were designed as the “direct amplification Dicke type” receivers. The 6.2 cm cooled radiometer is a noise added radiometer (NAR), while other radiometers are designed according to the beam-switching scheme. For all continuum radiometers, we use the data acquisition and controling system, as described by Tsybulev (2011).
Observations were made in a transit mode at the north and south sectors of the antenna, and the multi-frequency broadband radio spectrum was obtained by observing simultaneously with an accuracy of up to 1-2 minutes (Parijskij, 1993). An angular resolution in this mode of observations depends on a declination of a source being observed. The FWHM in right ascension (RA) is given in Table 1; an angular resolution in declination is three to five times worse than in RA. The experimental data were processed using the modules of the FADPS (Flexible Astronomical Data Processing System) standard reduction package by Verkhodanov (1997). This is a data reduction system for broadband continuum radiometers of the RATAN-600. The data processing technique is described in Mingaliev et al. (2012). The following twelve flux density calibrators (standard and RATAN’s traditional ones) were used to get the coefficients of antenna elevation: 3C48, 3C138, 3C147, 3C161, 3C286, 3C295, 3C309.1, NGC7027, J023723, J115435, J134712, and J041076. Measurements of some calibrators were corrected for angular size and linear polarization, following the data summarized in Ott et al. (1994) and Tabara & Inoue (1980), respectively.
The detection limit for the RATAN-600 single sector is approximately 8 mJy (integration time is about 3 sec) under good conditions at the frequency of 4.8 GHz and at an average antenna elevation (). At other frequencies, the detection limits for two radiometer systems are presented in the Table 1. These values depend on the atmospheric extinction instability and the effective area at the antenna elevation (from up to above the horizont) at the corresponding frequencies.
| FWHM | ||||||
|---|---|---|---|---|---|---|
| (GHz) | (GHz) | (mJy/beam) | (arcsec) | |||
| 1 | 2 | 1 | 2 | 1 | 2 | |
| 11 | ||||||
| 16 | ||||||
| … | … | … | 22 | |||
| 36 | ||||||
| … | … | … | 80 | |||
| … | … | … | 170 | |||
Due to the observational conditions and the natural limits set by the source flux levels, the number of data epochs vary from tens to one at the beginning of 2014. Each set contains averaged measurements from three to ten transit scans.
3 General organisation of the catalogue
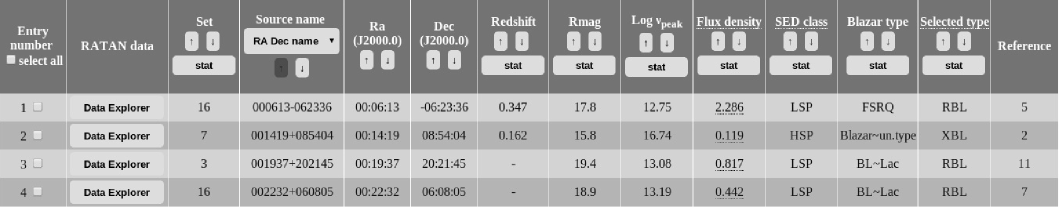
The current version of the catalogue includes more than 300 blazars, most of them are BL Lac objects and candidates. The main part of the catalogue is multi-frequency measurements, which are obtained quasi-simultaneously with one instrument. The list of objects with their general parameters and RATAN-600 data are presented in an online form. The main table displays the number of RATAN-600 observations, equatorial coordinates, names, redshifts, magnitudes in R-band, average flux densities (from RATAN-600 data), synchrotron peak frequencies, SED classes (LSP, ISP, HSP), blazar (BL Lac, BL Lac candidate or Blazar uncertain type), selected (XBL, OBL, RBL) types, and ADS references. The second part of catalogue consists of RATAN-600 measurements of objects at four to six frequencies in the period from 2006 to 2014.
The object list (Fig. 1) is available in electronic form in different formats in the “Export the main Table and RATAN-600 data” button. The RATAN-600 data are available in the form of radio continuum spectra and light curves (Fig. 2), flux density tables with the date of observation in the “Data Explorer” or “Export the main Table and RATAN-600 data” button.
For six sources (two ISP and four HSP), we have no observational data, because they are too faint (tens of mJy) to detect their flux density. With the tool “Export the main Table and RATAN-600 data”, one can extract fluxes, date of observation, spectral indicies calculated at different frequency intervals, and download as a CSV format text file. The spectral index describes the slope of the spectrum, and it is one of the important characteristics of the radio spectrum. We calculated spectral indices using the formula:
| (1) |
where and are the flux densities at the frequencies and , respectively.
To characterize the variability properties of the sources at the various frequencies, we have computed the variability index. The variability index was calculated using the formula, as adopted by Aller et al. (1992):
| (2) |
where and are the maximum and minimum value of the flux density at all epochs of observations; and are their RMS errors.


4 The sample properties
4.1 Classification
The main table presents the classification of blazars by Massaro et al. (2009), which is based on the spectral properties. The BL Lac objects have a featureless optical spectrum, or only have absorption lines and weak narrow emission lines (rest-frame equivalent width, EW5Å) (Padovani & Giommi, 1995). Flat-spectrum radio quasars (FSRQ) have broad emission lines in their spectrum, and a property that is as strong as non-thermal emission from radio waves to the -rays, which is a presence of evidence for relativistic beaming. Blazars of an uncertain type (Blazar un.type) are the sources with peculiar characteristics and that show blazar activity. There are seven FSRQs in the list. This because these objects were classified as a BL Lac initially in the Veron-Cetty and Veron BL Lac Catalogue (Veron-Cetty & Veron 2000), and they were observed with RATAN-600 within the BL Lacs monitoring program.
| Designation criterion | Class | Number |
|---|---|---|
| Optical spectrum | BL Lac | 220 |
| BL Lac cand. | 43 | |
| Blazar un.type | 36 | |
| FSRQ | 7 | |
| Selection method | RBL | 248 |
| XBL | 56 | |
| OBL | 2 | |
| SED type | LSP | 141 |
| ISP | 102 | |
| HSP | 63 |
The majority of sources are BL Lac objects and candidates; 10% are uncertain Blazar-type objects and only seven are FSRQ type sources. The sample subpopulations are presented in Table 2. The abbreviation RBL/OBL/XBL corresponds to the frequency range, where the object was selected. There are two OBL-type sources in the list for today (US1889 and SDSSJ16581+6150). Most of the BL Lacs are RBL-type sources (248) and 56 are XBL-type.
The redshift values were taken from Roma-BZCAT and NASA/IPAC NED database. Redshift values are known for the most of sources of the catalogue (241), and the peak of the redshift distribution occurs at 0.25.
4.2 Flux densities and radio continuum spectra
The flux densities of 300 sources are given in the table form of the catalogue. The flux density uncertainties for the corresponding frequencies include the uncertainty in the source’s antenna temperature and calibration curve. Most objects have the data at 7.7 and 4.8 GHz. The absence of data for some sources at some frequencies is a result data exclusion because of the partial resolution of a source, a source that is too weak to be measured reliably, a strong influence of man-made interference in the decimeter, and strong interferences from the geostationary satellites at 11.2 GHz (in the declinations between and ). Nevertheless, in some cases, the data was not excluded in spite of the increase in errors. The values of the standard error of fluxes for the most sources are: 5-20% for 11.2, 7.7, and 4.8 GHz; and 10-35% for 2.3, 1.0, and 21.7 GHz.
Some sources in this database are extremely faint at radio frequencies, and this is the first time that their radio spectra have been measured reliably. The flux densities and spectra are studied in more detail in Mingaliev et al. 2014.
4.3 The synchrotron peak frequency and SED class
The synchrotron peak frequencies for some sources were calculated from a parabolic fit to their SEDs (Nieppola et al., 2006), and for the most objects, we used “SED Builder” tool222http://tools.asdc.asi.it/SED. Those values marked with “*”. The peak of the distribution occurs at 13.6 Hz for the current sample. We note that some objects do not have enough data points for a reliable estimations of . In these cases, the synchrotron peak frequency value depends on the method of calculation (polynomial degree, for example). If there are only data points in the low frequency range (radio domain), the peak shifts to the low frequency region (see, for example, +). Any new observations at high frequencies (optical and ultraviolet) improve the accuracy of the peak value. Therefore, the presented SED types are not complete and depend on the new observational data. The LSP class of BL Lac dominates in the current version of the catalogue (141 sources), since we initially observed radio loud sources more often than others. There are 102 objects with an intermediate synchrotron peak (ISP) and 63 objects with a high frequency of synchrotron peak (HSP).
5 Conclusion
In this paper, we describe a practical tool, based on the BL Lac observations with the RATAN-600 radio telescope for researchers. This catalogue is an useful object list useful in the research of BL Lacertae populations, or statistical studies of radio properties and evolution. The main goal of this catalogue is to remedy the lack of data for these objects in the radio domain. The “BLcat”, which is a collection of the multi-frequency (1–21.7 GHz) radio band measurements, are obtained quasi-simultaneously with a single instrument over the course of several years. All the data are presented online in a convenient form with interactive features. Now, everyone can quickly have a look to the behaviour of a certain BL Lac object from our list at the radio band, which includes examining spectra evolution or light curves; some basic characteristics of the objects are also presented. The present version includes more than 300 objects. The majority of them are BL Lac objects and candidates, which about 10% are Blazar uncertain type objects.
The online catalogue is updated regularly and filled with new and previous observational data from the RATAN-600 radio telescope. The catalogue is available from the Special Astrophysical Observatory of the Russian Academy of Sciences (SAO RAS) website at http://www.sao.ru/blcat/.
Acknowledgements.
We are very grateful to other online astronomical databases, that we actively used. We acknowledge the NASA Extragalactic Database (NED) (http://ned.ipac.caltech.edu/), ASDC web Tools (particularly “SED Builde” tool http://tools.asdc.asi.it/SED), and Roma-BZCAT - Multi-frequency Blazar Catalogue (http://www.asdc.asi.it/bzcat/). The RATAN-600 observations were carried out with the financial support of the Ministry of Education and Science of the Russian Federation (14.518.11.7054) and Russian Foundation for Basic Research (12-02-31649).References
- Aller et al. (1992) Aller, M. F., Aller, H. D., & Hughes, P. A. 1992, ApJ, 399, 16
- Blandford & Rees (1978) Blandford, R. D. & Rees, M. J., eds. 1978, Some comments on radiation mechanisms in Lacertids
- Collinge et al. (2005) Collinge, M. J., Strauss, M. A., Hall, P. B., et al. 2005, AJ, 129, 2542
- Jannuzi et al. (1994) Jannuzi, B. T., Smith, P. S., & Elston, R. 1994, ApJ, 428, 130
- Kollgaard (1994) Kollgaard, R. I. 1994, Vistas in Astronomy, 38, 29
- Massaro et al. (2009) Massaro, E., Giommi, P., Leto, C., et al. 2009, A&A, 495, 691
- Mingaliev et al. (2007) Mingaliev, M. G., Sotnikova, Y. V., Bursov, N. N., Kardashev, N. S., & Larionov, M. G. 2007, AZh, 51, 343
- Mingaliev et al. (2012) Mingaliev, M. G., Sotnikova, Y. V., Torniainen, I., Tornikoski, M., & Udovitskiy, R. Y. 2012, A&A, 544, 1
- Mingaliev et al. (2001) Mingaliev, M. G., Stolyarov, V. A., Davies, R. D., et al. 2001, A&A, 370, 78
- Morris et al. (1991) Morris, S. L., Stocke, J. T., Gioia, I. M., et al. 1991, ApJ, 380, 49
- Nieppola et al. (2007) Nieppola, E., Tornikoski, M., Lähteenmäki, A., et al. 2007, AJ, 133, 1947
- Nieppola et al. (2006) Nieppola, E., Tornikoski, M., & Valtaoja, E. 2006, A&A, 445, 441
- Ott et al. (1994) Ott, M., Witzel, A., Quirrenbach, A., et al. 1994, A&A, 284, 331
- Padovani (1992) Padovani, P. 1992, A&A, 256, 399
- Padovani & Giommi (1995) Padovani, P. & Giommi, P. 1995, ApJ, 444, 567
- Parijskij (1993) Parijskij, Y. N. 1993, IEEE Antennas and Propagation Magazine, 35
- Perlman & Stocke (1993) Perlman, E. S. & Stocke, J. T. 1993, ApJ, 406, 430
- Plotkin et al. (2008) Plotkin, R. M., Anderson, S. F., Hall, P. B., et al. 2008, AJ, 135, 2453
- Snellen et al. (1998) Snellen, I. A. G., Schilizzi, R. T., Bremer, M. N., et al. 1998, MNRAS, 301, 985
- Stocke et al. (1990) Stocke, J. T., Morris, S. L., Gioia, I., et al. 1990, ApJ, 348, 141
- Strittmatter et al. (1972) Strittmatter, P. A., Serkowski, K., Carswell, R., et al. 1972, ApJ, 175, L7
- Tabara & Inoue (1980) Tabara, H. & Inoue, M. 1980, A&AS, 39, 379
- Tsybulev (2011) Tsybulev, P. G. 2011, Astrophysical Bulletin, 66, 109
- Turriziani et al. (2007) Turriziani, S., Cavazzuti, E., & Giommi, P. 2007, A&A, 472, 699
- Urry & Padovani (1995) Urry, C. M. & Padovani, P. 1995, PASP, 107, 803
- Verkhodanov (1997) Verkhodanov, O. V. 1997, Astronomical Data Analysis Software and Systems VI, A.S.P. Conference Series, 125, 46
- Wagner & Witzel (1995) Wagner, S. J. & Witzel, A. 1995, ARA&A, 33, 163