11email: smartin@iram.fr 22institutetext: Institute of Astronomy, The University of Tokyo, 2-21-1 Osawa, Mitaka, Tokyo 181-0015, Japan 33institutetext: Research Center for the Early Universe, The University of Tokyo, 7-3-1 Hongo, Bunkyo, Tokyo 113-0033, Japan 44institutetext: New Mexico Institute of Mining and Technology, 801 Leroy Place, Socorro, NM, USA 55institutetext: National Radio Astronomy Observatory, Pete V. Domenici Array Science Center, P.O. Box O, Socorro, NM, 87801, USA 66institutetext: European Southern Observatory, Alonso de Córdova 3107, Vitacura, Casilla 19001, Santiago 19, Chile 77institutetext: Academia Sinica, Institute of Astronomy & Astrophysics, P.O. Box 23-141, Taipei 10617, Taiwan 88institutetext: Nobeyama Radio Observatory, Nobeyama, Minamimaki, Minamisaku, Nagano 384-1305, Japan 99institutetext: Department of Astronomical Science, The Graduate University for Advanced Studies (Sokendai), Nobeyama, Minamimaki, Minamisaku, Nagano 384-1305, Japan 1010institutetext: Department of Physics and Astronomy, UCLA, 430 Portola Plaza, Los Angeles, CA 90095-1547, USA 1111institutetext: Joint ALMA Observatory (JAO), Alonso de Córdova 3107, Vitacura, Santiago, Chile 1212institutetext: National Astronomical Observatory of Japan (NAOJ), 2-21-1 Osawa, Mitaka, 181-8588, Tokyo, Japan 1313institutetext: Department of Astronomical Science, The Graduate University for Advanced Studies (SOKENDAI), 2-21-1 Osawa, Mitaka, 181-8588, Tokyo, Japan 1414institutetext: The Solar-Terrestrial Environment Laboratory, Nagoya University, Furo-cho, Chikusa-ku, Nagoya, Aichi 464-8601, Japan 1515institutetext: Department of Physics, Ehime University, 2-5 Bunkyo-cho, Matsuyama, Ehime 790-8577, Japan 1616institutetext: Stockholm Observatory, Department of Astronomy, Stockholm University, AlbaNova Centre, 106 91 Stockholm, Sweden 1717institutetext: Oskar Klein Centre for Cosmoparticle Physics, Stockholm University, 106 91 Stockholm, Sweden 1818institutetext: Institute of Astronomy, National Central University, No. 300, Jhongda Road, Jhongli City, Taoyuan County 32001, Taiwan 1919institutetext: Subaru Telescope, National Astronomical Observatory of Japan, 650 North A’ohoku Place, Hilo, HI 96720, USA 2020institutetext: Division of Physics, Faculty of Pure and Applied Science, University of Tsukuba, Tsukuba, Ibaraki 305-8571, Japan 2121institutetext: Max Planck Institute for Astronomy, Königstuhl 17, Heidelberg 69117, Germany 2222institutetext: National Radio Astronomy Observatory, 520 Edgemont Road, Charlottesville, VA 22903, USA
Multi-molecule ALMA observations towards the Seyfert 1 galaxy NGC 1097
Abstract
Context. The nearby Sy 1 galaxy NGC 1097 represents an ideal laboratory to explore the molecular chemistry in the presence and surroundings of an active galactic nucleus (AGN).
Aims. Exploring the distribution of different molecular species allows us to understand the physical processes affecting the ISM both in the AGN vicinity as well as in the outer star forming molecular ring.
Methods. We carried out 3 mm ALMA observations which include seven different molecular species, namely HCN, HCO+, CCH, CS, HNCO, SiO, HC3N, and SO as well as the 13C isotopologues of the first two. Spectra were extracted from selected positions and all species were imaged over the central 2 kpc () of the galaxy at a resolution of ().
Results. HCO+ and CS appear to be slightly enhanced in the star forming ring. CCH, showing the largest variations across NGC 1097, is suggested to be a good tracer of both obscured and early stage star formation. HNCO, SiO and HC3N are significantly enhanced in the inner circumnuclear disk (CND) surrounding the AGN.
Conclusions. Differences in the molecular abundances are observed between the star forming ring and the inner circumnuclear disk. We conclude that the HCN/HCO+ and HCN/CS differences observed between AGN dominated and starburst (SB) galaxies are not due to a HCN enhancement due to X-rays, but rather this enhancement is produced by shocked material at distances of pc from the AGN. Additionally we claim the lower HCN/CS to be a combination of a small under-abundance of CS in AGNs together with excitation effects, where a high dense gas component () may be more prominent in SB galaxies. However the most promising are the differences found among the dense gas tracers which, at our modest spatial resolution, seem to outline the physical structure of the molecular disk around the AGN. In this picture, HNCO probes the well shielded gas in the disk, surrounding the dense material moderately exposed to X-ray radiation traced by HC3N. Finally SiO might be the innermost molecule in the disk structure.
Key Words.:
galaxies: individual: NGC 1097 - astrochemistry - ISM: abundances - ISM: molecules - galaxies: ISM1 Introduction
The molecular material in galaxies is a fundamental ingredient in the fueling of the energetic phenomena in galactic nuclei. Though the mass and distribution of the molecular gas can be probed by the bright lines of carbon monoxide, deep observations of fainter molecular species have been proven as excellent tools of the physical processes affecting the molecular gas. This has been evidenced by numerous deep spectral line surveys during the last decade (see review by Martín 2011) as well as extensive work on the theoretical modeling (i.e. Meijerink et al. 2007; Bayet et al. 2008, 2011; Loenen et al. 2008; Meijerink et al. 2013; Harada et al. 2010, 2013). The molecular chemistry in the ISM provides direct information on the environmental conditions and therefore on the type of activity in the central few hundred parsecs of galaxies. Moreover, the observation of individual molecular species allow us not only to estimate the physical conditions, but to dissect the ISM into the different heating mechanisms in play as observed within the central molecular zone of our own Galaxy (Amo-Baladrón et al. 2011; Jones et al. 2012; Martín et al. 2012)
Most of the deep and/or unbiased chemical studies in galaxies have been carried out at very low resolution (i.e. pc, Wang et al. 2004; Martín et al. 2006, 2011; Aladro et al. 2011a, 2013; Davis et al. 2013; Watanabe et al. 2014) but for absorption studies towards bright continuum high-z sources where, though extremely prolific in molecular detection, no spatial information can be obtained (Muller et al. 2011, 2014). High resolution studies towards extragalactic sources have mostly focused towards the brightest nearby galaxies as well as the brightest species after carbon monoxide, that is HCN and HCO+ (i.e. NGC 253 at resolution, Knudsen et al. (2007); M51 at , Schinnerer et al. (2010); NGC 1068 at , Krips et al. (2011); NGC 1097 at , Hsieh et al. (2012); or a sample of LIRGs at , Imanishi et al. (2007, 2009)). Imaging line surveys through interferometric observations pushed our view of the ISM even further and has shown how the chemistry can provide unique insights on the variations of the physical processes across the central kpc of starburst galaxies (Meier & Turner 2005, 2012). However, such studies towards AGN galaxies have been more limited due mostly to the lack of sensitivity (i.e. García-Burillo et al. 2010).
The full potential of extragalactic chemistry is just emerging thanks to new generation instruments like ALMA and the upcoming NOEMA. In fact, within the last year and while still in the early science phase, ALMA is already providing extremely high quality data on the chemistry of some of the brightest nearby prototypical galaxies, both AGNs (NGC 1068, García-Burillo et al. (2014); Takano et al. (2014); Viti et al. (2014); NGC 1097, Izumi et al. (2013)) and SBs (NGC 253, Meier et. al submitted). The unprecedented capabilities of these instruments allow us to extend molecular studies to either further or fainter objects, thus increasing the significance of chemical comparative studies, now limited to a very reduced number of sources (Aladro et al submitted).
The prototypical nucleus in NGC 1097 hosts the first reported low-luminosity ( Terashima et al. 2002; Nemmen et al. 2006) Seyfert 1 nucleus (Storchi-Bergmann et al. 1993). The nuclear region is surrounded by a pc radius ring (Barth et al. 1995; Quillen et al. 1995) with ongoing star formation at a rate of (Hummel et al. 1987). The molecular material in NGC 1097 has been extensively studied at high resolution (Kohno et al. 2003; Hsieh et al. 2008, 2011, 2012). Molecular gas is distributed in a central concentration of pc that we will refer to as the circumnuclear disk, directly surrounding the AGN, and the weaker 1.4 kpc diameter molecular ring , the circumnuclear star forming (SF) ring (Hsieh et al. 2008).
Though located at a similar distance (14.5 Mpc, Tully 1988) than the Seyfert 2 galaxy NGC 1068, the nucleus of NGC 1097 does not only show a fainter X-ray luminosity, but it is also one order of magnitude fainter both in IR luminosity (Sanders et al. 2003) and dense gas as traced by HCN (Hsieh et al. 2012; Krips et al. 2011). The unprecedented sensitivity of ALMA allows us to carry out multi-molecule imaging studies on NGC 1097 which can be directly compared to similar studies towards the much brighter NGC 1068 (Takano et al. 2014).
In our first paper, ALMA observations of HCN and HCO+ at both and were reported by Izumi et al. (2013). In this paper we present a multi-molecule imaging study that makes use of the species that were simultaneously observed with the of HCN and HCO+. A companion paper will present the continuum emission in the 3mm band as well as a kinematic study of the ratios of the brightest species, while here we will only discuss the overall integrated molecular emission. Our aim is to provide insights on the variations of the molecular abundances in the pc region surrounding its Seyfert 1 nucleus, as compared to the star forming dominated circumnuclear ring at a distance of pc from the center.
2 Observations
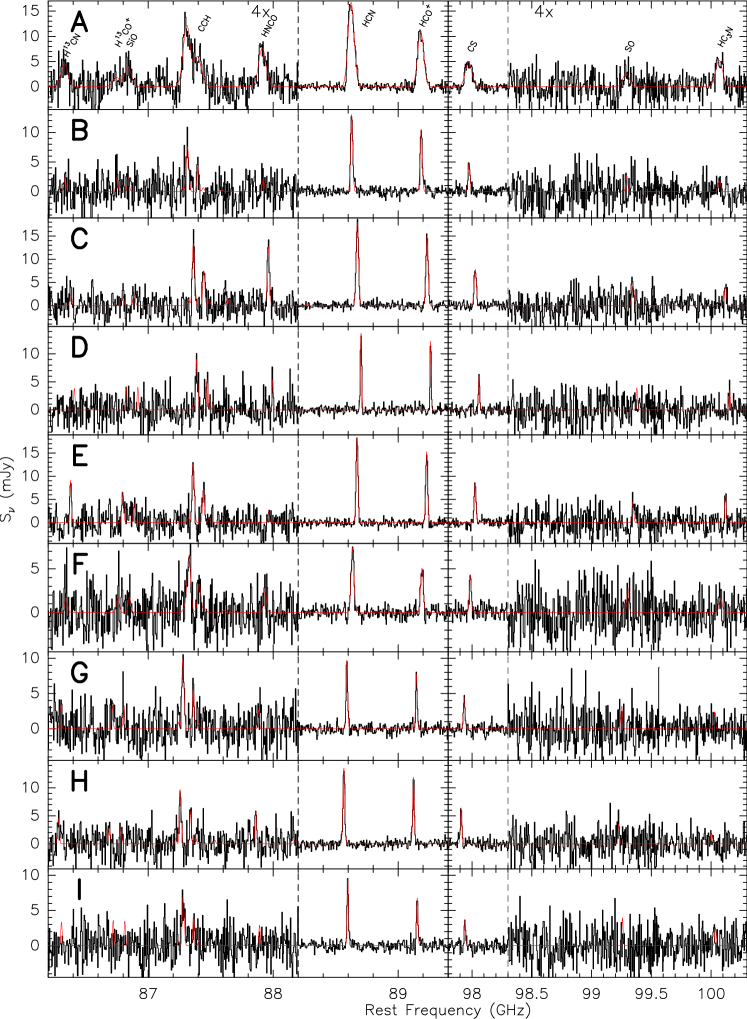
3 mm wavelength observations towards NGC 1097 were carried out as part of the ALMA Cycle 0 early science program 2011.0.00108.S (P.I. K. Kohno). Data were acquired during 2012 July 29th and October 19th with an overall on source integration time of min. The dual sideband (2SB) Band 3 receivers were tuned at an LO1 frequency of 93.187 GHz. The correlator was configured in dual polarization frequency division mode (FDM) with the GHz spectral windows covering the rest frequency ranges GHz and GHz (Fig. 1). The original frequency resolution of kHz was degraded by 10 channels down to a velocity resolution of across the covered frequency range.
The phase center of the observations was , . The HPBW of the primary beam of the 12 m antennas is at the extremes of the frequency coverage. At the distance of 14.5 Mpc, the angular to linear scale is , therefore our observations covered the central kpc at half power. The 24 and 31 antennas used on the first and second run, respectively, were configured up to distances of m from the array center, thus covering uv ranges from 4.3 to 132 ( m). This configuration resulted on an average synthesized beam of () with .
The quasars J1924-292 and J0334-401 were used as bandpass and phase calibrator, respectively. Absolute flux scaled was calibrated through observations towards Neptune. Data were calibrated and cleaned with CASA (McMullin et al. 2007), while images were produced with GILDAS 111http://www.iram.fr/IRAMFR/GILDAS. A final rms of mJy in the smoothed 4.88 MHz channels (i.e. 10 original channels) was measured in the final images.

3 Results
As shown by the spectrum in Fig. 1, extracted from the peak of molecular emission position (see below), the GHz frequency coverage of our observations allowed the detection of 9 molecular species. For the identified features, Table 1 presents some basic spectral parameters extracted from JPL spectral line catalog (Pickett et al. 1998). Two non-detected transitions of HNCO (shown in brackets) are included as their limits will serve to set constraints to the excitation conditions (see Section 3.2).
| Molecule | Transition | Frequency | |
|---|---|---|---|
| GHz | (K) | ||
| 86.340 a𝑎aa𝑎aLine multiplicity is taken into account during the spectral fit based on JPL catalog entries. We refer to the frequency of the brightest component. | 4 | ||
| 86.754 | 4 | ||
| SiO | 86.846 | 6 | |
| CCH | 87.316 a𝑎aa𝑎aLine multiplicity is taken into account during the spectral fit based on JPL catalog entries. We refer to the frequency of the brightest component. | 4 | |
| (HNCO) | 87.597 | 54 | |
| HNCO | 87.925 a𝑎aa𝑎aLine multiplicity is taken into account during the spectral fit based on JPL catalog entries. We refer to the frequency of the brightest component. | 10 | |
| (HNCO) | 88.239 | 54 | |
| HCN | 88.631 a𝑎aa𝑎aLine multiplicity is taken into account during the spectral fit based on JPL catalog entries. We refer to the frequency of the brightest component. | 4 | |
| 89.188 | 4 | ||
| CS | 97.980 | 7 | |
| SO | 99.300 | 9 | |
| HC3N | 100.076 | 29 |
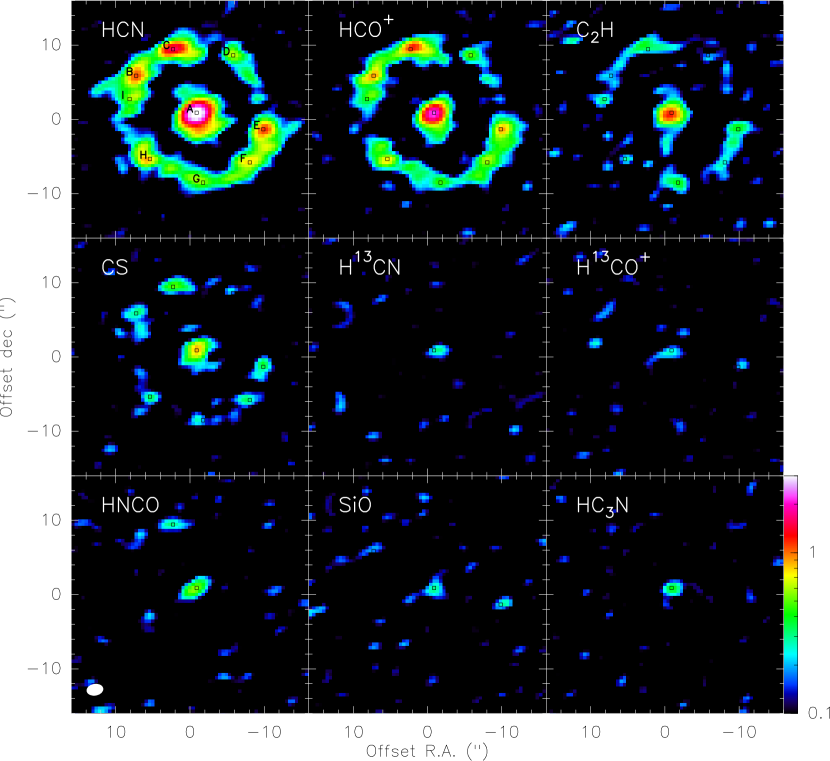
Fig. 2 presents the moment 0 maps of each of the detected species except for SO which does not stand out in the integrated maps (see discussion in Sect. 3.2). Moment 0 maps were integrated in the velocity range [] , where the molecular emission across the whole map is detected. This range was used for all species but CCH, for which the velocity range [] (referred to the brightest hyperfine component) was integrated in order to include the two groups of hyperfine transitions. The common logarithmic color scale in Fig. 2 allows a direct comparison of the emission of the different molecular species.
3.1 Selected positions in AGN and SF ring
To study the molecular abundance variations both in the circumnuclear disk around the AGN and the star forming ring, we have selected a sample of 9 positions. Table 2 lists the relative coordinates of the selected positions referred to the phase center of the observations.
Position A is selected as the brightest HCN emission position in the nuclear region of the NGC 1097 and it is offset from the phase center by , measured at the center of the peak flux pixel in the image (with /pixel). This position matches the measured position of the nucleus at 6 cm (,; Hummel et al. 1987) as well as the continuum peak (Izumi et al. 2013). The spectra extracted at this position is shown in Fig. 1.
All other positions correspond to peaks of molecular emission of the brightest species, with the selection mainly driven by the maps of the brightest species, namely HCN, C2H and CS. Fig. 3 presents the individual spectra extracted from all selected positions, both in the AGN and in the SF ring.
| Pos. | ||||
|---|---|---|---|---|
| (′′) | (′′) | (km s-1) | (km s-1) | |
| A | -0.9 | 0.9 | 1290 (2) | 190 (5) |
| B | 7.2 | 5.9 | 1276 (2) | 65 (4) |
| C | 2.3 | 9.4 | 1222.2 (1.5) | 74.5 (1.5) |
| D | -5.8 | 8.6 | 1023.1 (1.0) | 39 (2) |
| E | -9.9 | -1.3 | 1131.1 (0.6) | 57.6 (1.4) |
| F | -8.1 | -5.8 | 1252 (3) | 91 (6) |
| G | -1.8 | -8.5 | 1405.2 (1.2) | 49 (3) |
| H | 5.4 | -5.3 | 1485.9 (0.8) | 56 (2) |
| I | 8.1 | 2.7 | 1380.3 (1.2) | 43 (3) |
3.2 Excitation and column density determination
Rather than basing our result on direct integrated intensity line ratios, we have estimated the column densities of each of the molecular species to have a more accurate determination of the molecular abundances in each position.
We have used the spectral line modeling tools within the MADCUBA_IJ package444http://cab.inta-csic.es/madcuba/Portada.html (Martín et al in prep.) to fit the molecular emission in the spectra of the selected sample positions. The main assumption of this modeling is the emission under LTE conditions. The parameters of column density, velocity and linewidth are left as free parameters. Table 2 presents the average velocity and linewidth measured in all species. See Hsieh et al. (2011) for a discussion on the kinematics and the different linewidths measured in the star forming ring cloud complexes. However, excitation temperature and the source size parameters were fixed to K and , respectively. These assumptions are explained in the following.
The gas in both the SF ring and around the AGN have kinetic temperatures higher than our assumed excitation temperature (; Piñol-Ferrer et al. 2011). This is due to the fact that the molecular gas is subthermally excited. For HCN and HCO+, Izumi et al. (2013) combined the and transitions, observed with ALMA, smoothed down to the resolution of the transition, observed with the SMA (Hsieh et al. 2012), in order to estimate the excitation conditions of the gas traced by these species. The emission can be roughly fitted in LTE by a rotational temperature of K. This result is similar in the central position A around the AGN and towards the SF ring. Though the assumption on the excitation temperature will not strongly affect the relative abundances given that most of our observed transitions have similarly low ( K) energies, it might be an issue for the transition of HC3N with a significantly higher upper energy level (Table 1). However, the work by Aladro et al. (2011b) towards nearby starbursts shows that such subthermal excitation affects equally to other molecular species in their lower transitions, not only to those at lower energies but up to transitions with K upper energy levels. Additionally the non detection of the two higher energy transitions of HNCO listed in Table 1 and shown in Fig. 1 set a limit on the excitation temperature of this species to K.
Regarding the source size we assume the emission to be distributed in a region approximately equal to the synthesized beam in solid angle, that is or pc. A smaller emitting region would directly scale up the column density, thus increasing the effect of opacity. Our fit to the spectra results in an opacity of in the brightest positions (A and B) for HCN. Assuming a source size of half our assumed value would increase the opacities up to and the derived column densities by a factor of . Izumi et al. (2013) also found low opacities in the high-J transitions of HCN in the center of NGC 1097. Based on the peak line ratio of HCN and H13CN of and assuming a 12C/13C isotopic ratio of (Henkel et al. 2014) we can estimate an opacity of towards the central position. It could be even larger for a higher carbon isotopic ratio (Martín et al. 2010). This shows that in the central position, the HCN emission either stems from regions significantly smaller than the beam, or the carbon isotopic ratio is significantly smaller in this region. We cannot disentangle these two possibilities with our data. Though this uncertainty on the source size may have a moderate impact in the relative abundances of the brightest species, we have no further clues on the actual molecular clump source sizes across the galaxy so we assume a similar source size for all positions as a first approximation.
The derived column densities and upper limits are listed in Table 3 for all selected positions and detected species. We note that both H13CO+ and SO detections are at the edge of detection. SO does not even show up in the integrated maps (Sect. 3), while the moment 0 detection of H13CO+ might be the result of SiO contamination. Derived column densities for these two species are in the few positions where those are detected, and it results in an overabundance of H13CO+ in position E of a factor of which may indicate the fit to be dominated by an spurious spectral artifact (see fit in Fig 3). Thus these species will not be included in the following discussion.
| Pos. | ||||||||||
|---|---|---|---|---|---|---|---|---|---|---|
| A | 3.14 (0.07) | 1.16 (0.03) | 14.4 (0.8) | 1.85 (0.11) | 0.26 (0.05) | 0.06 (0.02) | 3.1 (0.3) | 0.25 (0.05) | 2.6 (0.3) | 0.6 (0.2) |
| B | 0.84 (0.04) | 0.38 (0.02) | 3.3 (0.5) | 0.56 (0.05) | 0.04 | 0.02 | 0.2 | 0.04 | 0.3 | 0.2 |
| C | 1.34 (0.02) | 0.60 (0.02) | 5.7 (0.6) | 1.02 (0.06) | 0.04 | 0.02 | 1.58 (0.17) | 0.04 | 0.58 (0.15) | 0.4 (0.1) |
| D | 0.54 (0.03) | 0.24 (0.01) | 2.9 (0.4) | 0.42 (0.03) | 0.04 | 0.02 | 0.38 (0.09) | 0.04 | 0.34 (0.11) | 0.2 |
| E | 1.08 (0.02) | 0.51 (0.02) | 5.2 (0.5) | 0.88 (0.04) | 0.12 (0.02) | 0.08 (0.02) | 0.2 | 0.07 (0.02) | 0.62 (0.14) | 0.3 (0.1) |
| F | 0.64 (0.04) | 0.24 (0.02) | 4.0 (0.6) | 0.48 (0.04) | 0.04 | 0.02 | 0.4 (0.2) | 0.04 | 0.37 (0.19) | 0.2 |
| G | 0.47 (0.02) | 0.20 (0.02) | 3.7 (0.4) | 0.43 (0.03) | 0.04 | 0.02 | 0.2 | 0.04 | 0.3 | 0.2 |
| H | 0.76 (0.02) | 0.34 (0.02) | 3.4 (0.4) | 0.56 (0.06) | 0.06 (0.02) | 0.02 | 0.54 (0.14) | 0.04 | 0.3 | 0.2 |
| I | 0.40 (0.02) | 0.18 (0.02) | 2.4 (0.4) | 0.28 (0.05) | 0.04 | 0.02 | 0.2 | 0.04 | 0.3 | 0.2 |
3.3 Relative molecular abundances
We aim to understand the chemical differentiation between the molecular gas in the SF ring and the material in the close vicinity of the nuclear engine. The central few hundred parsecs CND contains a significant fraction of the dense molecular gas in NGC 1097 (Table 3). Based on the integrated intensity maps of HCN and HCO+ in Fig. 2 the central 600 pc region encloses and of the total detected emission, respectively. This fraction is as much as for CS or CCH.However, we are mostly interested in the relative abundances between the different molecular species so to determine whether an AGN driven chemistry can be claimed in the central region.
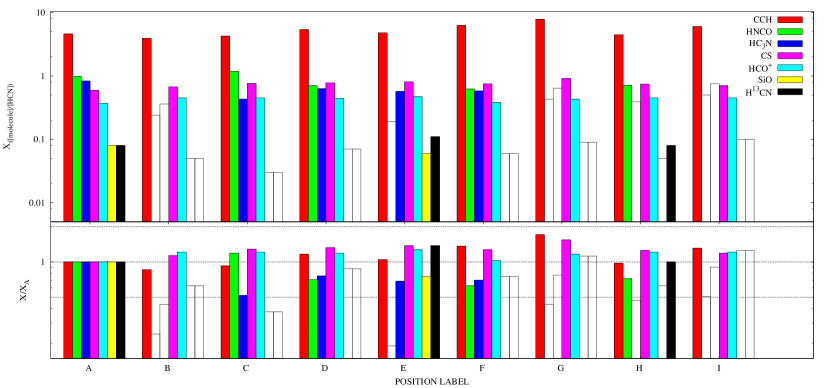
We have used the brightest species in our observations, namely HCN, as a reference column density baseline. Fig. 4 shows the abundances of each species relative to HCN. Molecules are displayed in decreasing order of abundance as measured in position A. To better evaluate the differences between position A and those in the SF ring, we have normalized the relative abundances to those in position A (lower panel in Fig. 4).
The selection of a good “baseline” species for normalization is important but not critical in our study. As noted by Kohno et al. (2003), HCN is observed to be significantly enhanced towards the nucleus relative to CO which might point out HCN as a not the ideal candidate to become a reference molecule. However, this HCN/CO trend gets less evident when higher J transitions of CO are considered (Hsieh et al. 2012).
We see in Fig. 4 that CS is consistently slightly more abundant in the star forming ring positions. This could be caused by the normalization by HCN, implying an slight overabundance of HCN in the nuclear region as previously claimed as an AGN chemical imprint. Therefore, another possibility among the brightest species would have been the use of CS, as done in previous works (Martín et al. 2009a, 2011; Aladro et al. 2011a, 2013). However, we note that reproducing Fig. 4 with the abundances relative to CS results in an overall underabundances of all species detected in the SF ring compared to position A. Given that, a priori, we have no reasons to assume all species to be overabundant in the CND, we stick to our use of HCN as it does provide abundances less biased towards the AGN position. However, this uncertainty in the reference species is taken into account in the following discussion.
Though we will deal with relative abundance among species, for completeness we used the molecular hydrogen column densities derived from CO observations by Hsieh et al. (2011) to estimate the fractional abundances relative to H2. On average the estimated fractional abundances of HCN would be both in the nuclear region and throughout the SF ring. We consider this a limit given that they use the conversion factor which is known to be overestimating of the H2 column density in dense environments. Thus the relative abundance could be as high as .
4 SF ring versus AGN abundances
We find that the overall relative molecular abundances in the SF ring positions are in significantly good agreement with those in the nuclear region within less than a factor of 2. The only exception is the underabundance of HNCO in some SF ring positions. Though we do not find enormous differences in the abundances among the selected positions, some species appear to show a differentiation between their abundances in the surroundings of the AGN and the positions in the star forming dominated ring. In particular, HC3N and HNCO appear to be the species showing the largest enhancement in the nuclear region. In the following we further discuss the differences observed.
4.1 HCO+ and CS
The relative abundances of HCO+ and CS derived in the individual SF ring positions are found to be consistently, but still marginally regarding the excitation uncertainties, above those found towards the AGN position.
These two molecules are claimed to be enhanced by UV radiation in the surroundings of star forming regions. Though its abundance may be equally enhanced by X-ray irradiation, HCO+ is shown to be abundant in the presence of UV fields (Bayet et al. 2008, 2011) and therefore it could be associated to the massive star formation. Additionally, HCO+ is also observed to be enhanced in high velocity shocked material as observed in Galactic supernovae remnants (Dickinson et al. 1980; Wootten 1981) which, again would link its enhancement to massive star formation. High abundances of CS may be understood through the enhancement of its precursor S+ in the gas phase(Drdla et al. 1989; Goicoechea et al. 2006), though there is some disagreement between theoretical models and observations (Martín et al. 2008; Tideswell et al. 2010).
Both HCO+ and CS follow closely the emission of HCN, and therefore they may be just probing the same dense gas. We do not observe a clear morphological differentiation with respect to HCN at our achieved resolution in the SF ring so as to attribute their emission to the star formation in the region. However, the significant star formation in the ring could explain their overall significantly enhanced emission with respect to the central region. We observe an HCN/HCO+ ratio which is higher, both in the AGN and the SF ring, than what is measured in other starburst galaxies (Krips et al. 2008). Rather than a general enhancement of HCN in this NGC 1097 due to the presence of the AGN, it is likely that in starbursting galaxies HCO+ is further enhanced due to the star formation event. In such SF dominated environments, ionization due to cosmic rays accelerated in supernovae remnants (Ackermann et al. 2013) would also contribute to pull HCN/HCO+ down (Wootten 1981) compared to what is observe even in the moderately SF ring on NGC 1097, or similarly in NGC 1068. This scenario may as well explain why this ratio is moderately lower in the SF ring than in the very nuclear region, while the highest HCN/HCO+ ratio would be a local effect in the central region as discussed in the following.
4.1.1 AGN Irradiation?: HCN/HCO+ ratio
For more than a decade now, it has been claimed that the X-ray irradiation in AGN dominated galaxies results in an enhancement of the HCN molecule relative to the overall molecular gas traced by CO or that affected by star formation traced by HCO+ (Kohno et al. 2001; Krips et al. 2008). In terms of relative abundances, we find that the in the central position is only marginally larger than the values in the SF ring which range .
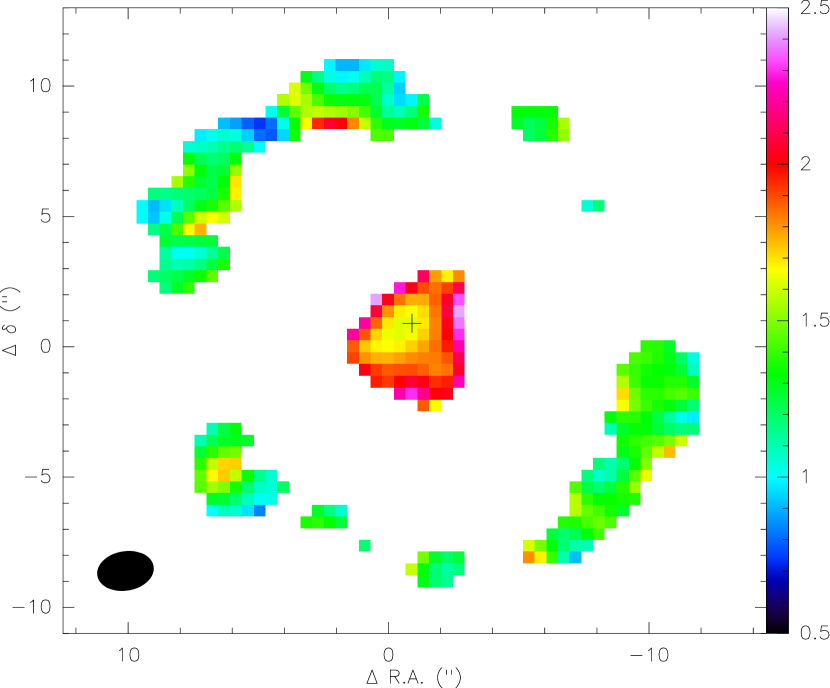
The high sensitivity of the ALMA data allows us to study the distribution of this ratio across the imaged region. In Fig. 5 we show HCN/HCO+ integrated line intensity ratio, following discussions in the literature. To make the most out of the high quality of the data and to avoid noise effects, we have only included points above a level in the individual images.
Regarding its comparison with the outer SF ring, a clear HCN/HCO+ integrated intensity ratio enhancement is observed in the central 300 pc region of NGC 1097, as expected in an AGN dominated environment. However, this enhancement does not reach the maximum at the central position, as discussed in Sect. 5.1. It is interesting to note that the HCN/HCO+ measured is consistently high () all over the galaxy. That is, setting these values in the proposed diagnostic diagrams based on the HCN/HCO+ ratio (Krips et al. 2008), all the molecular gas in NGC 1097 would appear in the AGN dominated regime. The difference between the HCN/HCO+ in the nucleus as compared to the SF ring is less pronounced than in NGC 1068 where the ratio drops to in the ring (Viti et al. 2014). However, they only detected these species in a handful of compact positions on the SF ring, and a significant fraction of the gas in the image might be resolved out.
Extensive literature can be found where HCN is claimed to be enhanced by the effect of X-ray irradiation (see Graciá-Carpio et al. 2006; Krips et al. 2008, and references therein). A clear correlation is found between the CO-normalized X-ray flux in the keV band and HCN emission (García-Burillo et al. 2014), which is, however, also found for HCO+, SiO and CN (García-Burillo et al. 2010). Possibilities for the HCN enhancement such as oxygen depletion are discarded based on ancillary molecular line ratios not matching the predictions (Usero et al. 2004). The enhancement due to the presence of massive star forming regions explored by Graciá-Carpio et al. (2006) for LIRGs was discarded towards NGC 1097 in view of the low star forming rate in its nuclear region (Izumi et al. 2013). However, even the X-ray enhancement appears to be out of the question (Izumi et al. 2013) given that most models assume AGN luminosities of (Meijerink & Spaans 2005; Meijerink et al. 2007, 2013), which is more than two orders of magnitude higher than the values measured in NGC 1097 or NGC 1068. Nevertheless, intrinsic X-ray fluxes may be significantly higher. Such is the case of NGC 1068 where its nucleus is absorbed by H2 column density (Matt et al. 1997) and its intrinsic luminosity is estimated to be a orders of magnitud larger than observed (Iwasawa et al. 1997; Colbert et al. 2002). However, in the case of NGC 1097, the absence of Fe K emission lines in its X-ray spectra completely rules out the possibility of the presence of a heavily absorbed AGN revealing an intrinsically low-luminosity AGN. In such case it is not expected that the sphere of AGN influence goes beyond a few tens of parsecs in these sources. Fig. 5 shows the central region of HCN/HCO+ enhancement to be extended well beyond one synthesized beam (see Section 5.1). Based on the modelling by Harada et al. (2010), Izumi et al. (2013) therefore proposed high-temperature chemistry as the key to enhance HCN and therefore obtain an increase in the HCN/HCO+ ratio in the nucleus of NGC 1097. LVG analysis by Hsieh et al. (2008) based on interferometric CO and shows the presence of such high temperature gas ( K) in the nuclear region. Similarly, the LVG analysis of a sample of AGN sources with enhanced HCN emission resulted in kinetic temperatures K (Krips et al. 2008) at single dish resolution. High resolution multi-transition observations towards NGC 1068 show clumps in the CND with temperatures above 100 K (Krips et al. 2011; Viti et al. 2014). Regarding the origin of such heating, mechanical heating is suggested to explain the required high temperature in NGC 1097 (Loenen et al. 2008; Izumi et al. 2013).
A more detailed exploration of the variation of this ratio as the gas approaches the central engine is found in Section 5.
4.1.2 The HCN/CS diagnostic
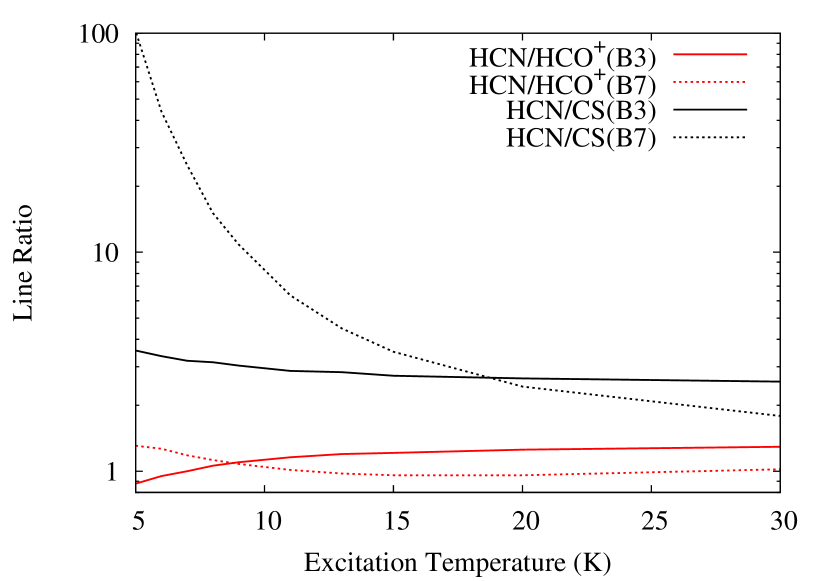
Recently, Izumi et al. (2013) proposed an AGN vs SB diagnostic diagram based on the HCN()/CS() ratio. Towards NGC 1097, where the CS line was not detected down to a level of mJy, this ratio was reported to be a factor of larger than in starburst galaxies. This difference in the line ratio in AGN versus SB galaxies has also been reported at the lower- transitions with single dish observations towards NGC 1068 compared to those in NGC 253 and M 82 (Nakajima et al. 2011; Aladro et al. 2013). Based on our 5 mJy beam-1 detection of CS and assuming the LTE at K, the CS line would have a peak flux density of mJy beam-1. The fact of measuring a significantly different HCN/CS ratio between the high- () and the low- transitions () is the result of the difference between the upper energy levels of the transitions involved in the ratios. While the HCN and CS ALMA band 3 transitions have similar upper energy levels (Table. 1), there is a significant difference between that of HCN (42 K) and CS (65 K). Such difference makes the HCN()/CS() ratio very sensitive to variations in the excitation temperature defining the energy levels populations. This is illustrated in Fig. 6 where we calculated the HCN/HCO+ and HCN/CS line ratios for the transitions observable in the ALMA band 3 and 7 bands. While HCN/HCO+ ratios are basically insensitive to excitation conditions (as long as both species share the same excitation), similar to the low- HCN/CS ratio, the high- HCN/CS ratio shows a strong variation as a function of the excitation temperature. Thus the ratio among the high- HCN/CS is a less reliable probe to the abundance variations if the excitation conditions are not well constraint.
Rather than rejecting the diagnostic proposed by Izumi et al. (2013) based on this ratio, our result aims at understanding the origin of the large ratio difference observed between AGN and SB galaxies. Though a small abundance difference of up to a factor of 2 may be claimed as is suggested by the observed difference in the low- transition ratio (Aladro et al. 2013), the larger difference observed in the high- ratio is likely due to the excitation of CS. In starburst galaxies, the high- transitions of CS appear to be associated to a moderately higher excitation temperature gas component ( K, Aladro et al. 2011b). This component appears to correspond to a dense molecular component (). From the results in NGC 1097, we can suggest that this dense molecular component may be less prominent in AGNs, or CS might be not so efficiently produced there. However a more complete high resolution study of the excitation of the gas in NGC 1097 and NGC 1068 should help understanding the origin of this underabundance and/or underexcitation.
4.2 Star formation: CCH
CCH is observed to vary significantly throughout the SF ring, with measured relative abundances below (position B), up to a above (position G) those in the center. The distribution of the emission and abundances of CCH differs significantly from other species in NGC 1097.
Within the Galaxy this species is observed to be located in the UV irradiated cloud edges associated with massive star forming regions (Beuther et al. 2008; Walsh et al. 2010; Li et al. 2012). Its formation paths are favored in photodissociation regions (PDRs) by the reaction of C+ with small hydrocarbons and additionally through photodissociation of C2H2 (Meier & Turner 2005, and references therein). However UV radiation is also its main destruction path, and therefore CCH abundance is dependent on the evolutionary stage of the star forming event (Li et al. 2012). In external galaxies the abundance of CCH appears not to be affected by the type of activity (Nakajima et al. 2011; Aladro et al. 2013). However, observations towards an extended sample of galaxies shown that CCH in AGNs may be similartly overabundant to starburst in the late stages of evoluton while being different to earlier stage starbursts (Aladro et al. submitted). Overall, when the average galactic emission is observed in a sample of galaxies, a good correlation between CCH and HCO+ is found (Martín et al. 2014). However, we do not find such correlation at GMC complex scale in our data. At high resolution, observations towards starburst galaxies (Meier & Turner 2005, 2012, Meier et al. submitted) have shown CCH to be tracing UV irradiated clouds in the vicinity of both nuclear stars clusters and embedded star forming regions, showing large abundance variations across these galaxies. Similarly, we observe large relative abundances variations both in the nucleus and the SF ring in NGC 1097. Such variations might explain the observed homogeneity between different activity types where, when averaged over the whole few hundred parsecs of a galaxy, the local variations are smoothed out.
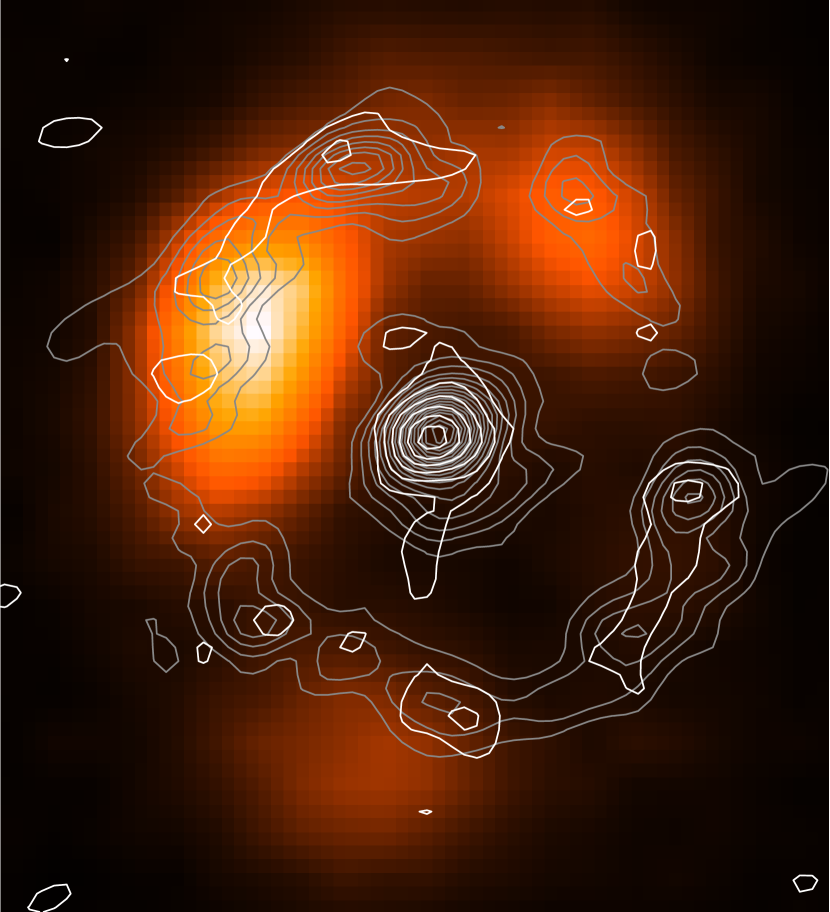
Fig. 7 shows a comparison between the FUV emission from unobscured massive star formation in the SF ring of NGC 1097 (Gil de Paz et al. 2007) with our observed HCN and CCH emission. The north-eastern region, where the brighter FUV emission is observed, does not correspond to the higher relative abundance of CCH. There (positions B and C), we find a large fraction of dense well UV-shielded gas, therefore decreasing the CCH relative abundance with respect to HCN, even though its absolute column density is as high as at other positions of the ring. Additionally the bright FUV from stars already formed would photodissociate CCH. On the other hand, the position I, also highly illuminated in the north-east, has significantly less dense molecular gas, but one of the highest CCH relative abundances showing that both evolved (strong observed UV) and ongoing stage star forming (enhanced CCH) regions co-exist in this region. That is similar to what is observed in position G towards the south. There, though the observed FUV is not so intense, likely due to extinction, it is enough to photo-enhance the abundance of CCH in a more diffuse medium, resulting in the highest CCH relative abundance measured. This scenario is similar to that proposed to explain the high CCH abundance in the isolated galaxy CIG 638 (Martín et al. 2014). Finally, towards the south-west (positions E, and F), we find a region where marginal FUV is observed, again possibly due to obscuration in this gas-rich environment. If CCH is indeed mostly enhanced in PDRs associated with massive star forming hot cores, this would be indicative of obscured star formation in this region, which is consistent with the m emission observed in these positions, also claimed to be tracing dust massive star forming regions (Izumi et al. 2013).
Though CCH can be a potential tracer of obscured star formation, its abundance variations can also be probing changes in the diffuseness of the ISM and therefore its permeability to the UV irradiation from massive stars. It is important to note that the critical density of CCH is about an order of magnitude below than that of species such as HCN so excitation effects might again play an important role in the relative abundance derived, particularly towards the densest cores.
4.3 The densest gas: SiO, HNCO and HC3N
These three species are the ones showing the clearest contrast between the central region and the SF ring with a significant enhancement towards the nuclear region. Towards NGC 1068, an enhancement of SiO and HC3N in the surroundings of the AGN was already been recently reported (García-Burillo et al. 2010; Takano et al. 2014).
SiO is only detected in one position outside the nuclear region, position E, and there it shows a relative abundance lower in this position. Similarly, HNCO shows an underabundance of in the SF ring with respect to the central position, but for position C, where HNCO shows an enhancement of 20. Moreover the limits towards the undetected positions indicate abundances below than that in the AGN vicinity. Both species are considered as tracers of shocked dense material where shocks release both SiO and HNCO from the dust grain surfaces (Martin-Pintado et al. 1997; Huettemeister et al. 1998; Zinchenko et al. 2000; Martín et al. 2008). The emission of both species is observed to be well correlated not only in Galactic sources, but it is also observed in nearby bright galaxies (Usero et al. 2006; Meier & Turner 2005). Surprisingly, in position E, where SiO has been detected in the SF ring, the lowest limit to the abundance of HNCO is found. This is likely linked to the different evolutionary stage of the embedded star forming cores where UV radiation or high-velocity shocks are destroying HNCO (Martín et al. 2008).
With a critical density of (Wernli et al. 2007), HC3N is tracing the densest regions within the GMC complexes in NGC 1097. Where detected, the measured relative abundances in the SF ring are of that in the central position. The upper limits in the other positions are still around below. In the case of HC3N an increase in the temperature of the gas towards the central region would enhance this difference. Our calculated ratio of HC3N/HCN=1.2 for (see Section 3.2) would increase by a factor of for excitation temperatures of K.
5 Molecular variations within the central 300 pc
Fig. 5 clearly suggests observable variations in the HCN/HCO+ line ratios within the CND even though the central region is only resolved over a few synthesized beams. Molecular variations in the central few hundred parsec CND around the AGN in NGC 1068 have been reported both at very high spatial resolution (35 pc, García-Burillo et al. 2014; Viti et al. 2014) for HCN an HCO+, and at a coarser spatial resolution of for a wider sample of species (Takano et al. 2014). Here we discuss the different morphologies of the observed species towards NGC 1097 and compare it to what is observed in NGC 1068.
5.1 The HCN/HCO+ gradient
Within the central 300 pc we observe that the HCN/HCO+ emission does not peak towards the AGN position. On the contrary, a positive gradient is observed as we get further from the central position (Fig. 8), reaching a relatively constant maximum value of . The ratio of at the central position is still significantly higher than the average measured in the SF ring (Sect. 4.1.1). The relatively low HCN/HCO+ ratio in the close vicinity of an AGN compared to its surrounding CND has also been reported towards NGC 1068 (García-Burillo et al. 2014). Their 35 pc spatial resolution result in an even more dramatic gradient from a similar value towards the center of up to a ratio of in some CND regions. As discussed above when comparing with the starburst ring, this gradient could be revealing the direct effect of the AGN imprinted in the molecular abundances on its immediate surroundings. However, it has been claimed that the variation of this ratio could be the result of a density gradient, or due to differences in the opacity of these species (Meier & Turner 2012, Meier et al. submitted).
Though HCN and HCO+ may be moderately optically thick (see Sect. 3.2), differential opacities are likely not to play a major role in the ratios observed where, for a similar column density, HCO+ has an opacity almost twice that of HCN due to the higher radiative efficiency of HCO+ as noted by Meier & Turner (2012). Given that both species show a similar excitation temperature (Izumi et al. 2013), a differential opacity effect might result in an increased HCN/HCO+ ratio, where HCO+ would reach saturation faster than HCN, if both species were similarly enhanced towards the central position, contrary to what is observed. On the other hand, the difference between their critical densities might suggest that HCO+ is mostly concentrated towards the nuclear region where the densities are moderate , with a higher density region ranging pc around the AGN. This scenario is equivalent to that discussed towards local starbursts (Meier & Turner 2012, Meier et al. submitted), though the actual density structure and morphology is likely to differ in both galaxy types.
The last scenario is a real relative abundance radial gradient from the AGN. However it could be either due to an enhancement of HCN production outwards from the nucleus or an inwards overproduction of HCO+. The overproduction of HCO+ due to enhanced star formation is discussed in Sect. 4.1.1 and 4.2. Massive star formation could be taking place in the central 100 pc, or cosmic ray acceleration in the AGN would enhance HCO+ but we have no evidence for any of these effects. Thus, we rather claim that this gradient may be understood as a result of the enhancement of HCN in the material surrounding the circumnuclear disk (see Sect. 5.2). Based on theoretical (Pineau des Forets et al. 1990) and Galactic observations (Tafalla et al. 2010), the enhancement of HCN in the outflow of Mrk 231 has been claimed to be the result of shock chemistry (Aalto et al. 2012) where HCN is efficiently formed via the reaction CN + H2. We note that the HCN/HCO+ enhancement is observed outside the CND defined by HNCO (Sect. 5.2) and that the largest enhancement is observed in the extended HCN emission component emission. Though HCO+ shows extended emission south of the central region, HCN appears to show an even wider component extending in the north-east and south-west directions (Fig. 2). However, we do not have other strong evidence of outflowing material in our images. On the contrary, the kinematic study of HCN by Fathi et al. (2013) shows evidences of inflowing gas.

5.2 The CND traced by HNCO
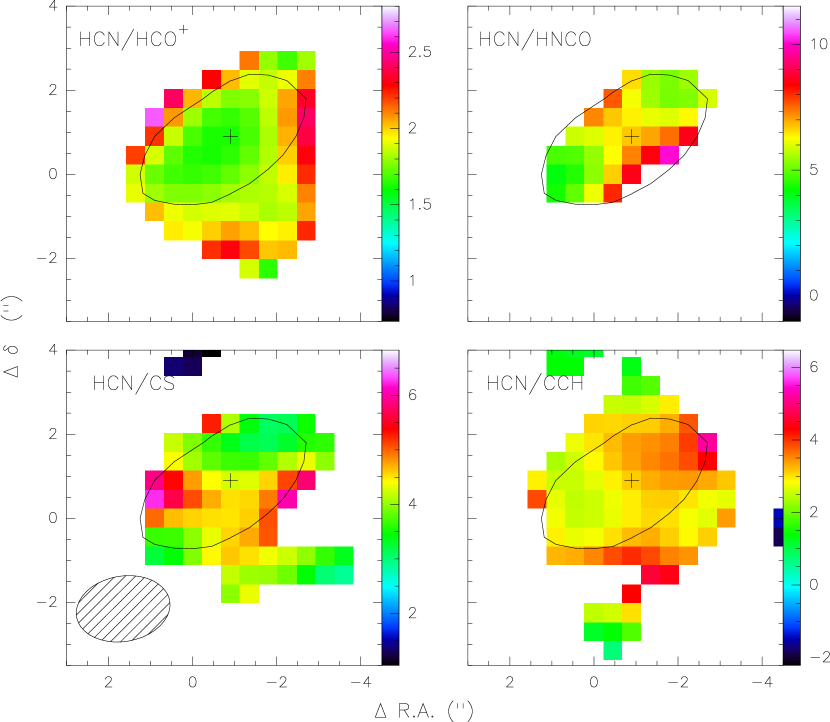
Even though HNCO may be one of the most fragile species in our sample, it shows an enhancement towards the central region (Sect. 4.3). This species is the only one clearly delineating a rotating circumnuclear disk around the AGN position as shown in Fig. 2. From the extreme emission peaks in the channel maps and taking into account the beam smearing, we measure a disk structure of pc length and P.A., covering a velocity range of 200 around the systemic velocity. The measured velocity gradient of is consistent with that measured towards the nuclear region by Hsieh et al. (2008). The orientation of the disk is marginally smaller than the kinematic P.A. of , and derived from CO (Hsieh et al. 2011) and HCN , respectively (Fathi et al. 2013). This might indicate a real variation between the overall rotation of the gas envelope traced by HCN and the inner disk traced by HNCO. The possibility of HNCO tracing a bipolar outflow rather than a disk structure is unsupported by its kinematics being closely following those of CO and HCN at larger scales. As observed in other species, the south-east region of the disk is about a factor of two brighter than the north-west one. However the slightly narrower line width at this position ( ) makes this difference not to be apparent in the integrated maps. This is an indication of a significant asymmetrical distribution of the molecular gas in the CND (also seen in CO , Hsieh et al. 2008), similar to what is observed at higher resolution in NGC 1068 (García-Burillo et al. 2014). Also in NGC 1068, though at slightly lower resolution, the emission of HNCO is observed distributed in two lobes at both sides of the AGN (Takano et al. 2014). Such double peak distribution is in agreement with the CND being observed from a more inclined direction consistent with its Seyfert 2 nucleus.
HNCO forms in the very inner regions of molecular cloud, shielded from external UV irradiation by large visual extinction as shown by chemical models ( mag, Martín et al. 2009b). This species is exclusively distributed along the circumnuclear rotating structure. Within the central 300 pc, HNCO is absent in the regions outside the rotation plane of the CND, unlike the brightest species HCN, HCO+, CCH and CS, which clearly show a wider extent. In this region, low velocity shocks in the ISM due to cloud to cloud collision similar to what is observed in our Galactic center as well as in external galaxies (Jones et al. 2012; Meier & Turner 2005) will provide the environmental conditions for its ejection into gas phase while being dense enough to protect it from dissociation. Though sensitivity could be claimed for such non detection, the HCN/HNCO ratio map in Fig. 9 shows already HNCO being exclusively concentrated in the disk, with the lower ratio towards the two CND lobes, and a clear bipolar decrease in the perpendicular direction to the plane. This fact points out to an increase of the radiation affecting the gas outside the CND. Given that star formation is not prominent in this region, UV generated in high-velocity shocks might play a significant role in the destruction of HNCO, which may also explain the enhancement of HCN with increasing distance from the nucleus (Sect. 5.1). Additionally, an ionization cone due to a putative jet or direct exposure to the X-ray emission from the AGN, could be claimed together to explain the absence of HNCO within the inner region ( pc) enclosed by the CND and the biconical shape of the HCN/HNCO ratio map.
5.3 HC3N and SiO in the close vicinity to the AGN
Both HC3N and SiO are observed to be concentrated within an unresolved region (i.e. pc) around the AGN. Such a high concentration of these molecules in the surroundings of an AGN has also been reported in NGC 1068 (García-Burillo et al. 2010; Takano et al. 2014).
Though HC3N shows some emission in the south-eastern position of the CND, the brightest in the CND, it is mostly concentrated in the central beam. Takano et al. (2014) reported that a of the HC3N emission stems from the CND in NGC 1068. Similar to what is observed in NGC 1097, HC3N is more concentrated around the AGN than molecules tracing the CND such as HNCO. Our observations together with those in NGC 1068 provide the evidence of the existence of a large amount of high density gas () shielded from the X-ray radiation from the AGN, as described by theoretical models from Harada et al. (2013). In those models, a high temperature region of the disk moderately affected by X-rays can explain an enhancement of the cyanopolyynes. In this scenario, HC3N might be tracing the inner CND directly enclosed by HNCO. Within scales almost two orders of magnitude smaller, the few central parsecs around the Galactic black hole show HC3N (and to a large extent SiO) to be tracing the very densest clumps in the circumnuclear disk material (Martín et al. 2012).
HC3N has been observed to be overluminous in the deeply buried IR luminous galaxy NGC 4418 (Aalto et al. 2007) which might be a signature of either buried star formation (Bayet et al. 2008) or contribution from gas in the vicinity of the AGN. HC3N enhancement has been confirmed in other obscured LIRGs (Costagliola et al. 2011). The observed HC3N/HCO+ integrated intensity ratio toward NGC 4418 is (Aalto et al. 2007; Costagliola et al. 2011). This is using the transition of HC3N, and therefore the ratio would be higher if using the in our work. The ratio we derive towards the nucleus of NGC 1097 is however , and therefore significantly lower than the value in NGC 4418. Similarly, for those LIRGs where HC3N was detected in the sample from Costagliola et al. (2011), a ratio ranging HC3N/HCN is found (again using the fainter HC3N transition). Towards NGC 1097 we observe a lower ratio of . Though we know that both species are not coexistent in NGC 1097, and thus a higher ratio of HC3N might be measured towards the central position, a similar non-coexistence applies in the obscured LIRGs observed with single-dish resolution. Therefore, based on our observations, an enhancement of HC3N in the CND around a putative AGN cannot be the only contribution to the observed HC3N enhancement in obscured LIRGs. This gives a further support to the idea of buried young star formation in this objects as a key ingredient driving their luminosities (Aalto et al. 2007; Costagliola et al. 2011). We note, however, that the line ratios HC3N/HCO and HC3N/HCN measured towards the close IR bright quasar, Mrk 231, are in quite good agreement to those measured in the center of NGC 1097, even though the strong star formation in Mrk 231 (Aalto et al. 2012, and references therein).
On the other hand, in the CND region SiO is exclusively detected towards the central beam. Though the signal to noise of our data is not high, the SiO/H13CO line ratio is consistent with the observations towards NGC 1068 (Usero et al. 2004). SiO is a tracer of shocks both in the Galaxy (Martin-Pintado et al. 1992, 1997; Huettemeister et al. 1998) and in external galaxies (García-Burillo et al. 2000; Usero et al. 2006). Towards NGC 1068, X-ray and cosmic ray chemistry has been claimed to explain the SiO abundance in its CND (García-Burillo et al. 2010; Aladro et al. 2013) based on the correlation between SiO emission and the Fe 6.4 keV line in the Galactic center (Martín-Pintado et al. 2000; Amo-Baladrón et al. 2009). However, the high abundance of the easily destroyed HC3N would not resist photodissociation in such environment. Still, the emission could be enhanced by the X-ray radiation in a region different to that where HC3N is formed (Harada et al. 2013), which might explain the enhanced abundance of both species. The signal-to-noise ratio of our SiO detection prevents us from reaching further conclusions, but to confirm the compact SiO emission in the surroundings of AGN, similar to what is observed in NGC 1068 (García-Burillo et al. 2010).
5.4 CS and CCH
As shown in Fig. 9, the behavior of these two species in the central few hundred parsecs appear to anticorrelate. Though the resolution is limited, based on previous studies and theoretical models we suggest that such differentiation is likely to be due to real abundance differences caused by environmental conditions.
CS is observed to be evenly distributed across the CND, with a relative abundance drop of almost a factor of two in the south-eastern CND region (observed peak of HCN/CS ratio in Fig. 9), contrary to what is observed in CCH. Though its abundance varies, CS seems to be abundant in the CND and not prominent in the region outside that plane.
Our observations show the CCH to be more abundant (lower HCN/CCH ratio in Fig. 9) towards the south-east CND region where the peak line emission is found for most species, with a significant but not too prominent () relative abundance decrease towards the north-western part of the CND. In addition its abundance is also significant outside of the CND plane defined by HNCO, which might be linked to outflowing material similar to what is observed in Maffei 2 (Meier & Turner 2012). The differences observed might be due to temperature affecting its chemistry. The models from Harada et al. (2013) (for the smaller XDR fraction to better represent this low-luminosity AGN) show CCH abundance to decrease as the temperature increase.
6 Summary
In this paper we have presented the 3 mm molecular observations carried out with ALMA towards NGC 1097. The detection of eight different molecular species has been discussed under our current understanding of the formation and excitation of each of these species. We have developed a molecular scenario of NGC 1097 first between the star forming ring and the nuclear region and secondly regarding the barely resolved morphology of the emission of these molecules in the central pc
The highest concentration of dense gas is located in the surroundings of the AGN (Hsieh et al. 2012; Izumi et al. 2013). The species HCN, HCO+ and CS appear to be tracing the same molecular component. An increase of the abundance of HCO+ and CS relative to HCN of in the star forming ring with respect to the central region is observed. The claimed large discrepancy in the HCN/CS ratio between SB and AGN galaxies (Izumi et al. 2013) is likely due to a real underabundance of CS of a factor of together with excitation differences. CS is observed to be excited to higher temperatures (Aladro et al. 2011b), which may be the evidence of a more prominent high density component () in SBs and may be less significant in AGNs. Additionally, CS could be underproduced in this high density regions in AGNs.
CCH shows overabundances of up to in the SF ring, and its abundance distribution differs significantly from the other species. We claim it to be closely related to star formation and it might be a good tracer of obscured star formation in the ring. The largest abundance contrast is shown by the densest gas tracers, namely SiO, HNCO, and HC3N, which are clearly overabundant around the AGN.
Within the central pc HNCO clearly delineates a circumnuclear disk of pc around the nucleus. The disk P.A. is slightly less inclined than the rotation plane of the overall molecular gas in the central region (P.A., Hsieh et al. 2011; Fathi et al. 2013). This disk appear to enclose the emission of HC3N and SiO which suggest an stratification of the disk as predicted by models (Harada et al. 2013) with each species being formed/enhanced at different regions within the disk. In this scenario, HNCO would trace the core of the molecular clouds in the disk well protected from the radiation from the AGN. Inside we would find a dense region moderately exposed to X-ray radiation where HC3N would be enhanced. Finally the radiation resilient SiO might be tracing the innermost molecular region of the circumnuclear disk.
HCN/HCO+ shows a positive gradient as we move away from the AGN, similar to what is observed towards NGC 1068, and therefore an enhancement of HCN via X-ray from the AGN is discarded. Unless HCO+ has some mechanism to be enhanced in the close vicinity of the AGN, we find plausible the HCN enhancement off the circumnuclear disk plane due to shocked gas in outflowing material from the central engine.
The results presented in this paper towards the low luminosity AGN in NGC 1097 are in agreement with previous results on the luminous AGN on NGC 1068 (García-Burillo et al. 2014; Takano et al. 2014), thus the difference in luminosity between the two sources does not appear to have a impact on its chemical structure around their AGNs. These early science ALMA results clearly show the potential of chemical studies to understand the physical processes in the circumnuclear disks around AGNs.
Acknowledgements.
This paper makes use of the following ALMA data: ADS/JAO.ALMA#2011.0.00108.S. ALMA is a partnership of ESO (representing its member states), NSF (USA), and NINS (Japan), together with NRC (Canada) and NSC and ASIAA (Taiwan), in cooperation with the Republic of Chile. The Joint ALMA Observatory is operated by ESO, AUI/NRAO, and NAOJ.References
- Aalto et al. (2012) Aalto, S., Garcia-Burillo, S., Muller, S., et al. 2012, A&A, 537, A44
- Aalto et al. (2007) Aalto, S., Monje, R., & Martín, S. 2007, A&A, 475, 479
- Ackermann et al. (2013) Ackermann, M., Ajello, M., Allafort, A., et al. 2013, Science, 339, 807
- Aladro et al. (2011a) Aladro, R., Martín, S., Martín-Pintado, J., et al. 2011a, A&A, 535, A84
- Aladro et al. (2011b) Aladro, R., Martín-Pintado, J., Martín, S., Mauersberger, R., & Bayet, E. 2011b, A&A, 525, A89
- Aladro et al. (2013) Aladro, R., Viti, S., Bayet, E., et al. 2013, A&A, 549, A39
- Amo-Baladrón et al. (2011) Amo-Baladrón, M. A., Martín-Pintado, J., & Martín, S. 2011, A&A, 526, A54
- Amo-Baladrón et al. (2009) Amo-Baladrón, M. A., Martín-Pintado, J., Morris, M. R., Muno, M. P., & Rodríguez-Fernández, N. J. 2009, ApJ, 694, 943
- Barth et al. (1995) Barth, A. J., Ho, L. C., Filippenko, A. V., & Sargent, W. L. 1995, AJ, 110, 1009
- Bayet et al. (2008) Bayet, E., Viti, S., Williams, D. A., & Rawlings, J. M. C. 2008, ApJ, 676, 978
- Bayet et al. (2011) Bayet, E., Williams, D. A., Hartquist, T. W., & Viti, S. 2011, MNRAS, 414, 1583
- Beuther et al. (2008) Beuther, H., Semenov, D., Henning, T., & Linz, H. 2008, ApJ, 675, L33
- Colbert et al. (2002) Colbert, E. J. M., Weaver, K. A., Krolik, J. H., Mulchaey, J. S., & Mushotzky, R. F. 2002, ApJ, 581, 182
- Costagliola et al. (2011) Costagliola, F., Aalto, S., Rodriguez, M. I., et al. 2011, A&A, 528, A30
- Davis et al. (2013) Davis, T. A., Heiderman, A., Evans, N. J., & Iono, D. 2013, MNRAS
- Dickinson et al. (1980) Dickinson, D. F., Rodriguez Kuiper, E. N., Dinger, A. S. C., & Kuiper, T. B. H. 1980, ApJ, 237, L43
- Drdla et al. (1989) Drdla, K., Knapp, G. R., & van Dishoeck, E. F. 1989, ApJ, 345, 815
- Fathi et al. (2013) Fathi, K., Lundgren, A. A., Kohno, K., et al. 2013, ApJ, 770, L27
- García-Burillo et al. (2014) García-Burillo, S., Combes, F., Usero, A., et al. 2014, A&A, 567, A125
- García-Burillo et al. (2000) García-Burillo, S., Martín-Pintado, J., Fuente, A., & Neri, R. 2000, A&A, 355, 499
- García-Burillo et al. (2010) García-Burillo, S., Usero, A., Fuente, A., et al. 2010, A&A, 519, A2
- Gil de Paz et al. (2007) Gil de Paz, A., Boissier, S., Madore, B. F., et al. 2007, ApJS, 173, 185
- Goicoechea et al. (2006) Goicoechea, J. R., Pety, J., Gerin, M., et al. 2006, A&A, 456, 565
- Graciá-Carpio et al. (2006) Graciá-Carpio, J., García-Burillo, S., Planesas, P., & Colina, L. 2006, ApJ, 640, L135
- Harada et al. (2010) Harada, N., Herbst, E., & Wakelam, V. 2010, ApJ, 721, 1570
- Harada et al. (2013) Harada, N., Thompson, T. A., & Herbst, E. 2013, ApJ, 765, 108
- Henkel et al. (2014) Henkel, C., Asiri, H., Ao, Y., et al. 2014, A&A, 565, A3
- Hsieh et al. (2012) Hsieh, P.-Y., Ho, P. T. P., Kohno, K., Hwang, C.-Y., & Matsushita, S. 2012, ApJ, 747, 90
- Hsieh et al. (2008) Hsieh, P.-Y., Matsushita, S., Lim, J., Kohno, K., & Sawada-Satoh, S. 2008, ApJ, 683, 70
- Hsieh et al. (2011) Hsieh, P.-Y., Matsushita, S., Liu, G., et al. 2011, ApJ, 736, 129
- Huettemeister et al. (1998) Huettemeister, S., Dahmen, G., Mauersberger, R., et al. 1998, A&A, 334, 646
- Hummel et al. (1987) Hummel, E., van der Hulst, J. M., & Keel, W. C. 1987, A&A, 172, 32
- Imanishi et al. (2007) Imanishi, M., Nakanishi, K., Tamura, Y., Oi, N., & Kohno, K. 2007, AJ, 134, 2366
- Imanishi et al. (2009) Imanishi, M., Nakanishi, K., Tamura, Y., & Peng, C.-H. 2009, AJ, 137, 3581
- Iwasawa et al. (1997) Iwasawa, K., Fabian, A. C., & Matt, G. 1997, MNRAS, 289, 443
- Izumi et al. (2013) Izumi, T., Kohno, K., Martín, S., et al. 2013, PASJ, 65, 100
- Jones et al. (2012) Jones, P. A., Burton, M. G., Cunningham, M. R., et al. 2012, MNRAS, 419, 2961
- Knudsen et al. (2007) Knudsen, K. K., Walter, F., Weiss, A., et al. 2007, ApJ, 666, 156
- Kohno et al. (2003) Kohno, K., Ishizuki, S., Matsushita, S., Vila-Vilaró, B., & Kawabe, R. 2003, PASJ, 55, L1
- Kohno et al. (2001) Kohno, K., Matsushita, S., Vila-Vilaró, B., et al. 2001, in Astronomical Society of the Pacific Conference Series, Vol. 249, The Central Kiloparsec of Starbursts and AGN: The La Palma Connection, ed. J. H. Knapen, J. E. Beckman, I. Shlosman, & T. J. Mahoney, 672
- Krips et al. (2011) Krips, M., Martín, S., Eckart, A., et al. 2011, ApJ, 736, 37
- Krips et al. (2008) Krips, M., Neri, R., García-Burillo, S., et al. 2008, ApJ, 677, 262
- Li et al. (2012) Li, J., Wang, J., Gu, Q., Zhang, Z.-y., & Zheng, X. 2012, ApJ, 745, 47
- Loenen et al. (2008) Loenen, A. F., Spaans, M., Baan, W. A., & Meijerink, R. 2008, A&A, 488, L5
- Martín (2011) Martín, S. 2011, in IAU Symposium, Vol. 280, IAU Symposium, ed. J. Cernicharo & R. Bachiller, 351–360
- Martín et al. (2010) Martín, S., Aladro, R., Martín-Pintado, J., & Mauersberger, R. 2010, A&A, 522, A62
- Martín et al. (2011) Martín, S., Krips, M., Martín-Pintado, J., et al. 2011, A&A, 527, A36
- Martín et al. (2009a) Martín, S., Martín-Pintado, J., & Mauersberger, R. 2009a, ApJ, 694, 610
- Martín et al. (2012) Martín, S., Martín-Pintado, J., Montero-Castaño, M., Ho, P. T. P., & Blundell, R. 2012, A&A, 539, A29
- Martín et al. (2009b) Martín, S., Martín-Pintado, J., & Viti, S. 2009b, ApJ, 706, 1323
- Martín et al. (2006) Martín, S., Mauersberger, R., Martín-Pintado, J., Henkel, C., & García-Burillo, S. 2006, ApJS, 164, 450
- Martín et al. (2008) Martín, S., Requena-Torres, M. A., Martín-Pintado, J., & Mauersberger, R. 2008, ApJ, 678, 245
- Martín et al. (2014) Martín, S., Verdes-Montenegro, L., Aladro, R., et al. 2014, A&A, 563, L6
- Martin-Pintado et al. (1992) Martin-Pintado, J., Bachiller, R., & Fuente, A. 1992, A&A, 254, 315
- Martin-Pintado et al. (1997) Martin-Pintado, J., de Vicente, P., Fuente, A., & Planesas, P. 1997, ApJ, 482, L45
- Martín-Pintado et al. (2000) Martín-Pintado, J., de Vicente, P., Rodríguez-Fernández, N. J., Fuente, A., & Planesas, P. 2000, A&A, 356, L5
- Matt et al. (1997) Matt, G., Guainazzi, M., Frontera, F., et al. 1997, A&A, 325, L13
- McMullin et al. (2007) McMullin, J. P., Waters, B., Schiebel, D., Young, W., & Golap, K. 2007, in Astronomical Society of the Pacific Conference Series, Vol. 376, Astronomical Data Analysis Software and Systems XVI, ed. R. A. Shaw, F. Hill, & D. J. Bell, 127
- Meier & Turner (2005) Meier, D. S. & Turner, J. L. 2005, ApJ, 618, 259
- Meier & Turner (2012) Meier, D. S. & Turner, J. L. 2012, ApJ, 755, 104
- Meijerink & Spaans (2005) Meijerink, R. & Spaans, M. 2005, A&A, 436, 397
- Meijerink et al. (2007) Meijerink, R., Spaans, M., & Israel, F. P. 2007, A&A, 461, 793
- Meijerink et al. (2013) Meijerink, R., Spaans, M., Kamp, I., et al. 2013, Journal of Physical Chemistry A, 117, 9593
- Muller et al. (2011) Muller, S., Beelen, A., Guélin, M., et al. 2011, A&A, 535, A103
- Muller et al. (2014) Muller, S., Combes, F., Guélin, M., et al. 2014, A&A, 566, A112
- Nakajima et al. (2011) Nakajima, T., Takano, S., Kohno, K., & Inoue, H. 2011, ApJ, 728, L38
- Nemmen et al. (2006) Nemmen, R. S., Storchi-Bergmann, T., Yuan, F., et al. 2006, ApJ, 643, 652
- Piñol-Ferrer et al. (2011) Piñol-Ferrer, N., Fathi, K., Lundgren, A., & van de Ven, G. 2011, MNRAS, 414, 529
- Pickett et al. (1998) Pickett, H. M., Poynter, I. R. L., Cohen, E. A., et al. 1998, Journal of Quantitative Spectroscopy and Radiative Transfer, 60, 883
- Pineau des Forets et al. (1990) Pineau des Forets, G., Roueff, E., & Flower, D. R. 1990, MNRAS, 244, 668
- Quillen et al. (1995) Quillen, A. C., Frogel, J. A., Kuchinski, L. E., & Terndrup, D. M. 1995, AJ, 110, 156
- Sanders et al. (2003) Sanders, D. B., Mazzarella, J. M., Kim, D., Surace, J. A., & Soifer, B. T. 2003, AJ, 126, 1607
- Schinnerer et al. (2010) Schinnerer, E., Weiß, A., Aalto, S., & Scoville, N. Z. 2010, ApJ, 719, 1588
- Storchi-Bergmann et al. (1993) Storchi-Bergmann, T., Baldwin, J. A., & Wilson, A. S. 1993, ApJ, 410, L11
- Tafalla et al. (2010) Tafalla, M., Santiago-García, J., Hacar, A., & Bachiller, R. 2010, A&A, 522, A91
- Takano et al. (2014) Takano, S., Nakajima, T., Kohno, K., et al. 2014, PASJ, 66, 75
- Terashima et al. (2002) Terashima, Y., Iyomoto, N., Ho, L. C., & Ptak, A. F. 2002, ApJS, 139, 1
- Tideswell et al. (2010) Tideswell, D. M., Fuller, G. A., Millar, T. J., & Markwick, A. J. 2010, A&A, 510, A85
- Tully (1988) Tully, R. B. 1988, Nearby galaxies catalog, ed. Tully, R. B.
- Usero et al. (2004) Usero, A., García-Burillo, S., Fuente, A., Martín-Pintado, J., & Rodríguez-Fernández, N. J. 2004, A&A, 419, 897
- Usero et al. (2006) Usero, A., García-Burillo, S., Martín-Pintado, J., Fuente, A., & Neri, R. 2006, A&A, 448, 457
- Viti et al. (2014) Viti, S., García-Burillo, S., Fuente, A., et al. 2014, A&A, 570, A28
- Walsh et al. (2010) Walsh, A. J., Thorwirth, S., Beuther, H., & Burton, M. G. 2010, MNRAS, 404, 1396
- Wang et al. (2004) Wang, M., Henkel, C., Chin, Y., et al. 2004, A&A, 422, 883
- Watanabe et al. (2014) Watanabe, Y., Sakai, N., Sorai, K., & Yamamoto, S. 2014, ApJ, 788, 4
- Wernli et al. (2007) Wernli, M., Wiesenfeld, L., Faure, A., & Valiron, P. 2007, A&A, 464, 1147
- Wootten (1981) Wootten, A. 1981, ApJ, 245, 105
- Zinchenko et al. (2000) Zinchenko, I., Henkel, C., & Mao, R. Q. 2000, A&A, 361, 1079