Origins of Massive Field Stars in the Galactic Center: a Spectroscopic Study
Abstract
Outside of the known star clusters in the Galactic Center, a large number of evolved massive stars have been detected; but their origins remain uncertain. We present a spectroscopic study of eight such stars, based on new Gemini GNIRS and NIFS near-infrared observations. This work has led to the discovery of a new O If+ star. We compare the reddening-corrected vs diagram for our stars with the massive ones in the Arches cluster and use stellar evolutionary tracks to constrain their ages and masses. The radial velocities of both the stars and their nearby H II regions are also reported. All of the stars are blueshifted relative to the Arches cluster by 50 km/s. We find that our source P35 has a velocity consistent with that of the surrounding molecular gas. The velocity gradient of nearby ionized gas along the Gemini GNIRS long slit, relative to P35 and the adjacent -300 km/s molecular cloud, can best be explained by a pressure-driven flow model. Thus, P35 most likely formed in situ. Three more of our stars have radial velocities different from their adjacent molecular gas, indicating that they are interlopers. The four stars closest to the Arches cluster have similar spectra, ages and masses to known cluster members, suggesting that they were likely ejected from the cluster via three-body interactions. Therefore, we find that the relatively isolated stars partly formed in situ and partly were ejected from the known star clusters in the Galactic Center.
1 Introduction
As the closest galactic nucleus, the Galactic Center (GC), containing its supermassive black hole (SMBH), Sgr A* (4106 M⊙, Ghez et al., 2008; Gillessen et al., 2009), provides a unique laboratory for studies of the interplay of stars with the interstellar medium (ISM) in galactic circumnuclear environments. Because of the proximity of the GC (8.4 kpc, Ghez et al. 2008; Gillessen et al. 2009), we are able to reach resolutions unparalleled in external galaxies (1″=0.04 pc) and distinguish individual stars. The central 300 pc of Galaxy, known as the central molecular zone (CMZ), is composed of 4107 M⊙ of molecular gas, much of which follows a twisted elliptical ring (Morris & Serabyn, 1996; Molinari et al., 2011). Several molecular clouds are collapsing and forming stars at an estimated rate of 0.03 M⊙/yr (Longmore et al., 2013). This is much different from the circumnuclear region of M31, the second closest galactic nucleus, which has small amount of molecular gas and no sign of current star formation (Li, Wang & Wakker, 2009, and references therein). Therefore, the GC is the best place to study the mode of star formation in the vicinity of a SMBH in great detail. A comprehensive study of massive stars in the GC is important to address several questions: 1) How do molecular clouds form stars in galactic nuclei? 2) Are massive clusters preferred in the GC, due to the large Jeans Mass (Morris & Serabyn, 1996)? 3) What is the star formation efficiency of molecular clouds in the GC? What fraction of molecular clouds is converted into stars, before spiraling into the potential well of, and thereby feeding, the SMBH? The answer to the last question can help determine the long-term activity of Sgr A*, which thereby affects the evolutionary history of the central regions of the Galaxy.
Over the past two decades, studies on current star formation in the GC have been centered on three young and massive star clusters within the inner 30 pc of the GC (the Arches, Quintuplet and Central clusters, 104 M⊙, 10 Myr old, Figer et al. 1999, 2002; Genzel et al. 2003). These clusters are so bright and compact that they clearly stand out in ground-based near-infrared (NIR) surveys, even amidst the strong stellar background toward the GC. These clusters are considered to be low-mass analogs of super star clusters in external galaxies, harboring hundreds of young massive stars whose strong stellar winds shape nearby molecular clouds (Lang et al., 1999, 2001a). The origin of these clusters is not yet well understood. Ground-based adaptive optics (AO) observations find that the Arches and Quintuplet clusters are moving toward Galactic East with velocities of 17215 km/s (Clarkson et al., 2012) and 13215 km/s (Stolte et al., 2014). The radial velocities of the Arches and Quintuplet cluster are 958 km/s (Figer et al., 2002) and 1022 km/s (Liermann et al., 2009; Stolte et al., 2014). Stolte et al. (2014) model the possible trajectories of the two clusters based on their 3D space velocities, and conclude that they may have formed in the transition zone between the Galactic bar Lindblad x1 and x2 orbits.
In addition to these three well-studied clusters, ever-increasing efforts have been undertaken to search for young stars outside the three known clusters (Cotera et al., 1999; Homeier et al., 2003; Mikles et al., 2006; Muno et al., 2006; Mauerhan et al., 2010a). Because the three clusters contribute only about half of the Lyman continuum photons in the GC (Figer et al., 2004), we expect that a similar number of massive stars should be situated outside the clusters. Indeed, our recent HST/NICMOS Paschen- survey of the GC reveals 180 Paschen- emitting sources (PESs), 100 of which are outside these clusters (Dong et al. 2012). These PESs should be evolved massive stars with strong stellar winds. For example, in the first follow-up spectroscopic observations, Mauerhan et al. (2010b) successfully identify one of our new sources as a new luminous blue variable (LBV) surrounded by a circular nebula and Mauerhan et al. (2010c) confirm that an additional 19 of our PESs are either OB supergiants or Wolf-Rayet (WR) stars. Unlike the PESs in the clusters, our ‘field’ PESs are relatively isolated, or are within small groups. Some of our PESs are coincident with H II regions (Dong et al., 2012). These PESs could be: 1) previous members of the three clusters, ejected by three-body interactions, binary-supernova explosion, or stripped off by a very strong tidal force, particularly when the clusters passed by Sgr A*; 2) members of dissolved massive star clusters; 3) members of young and less massive star clusters with only a few massive stars. The locations and properties of any ‘field’ massive stars are essential to properly constraining the star formation history and mode of the GC.
In this paper, we present new Gemini spectroscopic observations, and use them to measure the radial velocities of the PESs to the Galactic west (10′, i.e. 24 pc) of the Arches cluster. This region includes more than one dozen PESs (Dong et al., 2012), most of which have been identified as OB supergiants, and a few WR stars (Cotera et al., 1999; Muno et al., 2006; Mauerhan et al., 2010a, c), as well as the Arched filaments and several compact H II regions (H1 to H13) (Morris & Yusef-Zadeh, 1989; Lang et al., 2001b). This particular region was selected because these PESs lie behind the proper motion vector of the Arches cluster and could be its deserters, owing either to the regions tidal force or three-body interaction. Another reason is that Dong et al. (2012) report that several of these PESs are sufficiently luminous that their ultraviolet photons are capable of ionizing the nearby H II regions, indicating their possible physical association, not merely a line-of-sight coincidence. However, it is still not clear whether these stars are physically associated with the nearby, possibly natal, molecular clouds, or are massive stars only just now encountering these clouds in the course of their orbits. Here, we want to use the radial velocities of these PESs, as well as their extinction-corrected colors and magnitudes, to further explore their relationship with the known star clusters, especially the Arches cluster, and nearby H II regions.
In §2, we introduce our program objects and report on the spectroscopic observations. In §3, we determine the spectral types of the PESs and compare their extinction-corrected colors and magnitudes with the massive stars of the Arches cluster and with stellar evolutionary tracks. We also measure the radial velocities of the stars and nearby H II regions. We discuss our results in §4 and summarize in §5.
2 Sample and Spectroscopic Observations
2.1 Sample Selection
We have selected OB supergiants and O If+ stars111The superscript ‘+’ indicates the existence of S IV (4089Å and 4116Å) and N III/He II 4686Å (Walborn, 1971). associated with extended emission in our HST/NICMOS GC Paschen- image (Wang et al., 2010; Dong et al., 2012). The spectra of these stars still show helium absorption lines (Martins et al., 2008), indicating that their stellar winds are relatively weak, compared to the WR stars. Therefore, the centroids of these absorption lines, as well as several forbidden emission lines (see §3.3), from the photospheres could represent the radial velocities of the stars. In contrast, the spectra of WR stars are dominated by intense emission lines from expanding stellar winds, which are always too broad to be used to accurately determine the stellar systemic velocities.
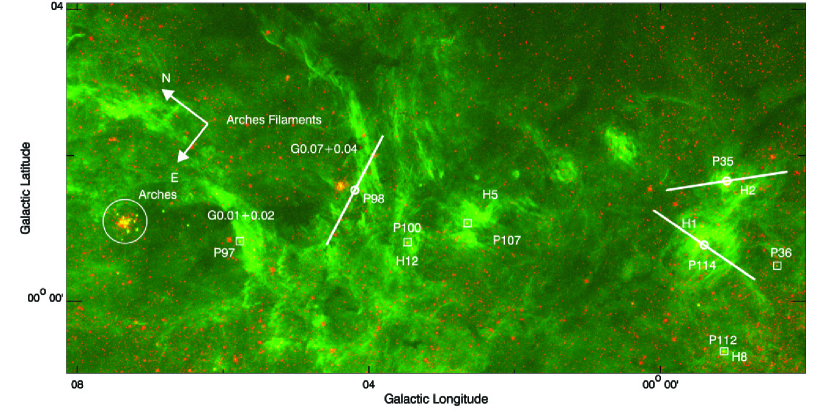
We have obtained the NIR spectra of eight Paschen- emitting OB supergiants and O If+ stars. The salient parameters of these stars are listed in Table 1. The star names used throughout this paper are adopted from Dong et al. (2012). Seven of these stars are less than 5″ or 0.2 pc away from distinct H II regions observed in radio (Morris & Yusef-Zadeh, 1989; Lang et al., 2001b). In particular, P114, P35, P100, P107 and P112 are at the centers of the H II regions named as H1, H2, H12, H5 and H8, respectively, while P36 is 1′ (2.4 pc) south of H1. The locations of the stars, as well as the H II regions and the Arches cluster, are labelled in Fig. 1.
2.2 Observations and Data Reduction
We used the 8-m Gemini North telescope to obtain NIR spectra of the stars (Program GN-2012A-Q-77). The and band spectra of P35, P98, P114 were observed with the spectrometer GNIRS. Its long slit (99″) covered adjacent nebular emission, as well as each of the three stars. But GNIRS was removed from Gemini for refurbishment in June, 2012, we thus switched to NIFS and obtained only band spectra of the other five stars.
The GNIRS observations used the short camera with its 110.5 lines/mm grating and a slit width of 0.3″, resulting in a spectral resolution of 5900 in the and bands. The slit was centered at =1.7 m ( band) or 2.11 m ( band). The pixel scale along the slit was 0.15″/pixel. We were able to select the roll angle, so that the slit covered not only the target stars, but also the peak emission of nearby H II regions (see Fig. 1). The observing pattern followed the standard ‘’ dither sequence. The targets were nodded along the slit ( and ). The total exposure times are listed in Table 2. Flat-field and wavelength calibration observations were taken after each observation. Spectra of the standard stars, HD 154663 (A1V) and HD 71254 (A1V), were observed at air mass similar to the scientific targets. The seeing of these observations was around 0.7″. According to the wavelength calibration files, the spectral resolution was 2.9 Å around 2.166 m, corresponding to a velocity resolution of 40 km/s.
NIFS is an Integral Field Unit (IFU) with 3″3″ field-of-view and has a spectral resolution of 5000. We used the filter ‘HK_G0603’ and grating. The slit was centered at 2.2 m. Nearby bright stars were used as natural guiding stars for the AO. The ‘’ dither pattern was used. For each target, we took two sets of observations. Dark regions, as viewed in the Spitzer IRAC 3.6 m image (Stolovy et al., 2006), were chosen as the off-source positions. The darkness of these regions is due to the presence of foreground dense clouds. The exposure time for each target is listed in Table 2. Flat-field images were taken during the daytime and the wavelength calibration observations were performed after each scientific observation. The standard stars, HD 14606 (A0V) and HD 171296 (A0V), were observed at air mass similar to the scientific targets. The spatial resolution of these observations was around 0.45″. According to the wavelength calibration files, we found that the spectral resolution was 3.8 Å around 2.166 m, i.e. 53 km/s.
We followed the data reduction procedures listed in the examples provided by the Gemini GNIRS/NIFS group, using the tasks contained in the Gemini IRAF GNIRS/NIFS package. The basic steps included trimming of the images, flat-fielding and sky subtraction, as well as wavelength and distortion calibration. We defined the local sky background for the sources at position , as the emission registered at position with the same detector coordinate. This background was removed from the images at position . The standard deviation in the wavelength calibration process was 0.1 pixel. This value was propagated into the uncertainty of the radial velocities determined in §3.3 and §3.4. Then, we extracted the spectra of our scientific targets from the calibrated images, within the central 0.75″. The same reduction procedures above were employed to extract the spectra of the standard stars. We used the IDL package, xtellcor (Vacca et al., 2003), to remove the H I absorption lines from the spectra of standard stars to derive the telluric absorption features. The corrected GNIRS and NIFS spectra of the eight stars are presented in Fig. 2 and Fig. 3, respectively. In Fig. 3, we also give the band spectra of the stars F8 (WN8-9h), F10 (O4-6 If+) and F15 (O4-6 If+) in the Arches cluster (Martins et al., 2008).
3 Analysis and Results
3.1 Spectral Classification of the Stars
We compare our new spectra with those presented in previous works and classify our stars, mainly using the criteria from previous NIR spectroscopic studies of massive stars by Morris et al. (1996), Hanson et al. (2005) and Martins et al. (2008).
Cotera et al. (1999) present spectra (with =250) of six stars within or near the H II regions in the GC. These stars include P35 (H2:A), P107 (H5) and P112 (H8). Their low-resolution spectra clearly show strong Br 2.166 m line. For P35 and P112, the He I 2.058 m and He I 2.112/3 m doublet are apparent. But because of the limited spectral quality, Cotera et al. (1999) only tentatively identify these stars as B[e] stars. Muno et al. (2006) update the spectral type of P35 to O If+, based on their - colors.
P107 and P35: Our new high-resolution spectrum of P107 shows additional diagnostic features: a He I 2.05 m absorption line, a He I/N III 2.112-2.115 m emission complex with a clear P-Cygni shape, a He II 2.189 m absorption line and a very weak N III 2.247/2.251 m emission doublet. These features are typical characteristics of both O If+ stars and WN8-9h stars. Martins et al. (2008) distinguish these two spectral types mainly by the relative strengths of the Br 2.166 m line and the 2.112-2.115 m complex; for a WN8-9h star, the Br 2.166 m line is stronger than the 2.112-2.115 m complex, while for an O If+ star, these two features have comparable strengths. Based on this criterion, we would categorize P107 as a WN8-9h star. However, WN8-9 stars should also show a signifcant 2.112-2.115 m complex and He II 2.189 m absorption lines with a P-Cygni shape (see the spectra of F8 in Fig. 3). The later feature is abscent in the spectrum of P107. On the other hand, like star 9 and 10 in Mauerhan et al. (2010c), the P-Cygni shape of the 2.112-2.115 m complex of P107 is similar to the O If+ stars, F10 and F15, in the Arches cluster (see Fig. 3). Thus, we classify P107 as an O4-6 If+ star, instead of WN8-9h. The He II 2.189 m absorption line without P-Cygni shape but with a weak 2.112-2.115 m complex emission is also found in P35, consistent with its classification as an O If+ star by Muno et al. (2006).
P112: We still keep the B[e] assignment for P112 by Cotera et al. (1999) , although we cannot exclude the possibility that it is a LBV star. Its NIFS band spectrum is very similar to that of the LBV star, ‘S Dor’ (Morris et al., 1996). We find Fe II 2.089 m and Mg II 2.138/2.144 m lines, but no CO overtone (2.3-2.4 m), which is typically found in B[e] spectra due to the presence of stellar disks (Morris et al., 1996). However, P112 and GCIRS34W, another LBV candidate (Trippe et al., 2006), have similar band magnitudes, but they are approximately three magnitudes fainter than the three known LBVs in the GC, Pistol, qF362 and G0.120-0.048 (7.5 mag, Mauerhan et al. 2010b). This difference is much greater than what may be expected from typical variability of LBV stars (which is 1 magnitude, e.g. Mauerhan et al. 2010c). Unfortunately, P112 is below the detection limit of Glass et al. (2001) (10.5 mag in the survey field ‘GC2’) and we do not have available information about its variability. Future monitoring program is needed to further constrain its spectral type.
P36 and P114: they are first considered as evolved massive star candidates, because of their detection (just like P35) in both Chandra and 2MASS observations (Mauerhan et al., 2009). Follow-up spectroscopic observations further classify them into O4-6 I stars (Mauerhan et al., 2010a, c). Our new high sensitivity NIFS spectrum of P36 shows that there is 5-7% enhancement near the Br 2.166 m. Therefore, we reclassify it as an O If+ star (Hanson et al., 2005), as suggested by the referee. The Br 2.166 m absorption line appears stronger and narrower in our spectrum of P114 than in that of Mauerhan et al. (2010a), which could be the result of our over-subtraction of local background, i.e., contamination by hydrogen emission from the nearby H II region (see § 3.4.1). Therefore, we exclude the hydrogen lines in the measurement of the radial velocity of P114 in § 3.3.
P97, P98 and P100: Dong et al. (2011) identify these three sources as PESs. The Paschen- equivalent widths and intrinsic intensities at 1.90 m of the sources indicate that they are OB supergiants (see Fig. 13 of Dong et al. 2012). Mauerhan et al. (2010c) spectroscopically confirm that P98 and P100 are O4-6 If+ stars. However, our new GNIRS spectrum does not have He II 2.189 m absorption line, but strong He I 1.700 m absorption line. Therefore, P98 could be a later type, such as O9-B0 If+ star (Hanson et al., 2005). Our NIFS spectrum of P97 is similar to that of P107 and F15 in Martins et al. (2008). We thus classify P97 as an O4-6 If+ star.
3.2 Color Magnitude Diagram
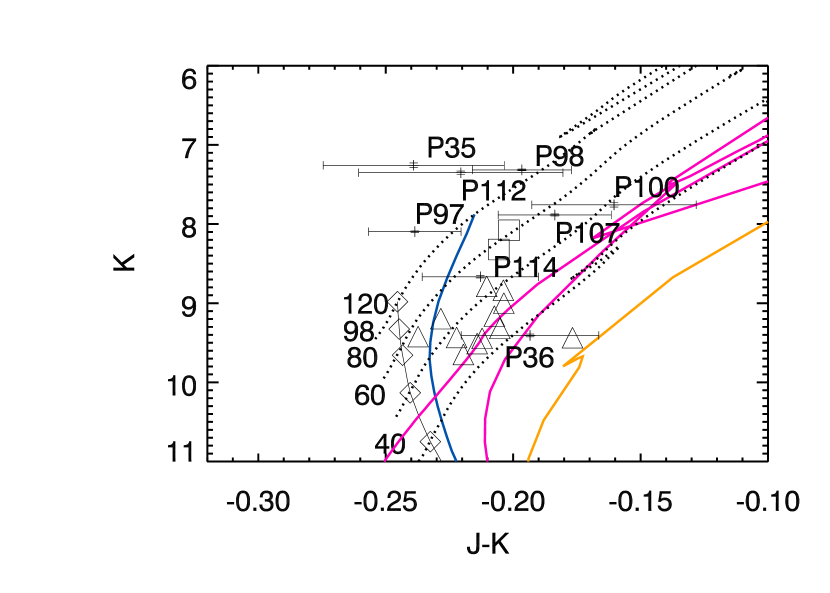
We show the extinction-corrected color magnitude diagram in Fig. 4. The NIR magnitudes for the majority of our stars are from the SIRIUS catalog222Simultaneous three-colour InfraRed Imager for Unbiased Surveys (SIRIUS) is mounted on the Infrared Survey Facility (IRSF) in South Africa (Nagayama et al., 2003). This camera surveyed the region and , with an angular resolution of 1.2″ in the band. (Dong et al., 2012). The SIRIUS catalog did not report magnitudes for P97 and P112; so for these sources we use the information from the recent UKIRT GC Plane survey (Lucas et al., 2008)333Although the throughputs of the and bands in the UKIRT and SIRIUS detectors are similar, the effective wavelength of the band (2.20 m) in the UKIRT survey is longer than that of the SIRIUS survey (2.14 m).. We convert the UKIRT magnitudes into the SIRIUS magnitudes using Eqn. 3-5 in Hewett et al. (2006) and Eqn. 7-9 in Dong et al. (2012). The foreground extinctions are from Table 2 of Dong et al. (2012), which are derived from the NIR colors of individual stars. We adopt the extinction curve of Nishiyama et al. (2006) to convert to (=0.787, see Table 1) and to obtain . The high extinctions (1.95) of our program stars are consistent with their being in the GC. Fig. 4 also includes the OB supergiants in the Arches cluster for comparison.
In Fig. 4, we also overlay the isochrones of four stellar ages as representative stellar populations and the evolutionary tracks of stars with four masses from the Geneva model (Ekström et al., 2012)444http://obswww.unige.ch/Recherche/evoldb/index/Isochrone/. We assume solar metallicity and no rotation. In Fig.11 of Dong et al. (2012), the - colors of the OB supergiants and O If+ stars are bluer than the WN stars, but are similar to those of the field stars from Spitzer/IRAC GALCEN survey (Stolovy et al., 2006), which mainly are Red Clump and Red Giant Branch stars. Therefore, the contribution of free-free emission from the wind, which is significant in the -band of WR stars (Mauerhan et al., 2010a) should be negligible in the OB supergiants and O If+ stars. Therefore, no free-free emission is considered here.
We estimate the ages and masses of our program stars based on their locations in the color-magnitude diagram. For each star, we use the following equation to estimate the maximum likelihood of a specific age and mass based on a comparison of the observed and model colors and magnitudes (Bailer-Jones, 2011):
| (1) |
where and are the extinction-corrected - colors and -band magnitudes. The subscript ‘m’ indicates the values predicted from the Geneva model as a function of stellar age and mass. and are the corresponding uncertainties in and . The estimated age and mass, as well as their errors, are listed in Table 1.
3.3 Radial Velocity Measurements of Stars
Table 3 lists the spectral features used to measure the radial velocities of individual stars. We mainly use the absorption lines, He II 10-7 2.189 m in the band and He II 12-7 1.693 m in the band in particular, to determine the radial velocities of the stars. But, we also use the N III 2S-2Po 2.247/2.251 m emission doublet, if present555Compared to the He II lines, the N III doublet are less affected by the stellar winds. We derive the radial velocities from He II 10-7 2.189 m and N III 2S-2Po 2.247/2.251 doublet, respectively, for P107, P100, P97 and P36, and find that they are different by less than 20 km/s and are consistent within the uncertainty. Because P107 and P100 have the strongest Br lines in our O supergiant and O If+ stars, i.e. the strongest stellar wind, we believe that in our sample, like N III doublet, the He II lines are less affected by the wind too.. These absorption lines and emission doublet are relatively isolated and arise from regions very close to the stellar photospheres due to non-LTE effects666The C IV 2.08 m triplet also supposedly arise from the photospheres. However, we find that the radial velocities derived from this triplet are blueshifted by 100 km/s, compared with those from He II 10-7 2.189 m and the N III 2S-2Po 2.247/2.251 m doublet, assuming the vacuum wavelengths in the Atomic Line list (v2.05). We suspect that the wavelengths may be problematic (Francisco Najarro, private communication) and thus do not include the triplet in the radial velocity measurement. (Fabrice Martins, private communication). If these distinct spectral features are totally absent, we then use another atomic hydrogen line, He I 1.70 m, or metal lines instead (see Table 3). We give the vacuum wavelengths of these lines in Table 4. In Appendix A, we further discuss the effects of stellar binarity on the velocity measurements.
We use the combination of a Gaussian function and a linear equation to fit the absorption or emission line and the adjacent normalized continuum through the least fitting method. When multiple lines are presented in the same spectrum, they are jointly fitted with their centroid wavelength ratios fixed to the NIR rest-frame values in the vacuum and the same velocity dispersion, which are linearly related to the standard deviation of the Gaussian function. The exception is P112, because the Br 2.166 m and Fe II 2.089 m originate in different parts of the expanding stellar winds. The radial velocities derived from these two lines should be considered as the lower limit for P112. In Fig. 5, we show the fitting results for the He II 10-7 2.189 m absorption line and the N III 2S-2Po 2.247/2.251 m emission doublet of P97, which has the strongest N III doublet in our sample, to demonstrate our fitting result. The Guassian function fit the lines very well and we do not see any asymmetry in the line profile of He II 10-7 2.189 m, which could be potentially caused by the stellar wind. We use the routine ‘MPFIT’ (Markwardt, 2009) to find the best-fit parameters and use the Monte Carlo method to derive the uncertainty. This involves randomly adding a value that follows a normal distribution with a mean of zero and a standard deviation equal to the intensity uncertainty, to the observed intensity at each spectral pixel. Then we fit the new spectrum and obtain a new velocity and dispersion. Repeating this process 104 times, the 68% percentiles of the outputs are the errors of our parameters. In Table 3, we list the velocities and dispersions for the eight sources.
3.4 Radial Velocity Measurements of H II regions
3.4.1 GNIRS
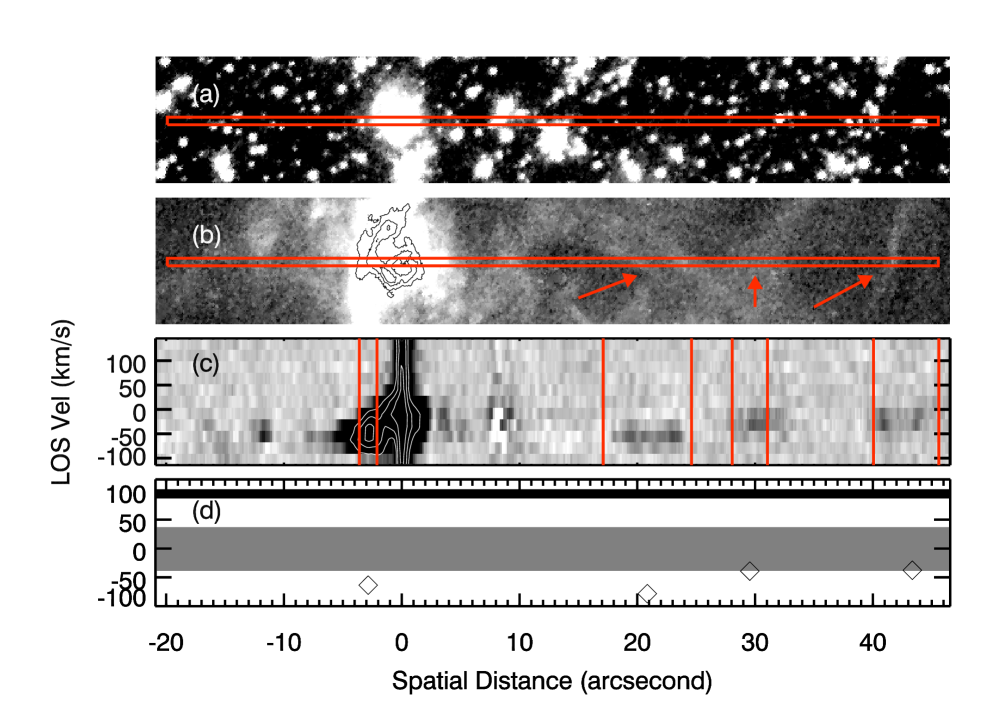
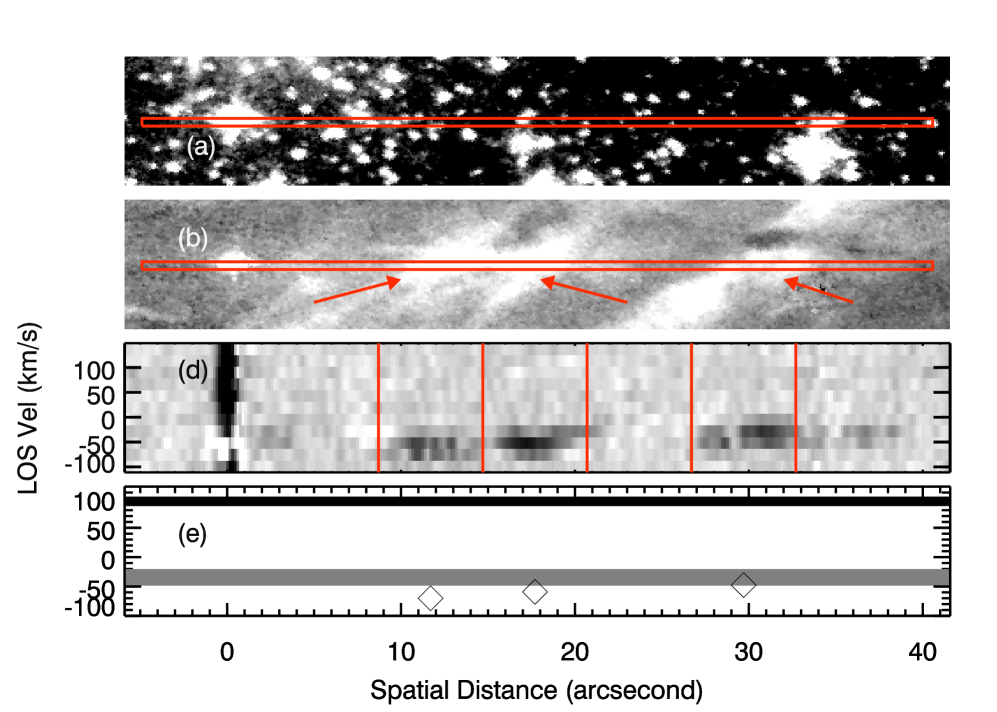
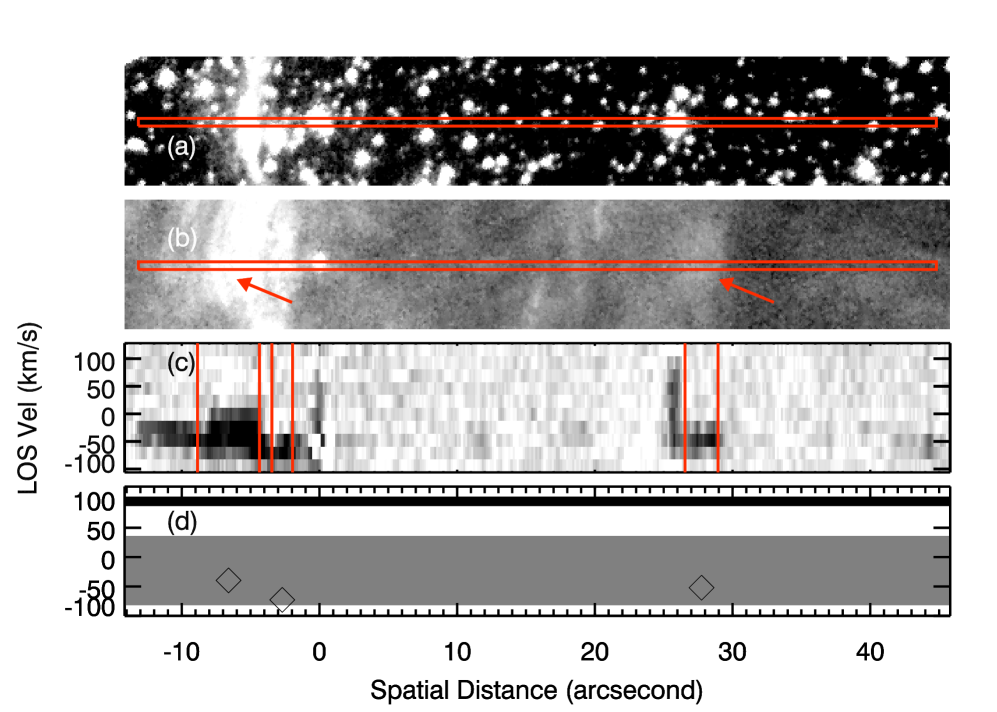
Figs. 6-8 show the locations of the slit on the HST/NICMOS F190N and Paschen- images for P35, P98 and P114. The figures also include the velocity-position diagrams of the Br 2.166 m line for these three stars and the ionized surface of nearby molecular clouds.
In Figs. 6c-8c, we present the ‘continuum-subtracted’ spectra of these three stars. We use the ‘line-free’ spectra at 2.155-2.158 m and 2.174-2.177 m to interpolate the continuum at 2.158-2.174 m, which is subtracted from our Gemini/GNIRS spectra for the line images around Br 2.166 m. Consequently, most of the stellar continuum emission in the field-of-view has been eliminated. We also convert the units of the ordinate from wavelength (m) to radial velocity (km/s), relative to the rest wavelength of Br 2.166 m. We extract the spectra from the regions within the thick red lines in Figs. 6c-8c to measure the radial velocities of the nearby H II regions. We use the same method in § 3.3 to derive the centroids and their uncertainties for the Br 2.166 m emission, from which we derive the radial velocities, given in Table 5 and Figs. 6d-8d.
3.4.2 NIFS
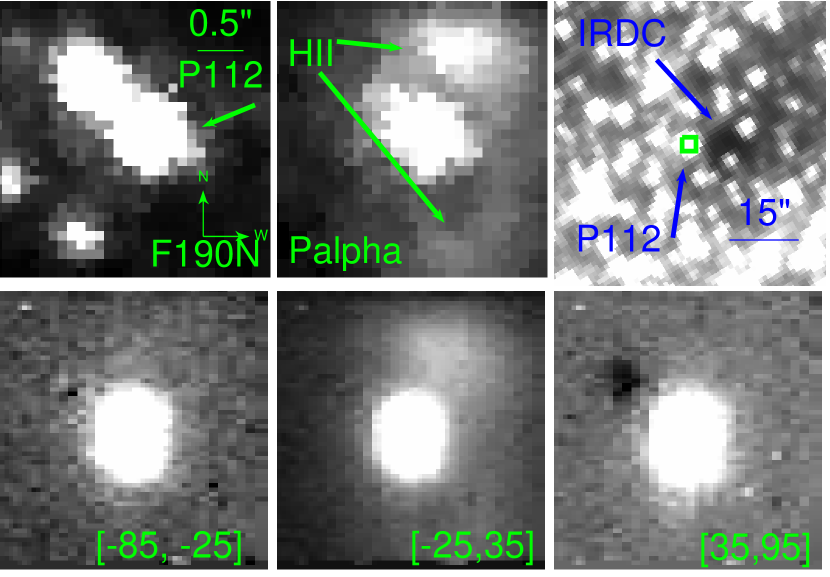
Due to the small field-of-view of NIFS, we can only study the emission from the adjacent H II region within 3″3″ of each source. For the five stars with NIFS observations, only P112 has extended hydrogen emission within the NIFS field-of-view, as seen in our HST/NICMOS Paschen- image.
In Fig. 9, we show the HST/NICMOS F190N continuum image and Paschen- emission image of P112 at the same spatial scale as the NIFS observations; the Spitzer IRAC 3.6 m (Stolovy et al., 2006) image of the region; and NIFS Br images for three velocity ranges ([-85,-25], [-25,35] and [35, 95] km/s) for P112. In the HST Paschen- image, we see an enhancement in the 1.1″ (0.045 pc) to the northwest of P112, as well as a faint ring structure to the southwest. This emission is not attributable to stellar emission, as can be seen by comparison to the HST F190N image. In the Spitzer IRAC 3.6 m image, we notice that there is an infrared dark cloud (IRDC) to the west of P112. Therefore, the Paschen- emission could come from the surface of this cloud, suggesting that P112 and the IRDC are physically related. For our NIFS data, we subtract the stellar spectra around Br 2.166 m using continuum measurements inferred from the surrounding wavelength ranges 2.155-2.158 m and 2.174-2.177 m. In the bottom panel of Fig. 9, we show the NIFS images at three velocity ranges. Weak emission from the northwest of P112 is evident within the [-25,35] km/s range. We extract the spectra from this region to more accurately derive the radial velocity, including the uncertainty, for the ionized gas. This velocity is presented in Table 5.
4 Discussion
The above results enable us to explore the origins of our program stars. In §4.1, we examine the relationship of our program stars to their adjacent ionized/molecular gases, through a comparison of their radial velocities. In §4.2, we provide an in-depth discussion about the link between the PESs P114/P35 and the shell-like H II regions, H1/H2, respectively. In §4.3, we examine the possible mode of star formation in the GC.
4.1 Radial Velocity Comparison
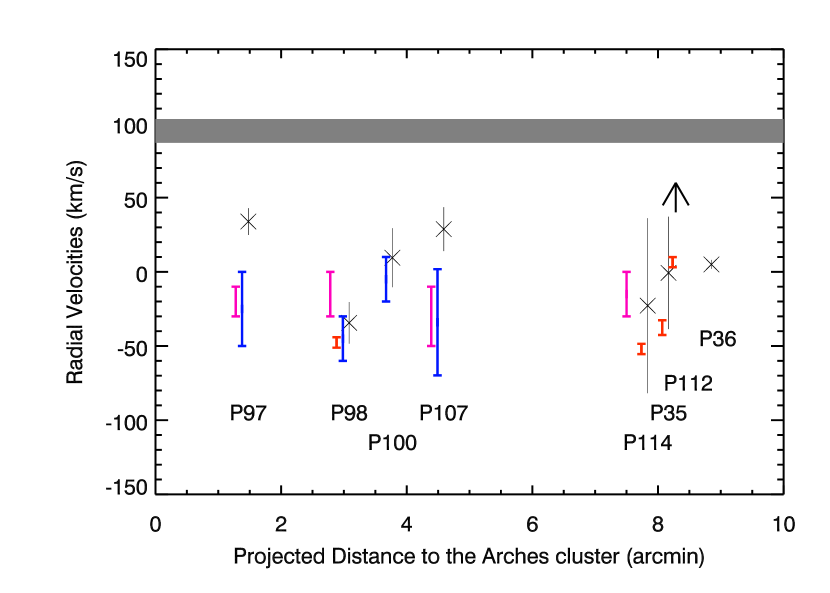
Fig. 10 compares the velocity measurements of our program stars and their adjacent diffuse gases as a function of their projected distance from the Arches cluster. The figure includes independent velocity measurements of ionized and molecular gases from previous radio observations of the H92 recombination line (Lang et al., 2001b, 2002) and molecular lines (e.g., CS, HCN, Tsuboi et al. 1999, 2011). The shaded area represents the one sigma uncertainty range of the radial velocity of the Arches cluster (87103 km/s) (Figer et al., 2002). The radial velocity of the Quintuplet cluster (1022 km/s) (Liermann et al., 2009; Stolte et al., 2014) is very similar to that of the Arches cluster and has not been marked in Fig. 10. Clearly, the Arches and Quintuplet clusters are redshifted by at least 50 km/s relative to all eight of our program stars.
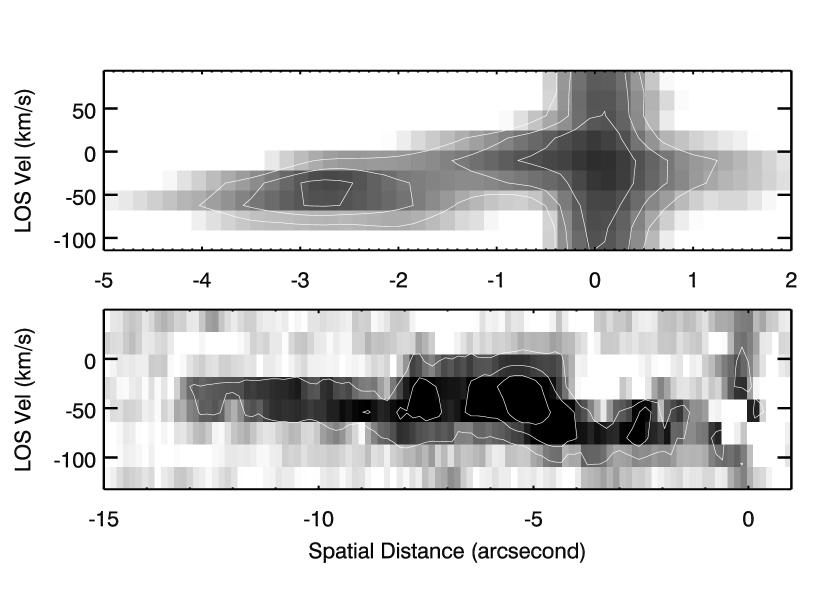
The radial velocities of P35 and P114 are similar to that of the nearby -300 km/s molecular cloud (Tsuboi et al., 1999). Fig. 6d and 8d show some velocity gradients of the ionized gas near the stars at 3 sigma level. At projected distances of -5″ (0.2 pc) and 30″ (1.2 pc) from the stars, the ionized gas is blueshifted, as compared to both the stellar velocities and that of the nearby molecular gas. However, the gradients between the vertex of the H II regions and P35/P114 stars are different. We show zoomed-in versions of Fig. 6c and 8c in Fig. 11. Moving toward the program stars, the radial velocity of the ionized gas decreases from about -80 km/s to 0 km/s in H2, while it increases from -40 km/s to -70 km/s in H1. Because P114 and P35 are the only bright evolved massive stars near the H1 and H2 H II regions, these observed strong velocity gradients support the argument presented in Dong et al. (2012) that P114/P35 are physically associated with their H II regions. We explore the relationship between P114/P35 and H1/H2 further in §4.2 and §4.3.
Unlike P35 and P114, the radial velocities of P107, P97 and P112 are significantly different from those of ionized/molecular gases that are nearby in projection. P107 is located within the gap of the two parts of the H5 H II region (Fig. 1; see also Fig. 15 of Dong et al. 2012) and is redshifted relative to the nearby ionized gas (-34.435.8 km/s; Lang et al. 2001b) and molecular clouds (-3020 km/s; Serabyn & Guesten 1987). Like P107, the radial velocities of P97 and the apparently nearby G0.01+0.02 H II region (ionized gas: -2842.4 km/s, molecular gas: -2010 km/s; Lang et al. 2001b) differ by more than 60 km/s. The lower limit of the radial velocity of P112 (40.15 km/s) is significantly larger than that of the ionized gas (6.53.4 km/s). Based on location and derived stellar types these stars could be the ionizing sources of the projected nearby H II regions. Therefore, the stars are more likely just passing near the molecular clouds, than emerging from them.
P98 and P100 lie near the arched radio filaments. The radial velocities of the nearby ionized gas derived from the Br 2.166 m measured from our spectra and the H92 values of Lang et al. (2001b) (-43.622.6 km/s) are similar to that of P98. If the ionized gas near P100 is an extension of the Arched Filaments, we would expect its radial velocitiey to be -35 km/s (e.g. Fig. 7 of Lang et al. 2001b, where P100 would be located near boxes ‘15’, ‘16’ and ‘17’). Assuming this velocity for the gas, it is slightly blueshifted, when compared to P100. However, unlike P35 and P114, in our HST/NICMOS Paschen- image, P98 is not embedded within the nearby H II region, G0.07+0.04, which is attributable to the Arches cluster, and we do not find a radial-velocity gradient in the GNIRS spectra of the ionized gas near the star. In addition, the morphologies of ionized gas near P98 and P100 do not indicate that they formed in-situ. Therefore, P98 and P100 are probably not physically associated with the projected nearby H II regions.
Unlike the other seven stars, P36 is relatively isolated, with no obvious nearby H II region. The measured radial velocity for this star is slightly redshifted, when compared to the nearby -300 km/s molecular cloud. The data suggest that P36 formed elsewhere and recently approach the -300 km/s molecular cloud in projection.
4.2 The Cometary Morphology of the H1 and H2 H II regions
The strongly asymmetric morphologies of the H1/H2 H II regions are striking (Fig. 1). The Paschen- emission is the brightest on the side towards the -300 km/s molecular cloud (H1: celestial north, H2: celestial northeast, see Fig. 1). The morphology may represent either a bow shock or a pressure-driven flow in a medium having a strong density gradient (Zhu et al., 2008, and references therein). In the bow shock scenario, the stellar wind from a massive star drives the surrounding gas into a thin parabolic shell, which captures ionizing photons and generates the observed hydrogen recombination lines. In the pressure-driven flow scenario, the stars are nearly static, relative to the unperturbed surrounding medium and the flow (commonly called ‘Champagne flow’) is driven by the pressure gradient produced by the ionization.
These two scenarios may be distinguished by their different radial velocity distributions of the ionized gas relative to the star. A bow shock is expected when a massive star moves supersonically through its ambient medium. If the motion is not limited to the plane of the sky, then the radial velocity of the shock should be about the same as that of the star, but should be offset from that of the ambient medium. We find that the line emission from the bright arcs of H1/H2 is blueshifted, by 40 km/s, relative to the -300 km/s molecular cloud. This blue shift suggests that the massive stars should be behind the molecular gas and are moving towards us, relative to the molecular cloud. According to Fig. 46 of Zhu et al. (2008), in this situation, when moving from the vertex of the shell to massive stars, the radial velocity of the ionized gas gets more negative. One good example is the position-velocity diagram of Sgr A East A derived from the [Ne II] 12.8 m lines in Yusef-Zadeh et al. (2010), which is used to argue for a bow-shock model. Similarly, the position-velocity diagram of the ionized gas near P114 in Fig. 8c and Fig. 11 seems to be consistent with that predicted by the bow shock model.
The bow shock scenario would require a particular geometry in light of the measured extinction of P114, which is similar to that of the other stars (see Table 1). Also, the bright Paschen- emission from H1 suggests that it arises from the near side of the -300 km/s molecular cloud. Thus, the bow shock scenario requires that P114 is very close to the front edge of and will soon pass through the -300 km/s molecular cloud. Yusef-Zadeh et al. (2010) invoke a similar geometrical juxtaposition to explain the Sgr A East A-C H II regions, which also have moderate extinction. They suggest that the stars embedded in the Sgr A East A-C regions formed outside and are probably just entering a region with low surface density of molecular gas. Therefore, we cannot ignore the possibility that P114 may be an interloper from elsewhere. More spectroscopic observations at high velocity resolution are needed to map the H1 H II region to explore this possibility.
If the H II regions are instead pressure-driven shells, they would be primarily created by the advance of the ionization front into the ambient medium, coupled with the compression by the stellar wind. In this scenario, the blueshifted ionized gas at the vertex of the shell would indicate that the central star is in front of the molecular clouds. This scenario naturally explains the moderate extinction of P35. Unlike the bow shock model, the radial velocity of the ionized gas approaches that of the central star from the vertex of the shell to the central star, which is seen in Fig 47. of Zhu et al. (2008). A good example of a region where this has happened is the G29.96-0.02 H II region (Zhu et al., 2008), which has a position-velocity diagram along the symmetry axis similar to that we have found for P35 in Fig. 6c and Fig. 11.
4.3 Origins of the Stars
Where were the massive stars discussed here born? Although they were selected as probable GC field stars, they could still have formed in clusters, existing or dissolved. In general, massive stars tend to form in large aggregates. In the solar neighborhood, for example, 90% of the O stars are in, or can be tracked back to, nearby clusters or OB associations (Zinnecker & Yorke, 2007, and references therein). Stars can escape from the clusters through supernova explosions in binaries, three-body interactions and the strong tidal forces in the GC.
Our program stars, especially the ones associated with nearby H II regions, could have formed in-situ. For example, one potential site of star formation, G-0.02-0.07, is 2.5′ (6 pc in projection) away from Sgr A* and includes four compact H II regions, Sgr A East A-D (Yusef-Zadeh et al., 2010; Mills et al., 2011).
4.3.1 The Three Massive Star Clusters
The three massive star clusters in the GC are the main suspects for having produced these ‘field’ evolved massive stars, because of their unique properties. Due to the high stellar number densities in the cores of the clusters, after the formation of the first massive binary, three-body interactions among massive stars could happen with a large probability (Portegies Zwart et al., 2010). The stars with the lowest mass are the most likely to be ejected from the system, with the remaining two more massive ones forming a binary system. For example, five stars in the Arches cluster have initial masses of nearly 120 (Martins et al., 2008), larger than all of our program stars. Three of them have X-ray counterparts (Wang et al., 2006) and should be massive binaries. A supernova explosion in a binary system could also provide one massive component of the binary system with enough kinetic energy to escape the potential well of its cluster. However, this mechanism is only efficient in clusters that are 3 Myrs old, when massive stars end their lives as supernovae (Gvaramadze et al., 2010), and is not a very efficient mechanism to produce young massive runaway stars with escape velocities 70 km/s (Gvaramadze & Gualandris, 2011).
Indeed, Mauerhan et al. (2010c) find three WNh stars 50″ (2 pc, in projection) off the Arches cluster. These stars have magnitudes and spectral types similar to those of the brightest ones in the Arches cluster and might be coeval with the Arches cluster. If they were ejected from the Arches cluster, soon after they formed, only 1 km/s proper motions are needed to reach their current projected positions. Compared to the three WNh stars, our program stars are further away from the Arches cluster, but have less evolved stellar types. This is consistent with what one might expect from three-body interactions: the less massive stars, which evolve more slowly, can get higher escape velocities. However, the three-body interaction mechanism predicts that the stars ejected from the parental cluster should have random directions, while all our program stars are blueshifted relative to the Arches cluster. This might be a selection effect, however, since the stars included in our observational sample were selected only to the Galactic west of the Arches cluster.
Gvaramadze & Gualandris (2011) have simulated the three-body interaction process for massive stars. In one set of their simulations, a star having mass 80 M⊙ approaches a binary consisting of 120 M⊙ and 90 M⊙ stars at a separation of 0.3 AU. As a result of the interaction, the lower-mass single star is typically ejected at relatively high velocity, while the binary separation decreases. Gvaramadze & Gualandris (2011) run the simulation many times with different parameters, and find that the escape velocity of the third star and its mass are anti-correlated. The mean ejection velocity is 100 km/s at 20 M⊙ and decreases to 30 km/s at 80 M⊙ (Fig.9 of Gvaramadze & Gualandris 2011). They also find that approximately 1% of stars with 20/50/80M⊙ are expected to have velocities exceeding 500/300/200 km/s.
Besides the three-body interaction, massive stars could leave the three clusters by tidal stripping, particularly when the clusters make their closest approach to Sgr A*. Habibi et al. (2014) simulate the evolution of the Arches and Quintuplet clusters in the potential well of the GC, based on their present spatial locations and 3D velocities. They find that due to the strong tidal field, the tidal tails of these star clusters could extend to tens of pc. Our program stars indeed fall into the Galactic western tidal tail of the Arches cluster in their simulation. Habibi et al. (2014) suggest that their best-matching model could explain 80% of the WR stars out to 21 pc from the Arches cluster and that the velocities of massive stars in the tidal tail relative to the Arches cluster could reach 20 km/s.
In Table 6, we give the velocities of our program stars, relative to the Arches cluster. Since we do not have proper motion measurements for our program stars necessary to derive their full 3D paths, we first consider the simplest case in which all eight stars escaped from the Arches cluster 3 Myr ago, the age of the Arches cluster. If the stars were ejected later in the evolution of the Arches cluster, their proper motion should be higher than what we derive. The error of the required proper motion derived here accounts for the uncertainty in the age of the Arches cluster (from 2 Myr to 4 Myr), but does not address the possibility of later ejections or non-related objects. Combined with the radial velocities derived in § 3.3, the total velocities of our program stars, relative to the Arches cluster, range from 50 to 140 km/s, which are larger than predicted by tidal stripping, but still within the velocity range predicted by the simulations of three-body interactions by Gvaramadze & Gualandris (2011). Therefore, it is possible that all our program stars were previous members of the Arches cluster that left the cluster because of the combined effects of three-body interaction and tidal stripping.
Our new spectra and the stellar ages and masses derived from the NIR photometry in § 3.2 can also help us identify the family members of the three clusters. The ages of our program stars are roughly 2-3.5 Myr (see Table 1), similar to the Arches cluster, but younger than the Quintuplet (4 Myr old) and the Central cluster (6 Myr old). The four O If+ stars (P97, P98, P100 and P107) are the closest to the Arches cluster in our sample. Their spectra are similar to those of the two O If+ stars, F10 and F15, in the Arches cluster (2-4 Myr, 60-90 M⊙ Martins et al., 2008). Therefore, they could be previous members of the Arches cluster. P114 has mass similar to those of the OB supergiants in the Arches cluster. Although Oskinova et al. (2013) suggest that P114 could have been ejected from the Central cluster, considering the morphology of H1, the possibility that P114 was ejected from Arches cluster cannot be ruled out. P114 could lag behind the rapidly moving Arches cluster, but still move toward Galactic east, relative to the old field stars in the GC. We find that no stars in the Arches cluster have spectra similar to P112 and P36, which might thus have formed elsewhere.
Combined with the three WNh stars suggested in Mauerhan et al. (2010c), there are seven potential ‘field’ evolved massive stars that could be previous members of the Arches cluster. These stars do not have X-ray counterparts and seem to be single stars. Following three-body interactions, one should find the same number of massive binaries moving in the opposite directions, with velocities less than half those of the ejected single stars, relative to the Arches cluster, due to momentum conservation. If the velocities of these massive binaries are small, they cannot escape the potential well of the Arches cluster. Classifying a massive binary system as a single star would overestimate/underestimate not only its mass/age, but also those of the whole cluster. However, to recognize these close massive binaries in the GC is challenging with current near-IR cameras. While the collision wind zones in massive binaries could emit X-rays, their X-ray luminosities are very sensitive to the strength of the stellar winds and the distance between these two stars. Therefore, in the Arches cluster, besides the three potential massive binary systems recognized as X-ray pointing sources in Wang et al. (2006), we cannot exclude the possibility that there are additional massive binary systems, which are X-ray faint. A future long-period monitoring program of the variability and the radial velocity of stars in the Arches cluster is needed to explore this possibility further. Searching for runaway stars in the other directions from the Arches cluster could also help us indirectly estimate the number of massive binaries within the cluster.
4.3.2 Dissolved Star Clusters
Besides the three massive clusters, the current field stars could also come from dissolved star clusters. Portegies Zwart et al. (2002) (see also Kim et al. 1999, 2000; Kim & Morris 2003) simulate the infall of young, massive and compact star clusters, into the central potential well. Due to the strong tidal forces and possible three-body interactions, they find that massive stars can be stripped from their nascent star clusters. However, the number densities of these clusters are not expected to be below the background density until after roughly 5 Myr, and are not totally dissolved until 50 Myr. As we found in § 3.2, however, the ages of our observed stars range from 2.23.2 Myr (see Fig. 4 and Table 1). Therefore, they unlikely arise from dissolved massive star clusters.
4.3.3 In-situ Star Formation
The massive field stars could also form in isolation, beyond the star clusters. For example, in § 4.2, we discussed two models to explain the cometary morphology of the H1/H2 H II regions, which indicate distinct origins for P114 and P35. In the bow shock scenario, the central star is a massive star that formed outside and encounters the -300 km/s molecular cloud with supersonic velocity. In the pressure-driven flow scenario, the massive star formed in-situ. We argue that the pressure-driven flow scenario could be more suitable for explaining the radial velocities of the adjacent ionized gas in H2, relative to P35 and the -300 km/s molecular cloud. Therefore, P35 could represent the tip of an underlying star cluster. If so, P35 is apparently the only evolved massive star within the cluster and provides a sufficient UV photons to ionize the H II regions. Therefore, this new star cluster would have to be substantially smaller than the known three massive clusters.
How such a small star cluster could form has very important impact on our understanding of mode of star formation in the GC. The harsh environment in the GC is very hostile to star formation (Morris & Serabyn, 1996). For example, Longmore et al. (2013a) find that the star formation rate per unit mass of dense gas is an order magnitude smaller than that in the Galactic Disk (see also Kruijssen et al. 2014). Due to the high gas temperature/density, strong magnetic field and tidal force, only dense molecular clouds could survive and collapse to form stars, while less dense ones will be tidally destroyed. Therefore, the Jeans Mass is very high (Morris & Serabyn, 1996) and we should expect the self-collapse of natal molecular clouds to produce the clusters like the three massive one, but not a small cluster in H2, especially when this star cluster is near the edge, not in the core of the -300 km/s molecular clouds. Additional mechanisms, such as external forces, are needed to induce collapse. For example, Sgr A East supernova remnant was previously suggested to trigger the star formation in Sgr A East A-D, although later studies suggest that those H II regions are older than Sgr A East supernova remnant (Mills et al., 2011, and references therein). Compared to Sgr A East A-D, H2 is a better place to study the effect of external forces on the star formation in the GC, because the massive stars ionizing Sgr A East A-D were suggested to be interlopers and their birth places are still unclear (Yusef-Zadeh et al., 2010).
In order to identify which external forces triggered the star formation in H2, we need to trace the -300 km/s molecular cloud back to its location at 22.5 Myr ago (the age of P35, see Table 1). Molinari et al. (2011) study the Herschel observations of dust emission in the CMZ and propose that the molecular clouds in the CMZ lie on a 100 pc twisted ring between Sgr B and Sgr C, with an orbital period of 3 Myr. In their model, interestingly, Sgr A* is not at the center of this elliptical ring and is close to its front side, where the known 20 km/s and 50 km/s molecular clouds are located. On the other hand, the -300 km/s molecular cloud is currently on the back side of the ring. But, 22.5 Myr ago the cloud should have just encountered Sgr A*.
Longmore et al. (2013a) suggest that Sgr A* could trigger star formation in the approaching molecular clouds, through compressing them along the direction perpendicular to their orbits, but stretching in the direction of the orbit. They argue that the intense star formation in Sgr B2 could have been triggered by Sgr A*, and the same for four dense molecular clouds between Sgr A* and Sgr B2 above the Galactic Plane. According to the toy model of Molinari et al. (2011), these clouds lie behind Sgr B2 in the twisted ring and have just passed Sgr A*, which explains why these clouds show little sign of early stages of star formation, while Sgr B2 is experiencing intense star formation now. Therefore, the star formation at the edge of the -300 km/s molecular cloud could have been triggered by tidal forces, when it approached Sgr A* 22.5 Myr ago. From the Herschel observations, its column density is substantially smaller than those of Sgr B2, which could explain why any star cluster formed in H2 is significantly smaller than that in Sgr B2.
5 Summary
In this work, we have measured the radial velocities of eight O supergiants/O If+ stars in the Galactic center and explored their relationship with nearby H II regions, based primarily on our Gemini GNIRS/NIFS spectroscopic observations. We have also constrained the ages and masses of these stars from the extinction-corrected near-infrared color magnitude diagram. We have further explored the origins of these massive stars. Our results are as follows:
-
•
We have identified a new O If+ star, P97, 1.5′ (i.e. 3.6 pc) off the Arches cluster and have refined the spectral type of P107 from B[e] to O If+ and P36 from O supergiant to O If+.
-
•
We find that the stars are 2-3.5 Myr old and have zero-age main-sequence masses 50 M⊙.
-
•
The derived radial velocities of the program stars are all smaller than that of the Arches and Quintuplet clusters by at least 50 km/s. We have also derived the radial velocities of nearby H II regions for four of our stars.
-
•
The radial velocities of P35 in the H2 H II region and the nearby -300 km/s molecular cloud are similar, but are redshifted compared to the ionized gas at the vertex of the shell. The radial velocity pattern of the ionized gas along the GNIRS slit suggests that the pressure-driven flow scenario is preferred to explain the cometary morphology of the H2 H II region. Therefore, we find that P35 likely formed in-situ. The star formation could have been triggered 22.5 Myr ago, perhaps when the -300 km/s molecular cloud was near its closest passage to Sgr A*.
-
•
The other seven sources are likely unrelated to nearby molecular clouds. The bow shock scenario can explain the position-velocity diagram of ionized gas near P114, which could merely be passing by the -300 km/s molecular cloud. The radial velocities of P97, P107 and P112 are different from nearby ionized/molecular gases, suggesting that they should be interlopers. Although the radial velocities of P98, P100 and P36 are similar to those of nearby H II regions, their morphologies do not suggest that these stars formed in-situ.
-
•
P97, P98, P100 and P107 have similar ages, masses and spectra to those of the two O If+ in the Arches cluster and could then be ejected members.
-
•
The origins of P36, P114 and P112 remain uncertain. Because of their small ages, they are unlikely from a dissolved massive star cluster. Future proper-motion information is needed to determine their birthplaces.
Acknowledgments
We thank the anonymous referee for a thorough, detailed, and constructurive commentary on our manuscript. We are grateful to Fabrice Martins, Francisco Najarro, Fahad Yusef-Zadeh, and Cornelia Lang for many valuable comments and discussion. H. D. also acknowledges NASA support via the grant GO-12055 provided by the Space Telescope Science Institute, which is operated by the Association of Universities for Research in Astronomy, Inc., under NASA contract NAS 5-26555. H. D. appreciates Fuyan Bian’s great help in the data reduction.
References
- Bailer-Jones (2011) Bailer-Jones, C. A. L. 2011, MNRAS, 411, 435
- Clarkson et al. (2012) Clarkson, W. I., Ghez, A. M., Morris, M. R., et al. 2012, ApJ, 751, 132
- Cotera et al. (1999) Cotera, A. S., Simpson, J. P., Erickson, E. F., et al. 1999, ApJ, 510, 747
- Dong et al. (2011) Dong, H., Wang, Q. D., Cotera, A., et al. 2011, MNRAS, 417, 114
- Dong et al. (2012) Dong, H., Wang, Q. D., & Morris, M. R. 2012, MNRAS, 425, 884
- Ekström et al. (2012) Ekström, S., Georgy, C., Eggenberger, P., et al. 2012, A&A, 537, A146
- Figer et al. (1999) Figer, D. F., McLean, I. S., & Morris, M. 1999, ApJ, 514, 202
- Figer et al. (2002) Figer, D. F., Najarro, F., Gilmore, D., et al. 2002, ApJ, 581, 258
- Figer et al. (2004) Figer, D. F., Rich, R. M., Kim, S. S., Morris, M., & Serabyn, E. 2004, ApJ, 601, 319
- Genzel et al. (2003) Genzel, R., Schödel, R., Ott, T., et al. 2003, ApJ, 594, 812
- Ghez et al. (2008) Ghez, A. M., Salim, S., Weinberg, N. N., et al. 2008, ApJ, 689, 1044
- Gillessen et al. (2009) Gillessen, S., Eisenhauer, F., Trippe, S., et al. 2009, ApJ, 692, 1075
- Glass et al. (2001) Glass, I. S., Matsumoto, S., Carter, B. S., & Sekiguchi, K. 2001, MNRAS, 321, 77
- Gvaramadze et al. (2010) Gvaramadze, V. V., Kroupa, P., & Pflamm-Altenburg, J. 2010, A&A, 519, A33
- Gvaramadze & Gualandris (2011) Gvaramadze, V. V., & Gualandris, A. 2011, MNRAS, 410, 304
- Habibi et al. (2014) Habibi, M., Stolte, A., & Harfst, S. 2014, arXiv:1403.2047
- Hanson et al. (2005) Hanson, M. M., Kudritzki, R.-P., Kenworthy, M. A., Puls, J., & Tokunaga, A. T. 2005, ApJS, 161, 154
- Hewett et al. (2006) Hewett, P. C., Warren, S. J., Leggett, S. K., & Hodgkin, S. T. 2006, MNRAS, 367, 454
- Homeier et al. (2003) Homeier, N. L., Blum, R. D., Pasquali, A., Conti, P. S., Damineli, A., 2003, A&A, 408, 153H
- Kim et al. (1999) Kim, S. S., Morris, M., & Lee, H. M. 1999, ApJ, 525, 228
- Kim et al. (2000) Kim, S. S., Figer, D. F., Lee, H. M., & Morris, M. 2000, ApJ, 545, 301
- Kim & Morris (2003) Kim, S. S., & Morris, M. 2003, ApJ, 597, 312
- Kruijssen et al. (2014) Kruijssen, J. M. D., Longmore, S. N., Elmegreen, B. G., et al. 2014, MNRAS, 440, 3370
- Lang et al. (1999) Lang, C. C., Figer, D. F., Goss, W. M., & Morris, M. 1999, AJ, 118, 2327
- Lang et al. (2001a) Lang, C. C., Goss, W. M., & Rodríguez, L. F. 2001, ApJ, 551, L143
- Lang et al. (2001b) Lang, C. C., Goss, W. M., & Morris, M. 2001, AJ, 121, 2681
- Lang et al. (2002) Lang, C. C., Goss, W. M., & Morris, M. 2002, AJ, 124, 2677
- Li, Wang & Wakker (2009) Li, Z., Wang, Q. D., & Wakker, B. P. 2009, MNRAS, 397, 148
- Liermann et al. (2009) Liermann, A., Hamann, W.-R., & Oskinova, L. M. 2009, A&A, 494, 1137
- Longmore et al. (2013) Longmore, S. N., Kruijssen, J. M. D., Bally, J., et al. 2013, MNRAS, 433, L15
- Longmore et al. (2013a) Longmore, S. N., Bally, J., Testi, L., et al. 2013, MNRAS, 429, 987
- Lucas et al. (2008) Lucas, P. W., Hoare, M. G., Longmore, A., et al. 2008, MNRAS, 391, 136
- Martins et al. (2008) Martins, F., Hillier, D. J., Paumard, T., Eisenhauer, F., Ott, T., Genzel, R., 2008, A&A, 478, 219M
- Markwardt (2009) Markwardt, C. B., 2009, ASPC, 411, 251M
- Mason et al. (1998) Mason, B. D., Gies, D. R., Hartkopf, W. I., et al. 1998, AJ, 115, 821
- Mauerhan et al. (2007) Mauerhan, J. C., Muno, M. P., Morris, M., 2007, ApJ, 662, 574M
- Mauerhan et al. (2009) Mauerhan, J. C., Muno, M. P., Morris, M. R., et al. 2009, ApJ, 703, 30
- Mauerhan et al. (2010a) Mauerhan, J. C., Muno, M. P., Morris, M. R., Stolovy, S. R., & Cotera, A. 2010a, ApJ, 710, 706
- Mauerhan et al. (2010b) Mauerhan, J. C., Morris, M. R., Cotera, A., Dong, H., Wang, Q. D., Stolovy, S. R., Lang, C., & Glass, I. S. 2010b, ApJ, 713, L33
- Mauerhan et al. (2010c) Mauerhan, J. C., Cotera, A., Dong, H., Morris, M. R., Wang, Q. D., Stolovy, S. R., & Lang, C. 2010c, ApJ, 725, 188
- Mikles et al. (2006) Mikles, V. J., Eikenberry, S. S., Muno, M. P., Bandyopadhyay, R. M., Patel, S., 2006, ApJ, 651, 408M
- Mills et al. (2011) Mills, E., Morris, M. R., Lang, C. C., et al. 2011, ApJ, 735, 84
- Morris & Yusef-Zadeh (1989) Morris, M., & Yusef-Zadeh, F. 1989, ApJ, 343, 703
- Morris & Serabyn (1996) Morris, M., & Serabyn, E. 1996, ARA&A, 34, 645
- Morris et al. (1996) Morris, P. W., Eenens, P. R. J., Hanson, M. M., Conti, P. S., & Blum, R. D. 1996, ApJ, 470, 597
- Molinari et al. (2011) Molinari, S., Bally, J., Noriega-Crespo, A., et al. 2011, ApJ, 735, L33
- Muno et al. (2006) Muno, M. P., Bower, G. C., Burgasser, A. J., Baganoff, F. K., Morris, M. R., Brandt, W. N., 2006, ApJ, 638, 183M
- Nagayama et al. (2003) Nagayama, T., Nagashima, C., Nakajima, Y., et al. 2003, Proc. SPIE, 4841, 459
- Nishiyama et al. (2006) Nishiyama, S., et al. 2006, ApJ, 638, 839
- Oskinova et al. (2013) Oskinova, L. M., Steinke, M., Hamann, W.-R., et al. 2013, MNRAS, 436, 3357
- Portegies Zwart et al. (2002) Portegies Zwart, S. F., Makino, J., McMillan, S. L. W., & Hut, P. 2002, ApJ, 565, 265
- Portegies Zwart et al. (2010) Portegies Zwart, S. F., McMillan, S. L. W., & Gieles, M. 2010, ARA&A, 48, 431
- Serabyn & Guesten (1987) Serabyn, E., & Guesten, R. 1987, A&A, 184, 133
- Stolte et al. (2014) Stolte, A., et al. 2014, submitted
- Stolovy et al. (2006) Stolovy, S., Ramirez, S., Arendt, R. G., et al. 2006, Journal of Physics Conference Series, 54, 176
- Trippe et al. (2006) Trippe, S., Martins, F., Ott, T., et al. 2006, A&A, 448, 305
- Tsuboi et al. (1999) Tsuboi, M., Handa, T., & Ukita, N. 1999, ApJS, 120, 1
- Tsuboi et al. (2011) Tsuboi, M., Tadaki, K.-I., Miyazaki, A., & Handa, T. 2011, PASJ, 63, 763
- Vacca et al. (2003) Vacca, W. D., Cushing, M. C., & Rayner, J. T. 2003, PASP, 115, 389
- Walborn (1971) Walborn, N. R. 1971, ApJS, 23, 257
- Wang et al. (2006) Wang, Q. D., Dong, H., & Lang, C. 2006, MNRAS, 371, 38
- Wang et al. (2010) Wang, Q. D., Dong, H., Cotera, A., et al. 2010, MNRAS, 402, 895
- Yusef-Zadeh et al. (2010) Yusef-Zadeh, F., Lacy, J. H., Wardle, M., et al. 2010, ApJ, 725, 1429
- Yusef-Zadeh et al. (2013) Yusef-Zadeh, F., Royster, M., Wardle, M., et al. 2013, ApJ, 767, L32
- Zhu et al. (2008) Zhu, Q.-F., Lacy, J. H., Jaffe, D. T., Richter, M. J., & Greathouse, T. K. 2008, ApJS, 177, 584
- Zinnecker & Yorke (2007) Zinnecker, H., & Yorke, H. W. 2007, ARA&A, 45, 481
Appendix A Binary Systems
In the main text, we have assumed that all of our program stars are not in binaries. Here we consider how the potential binarity may affect our results. Our velocity measurement of a star uses certain absorption/emission lines. Thus depending on whether one member or both contributes significantly to such lines, the velocity centroid and/or dispersion may differ from those intrinsic to the binary. In a binary, if only one member has certain line, the velocity dispersion of this line in the observed spectrum does not increase and the radial velocity derived from its centroid is not equal to that of the binary. On the other hand, if both members have the same line, the line in the observed spectrum will be broadened.
We may identify massive close binaries through their X-ray emission, which comes from the stellar winds of single massive stars through turbulence-induced micro shocks or wind collision zone between two massive stars. The difference is that the X-ray spectra of the former type is very soft (kT0.6 keV) and could be totally absorbed by strong foreground extinction toward the GC, while the later one has hard X-ray spectrum (kT1-2 keV). We can still detect the X-ray photons with energy larger than 4 keV from this type of binaries in the GC. In our sample, P35, P36 and P114 have X-ray counterparts (Mauerhan et al., 2009, 2010a; Dong et al., 2012). The X-ray flux of P35 and P114 is more than three times larger than that of P36 and are detected at energies above 4.7 keV, while P36 is not. Therefore, P35 and P114 are very likely to be massive close binaries (Mauerhan et al., 2010a). In contrast, the X-ray emission from P36 may arise from a single O star (Mauerhan et al., 2010c) or member stars of a binary with a relatively large separation. The other program stars do not have X-ray counterparts and are not considered to be variable stars by Glass et al. (2001), indicating that they may not be close massive binaries, but either single massive stars, massive binaries with a relative large separation or a binaries, which consist of one massive star and one low-mass star. In the latter two cases, the velocity derived from certain lines still represents the radial velocity of the system.
Table 3 shows that the velocity dispersion of P36 is similar to that of the four O If+ stars without X-ray counterparts. Therefore, P36 could be a single massive star, or with a much less massive companion. In contrast, the velocity dispersions () of P35 and P114 are over 100 km/s, which are larger than those of the other five O If+ stars (their mean and dispersion are 87 km/s and 9 km/s). Mason et al. (1998) find that a large fraction of spectroscopic binaries have mass ratios close to unity. If so, then the two stars in P35/P114 binary system may have similar masses and the radial velocities derived from the centroids of the absorption lines in P35 and P114 are equal to those of the binaries.


| Name | R.A. | Decl. | J | H | K | F190N | Age (Myr) | Mass () | Type | Reference | |
|---|---|---|---|---|---|---|---|---|---|---|---|
| P35 | 266.36926 | -28.93473 | 14.46(0.02) | 11.46(0.02) | 9.72(0.03) | 10.59(0.02) | 2.46 | 2.50.4 (2.30.4a) | 10217 (9817a) | O If+ | 1,2,4 |
| P98 | 266.42197 | -28.86325 | 14.80(0.02) | 11.60(0.01) | 9.86(0.01) | 10.61(0.02) | 2.54 | 2.50.4 | 10317 | O9-B0 If+ | 5 |
| P114 | 266.38658 | -28.93794 | 14.67(0.02) | 12.13(0.01) | 10.72(0.01) | 11.35(0.02) | 2.06 | 2.30.8 (2.81.0a) | 8321 (6019a) | O4-6 I | 3,4 |
| P100 | 266.42634 | -28.87976 | 14.70(0.02) | 11.67(0.01) | 10.11(0.03) | 10.86(0.02) | 2.35 | 3.21.6 | 7222 | O4-6 If+ | 5 |
| P107 | 266.41391 | -28.88919 | 14.68(0.02) | 11.75(0.01) | 10.20(0.01) | 10.90(0.02) | 2.30 | 2.80.6 | 8119 | O4-6 If+ | 1 |
| P36 | 266.38126 | -28.95466 | 15.13(0.02) | 12.68(0.01) | 11.37(0.02) | 11.84(0.02) | 1.96 | 3.21.3 | 5421 | O4-6 I | 3,5 |
| P97 | 266.44891 | -28.84692 | 15.23(0.02) | 12.26(0.01) | 10.54(0.01) | 11.53(0.02) | 2.44 | 2.20.4 | 10910 | O If+ | |
| P112 | 266.40753 | -28.95450 | 17.25(0.03) | 13.06(0.02) | 10.7(0.02) | 12.00(0.02) | 3.19 | 2.70.8 | 9320 | B[e] | 1 |
| Name | Instrument | Band | Observation Date | Exposure | Median S/N | (km/s) |
|---|---|---|---|---|---|---|
| P35 | GNIRS | H | 2012 Apr 24 (14:41:43.6) | 320 | 21 | -33.8 |
| P35 | GNIRS | K | 2012 Apr 24 (14:53:41.6) | 200 | 29 | -33.7 |
| P98 | GNIRS | H | 2012 Apr 27 (14:52:06.4) | 480 | 22 | -32.8 |
| P98 | GNIRS | K | 2012 Apr 27 (15:02:35.9) | 200 | 27 | -31.3 |
| P114 | GNIRS | H | 2012 Jun 6 (11:55:07.7) | 320 | 19 | -15.9 |
| P114 | GNIRS | K | 2012 Jun 6 (12:08:20.2) | 168 | 15 | -15.9 |
| P100 | NIFS | K | 2012 Jul 1 (08:24:49.6) | 320 | 116 | -3.9 |
| P107 | NIFS | K | 2012 Jul 1 (09:20:33.1) | 400 | 105 | -3.8 |
| P36 | NIFS | K | 2012 Jul 1 (09:46:38.1) | 1200 | 120 | -3.7 |
| P97 | NIFS | K | 2012 Jul 1 (10:59:01.1) | 600 | 100 | -3.6 |
| P112 | NIFS | K | 2012 Jul 2 (09:48:35.6) | 600 | 99 | -3.2 |
Note. — a LSR central velocity
| Name | Linesa | (km/s) | Vc(km/s) |
|---|---|---|---|
| P35 | He II 10-7, 12-7 | -0.735.32.6 | 122.61.2 |
| P98 | H I 10-4, 11-4, 12-4, He I 3Po-3D | -34.411.52.5 | 92.33.2 |
| P114 | He II 10-7, 12-7 | -22.856.42.6 | 153.91.5 |
| P112 | Fe II | 40.11.93.1 | 41.82.2 |
| P112 | H I 7-4 | 19.70.33.0 | 53.70.4 |
| P107 | He II 10-7, N III (2S-2Po) | 28.58.82.9 | 70.80.1 |
| P100 | He II 10-7, N III (2S-2Po) | 9.311.92.9 | 84.60.2 |
| P36 | He II 10-7, N III (2S-2Po) | 5.06.12.9 | 91.00.2 |
| P97 | He II 10-7, N III (2S-2Po) | 32.14.62.9 | 94.00.3 |
Note. — a lines used for the velocity measurements of individual stars. b the first term of the error measurements for the mean velocity of a star relative to the LSR () represents the statistic uncertainty from ‘MPFIT’, while the second term is the systematic one introduced by the arc calibration. c V is the velocity dispersion.
| Lines | (m) |
|---|---|
| H I 7-4 (Br) | 2.166120 |
| H I 10-4 | 1.736685 |
| H I 11-4 | 1.681111 |
| H I 12-4 | 1.641167 |
| He I (3Po-3D) | 1.700704 |
| He II (10-7) | 2.189113 |
| He II (12-7) | 1.692299 |
| N III (2S-2Po) | 2.247100/2.251300 |
| Fe II (z4Fo-c4F) | 2.089380 |
Note. — The wavelengths are from http://www.pa.uky.edu/peter/atomic/index.html
| Name | Distancea | (km/s) | Vc(km/s) | (km/s) |
|---|---|---|---|---|
| P35 | -2.85″ | -63.50.42.6 | 22.00.2 | -62.8 |
| P35 | 20.85″ | -78.31.82.6 | 23.62.4 | -77.6 |
| P35 | 29.55″ | -39.10.62.6 | 12.44.8 | -38.4 |
| P35 | 43.35″ | -37.62.32.6 | 22.02.8 | -36.9 |
| P98 | 11.7″ | -70.10.72.6 | 14.20.5 | -35.7 |
| P98 | 17.7″ | -59.21.12.6 | 17.00.9 | -24.8 |
| P98 | 29.7″ | -47.60.92.6 | 16.01.0 | -13.2 |
| P114 | -6.6″ | -39.60.72.6 | 22.80.6 | -16.8 |
| P114 | -2.7″ | -72.71.32.6 | 18.00.8 | -49.9 |
| P114 | 27.75″ | -52.00.92.6 | 23.11.1 | -29.2 |
| P112 | 1″ | 6.50.43 | 25.10.3 | -33.6 |
| Name | (km/s) | (km/s) | (km/s) |
|---|---|---|---|
| P35 | 6.5+/-2.4 | 98.7+/-38.7 | 98.9+/-38.8 |
| P98 | 2.5+/-0.9 | 132.4+/-16.1 | 132.4+/-16.2 |
| P114 | 6.2+/-2.3 | 120.8+/-59.5 | 121.0+/-59.6 |
| P100 | 3.0+/-1.1 | 88.5+/-21.4 | 88.6+/-21.5 |
| P107 | 3.7+/-1.4 | 69.2+/-16.8 | 69.3+/-16.9 |
| P36 | 7.0+/-2.6 | 93.0+/-8.5 | 93.3+/-8.9 |
| P97 | 1.2+/-0.4 | 64.1+/-12.0 | 64.1+/-12.0 |
| P112 | 6.6+/-2.5 | 57.9+/-8.9 | 58.3+/-9.3 |
Note. — a: the proper motion. We assume that these eight stars escaped from the Arches cluster 3 Myr ago and thus determine the proper motion from their projected distance to the Arches cluster (see §4.3.1). b: the radial velocity relative to the Arches cluster. c: the total velocity relative to the Arches cluster, the combination in quadrature of the proper motion and the radial velocity. The total velocities are larger than predicted by the tidal stripping from the simulation in Habibi et al. (2014), but still within the velocity range predicted by the simulations of three-body interactions by Gvaramadze & Gualandris (2011). It means that these stars could be previous members of the Arches cluster, but left due to the combined effects of three-body interaction and tidal stripping.