Weak and Compact Radio Emission in Early Massive Star Formation Regions: An Ionized Jet Toward G11.110.12P1
Abstract
We report 1.3 cm and cm continuum observations toward the massive proto-stellar candidate G11.110.12P1 using the Karl G. Jansky Very Large Array (VLA). We detect a string of four unresolved radio continuum sources coincident with the mid-IR source in G11P1. The continuum sources have positive spectral indices consistent with a thermal (free-free) ionized jet. The most likely origin of the ionized gas are shocks due to the interaction of a stellar wind with the surrounding high-density material. We also present NIR United Kingdom Infrared Telescope (UKIRT) archival data which show an extended structure detected only at K-band (m), which is oriented perpendicular to the jet, and that may be scattered light from a circumstellar disk around the massive protostar. Our observations plus the UKIRT archival data thus provide new evidence that a disk/jet system is present in the massive protostellar candidate located in the G11.110.12P1 core.
Subject headings:
ISM: individual (G11.110.12P1) – ISM: jets – stars: formation1. Introduction
The role of jets in massive star formation is not yet fully understood. Unlike their low-mass counterparts, the current sample of known massive young stellar objects (MYSOs) associated with collimated jets is very small (see Guzmán et al. 2010 for a summary). MYSOs are difficult to detect since they are located at large distances, with a tendency to form in complicated cluster environments, and evolve on a much shorter evolutionary timescale compared to low-mass stars. It is important, therefore, to identify more candidates of massive stars in early evolutionary stages to ascertain whether jets are present, and if so, to study their role during the formation process. Infrared dark clouds (IRDCs) are potentially a good place to find molecular cores which might harbor the earliest stages of massive star formation (e.g. Carey et al. 2000). IRDCs are cold (T 25 K), high column density ( 1023 1025 cm-2) molecular condensations, with high gas densities ( cm-3) and a large amount of extinction (A 200 mag, Butler et al. 2014), which causes them to appear as dark silhouettes against the Galactic mid-infrared background (Carey et al., 1998; Menten et al., 2005; Rathborne et al., 2006).
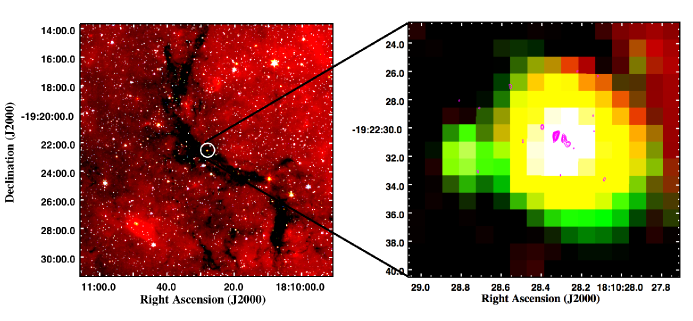
G11.110.12P1 (hereafter G11P1) is a compact dust continuum source located in the filamentary IRDC G11.110.12 at a kinematic distance of 3.6 kpc (Carey et al. 1998, 2000; Johnstone et al. 2003). Figure 1 shows a Spitzer IRAC GLIMPSE three-color image of the G11.110.12 IRDC. The right panel shows the G11P1 core, along with our VLA 6 cm image (see below). Several indicators show that G11P1 is an active star forming region: i) compact sub-mm dust continuum (450 m and 850 m; Carey et al. 2000), ii) point-like mid-IR emission (8 m, Carey et al. 2000; 24 m, Gómez et al. 2011), iii) H2O and class II CH3OH maser emission (Pillai et al. 2006, hereafter P06), and iv) outflow indicators such as 4.5 m excess emission (Cyganowski et al., 2008).
The luminosity of G11P1 estimated from a spectral energy distribution (SED) model is 1200 L⊙ (P06). The SED peaks in the far-IR but also has a mid-IR component that P06 attribute to an accretion disk. Henning et al. (2010) observed G11P1 using Herschel PACS at 70 m, 100 m and 160 m. Their SED model suggests a dust temperature of 24 K and a core mass of 240 M⊙, corresponding to a luminosity of 1346 L⊙, the largest of the sources in the G11.110.12 IRDC. G11P1 has also been detected in the dense gas tracers NH3 (P06), C34S as well as in several thermally excited (i.e. non-maser) transitions of CH3OH (Gómez et al., 2011).
P06 detected a strong (22 Jy for the brightest peak) class II methanol maser at 6.7 GHz in G11P1 using the Australian Telescope Compact Array (ATCA). They reported a velocity structure with a linear trend which they interpreted as a disk around a highly embedded massive protostar. In addition, a 2MASS NIR emission structure detected 2′′ from the maser supports the circumstellar disk scenario (P06; more discussion in this regard is given in §4.2). P06 also detected a weak (0.3 Jy) water maser at 22.2 GHz using the VLA in the D configuration. In this case the velocity structure of the maser spot is not spatially resolved; the water maser is slightly offset ( 1′′) from the methanol maser position. Both maser species are indicators of the earliest stages of massive star formation, and in particular the 6.7 GHz CH3OH maser has only been found in regions were massive stars form (Minier et al., 2003; Breen et al., 2013).
In a recent paper Wang et al. (2014) presented SMA and VLA continuum and molecular line observations toward G, which showed that the P1 core contains 6 condensations with masses in excess of the thermal Jeans masses. They also reported the discovery of an East-West outflow, which is most clearly seen in the SiO(5–4) line.
None of the previous observations were sufficiently sensitive to detect the cm continuum towards G11P1. Our new high sensitivity VLA observations presented in this paper show the presence of cm continuum sources associated with the mid-IR point source. All of the features discussed above make G11P1 a strong candidate for an embedded massive young stellar object (MYSO) in an early stage of formation, and likely hosting an outflow/disk system.
In this paper, we present sensitive sub-arcsecond resolution continuum observations of G11P1 at 6 cm and 1.3 cm using the Karl G. Jansky Very Large Array (VLA)111The National Radio Astronomy Observatory is a facility of the National Science Foundation operated under cooperative agreement by Associated Universities, Inc.. These observations were made as part of a larger survey to search for weak, compact radio emission in young, high-mass star forming regions. The results of the survey will be presented elsewhere (Rosero et al. in preparation); here we present the results for G11P1. We describe our VLA observations and data reduction in § 2, in § 3 we present our observational results of the radio continuum data, in § 4 we present an analysis of our cm detections and of the NIR emission, in § 5 we discuss the nature of the massive protostar in G11P1, and in § 6 we summarize our findings.
2. Observations and Data Reduction
VLA continuum observations (project code 10B-124) at 6 and 1.3 cm were obtained for the core region G11P1. The pointing center was RA(J2000)=, Dec(J2000). The observations where made in different configurations — A-configuration for 6 cm and B-configuration for 1.3 cm — to obtain similar angular resolution at the different frequencies. Following is a detailed description of the observations.
2.1. 6 cm Observations
The observations were made in the A-configuration on
2011 July 27 covering two 1 GHz wide basebands
centered at 4.9 and 7.4 GHz, respectively.
Each band was divided into 8128 MHz
spectral windows (SPWs).
Therefore, the data were recorded in 16 unique SPWs, each of these
with 64 channels (resolution MHz), i.e. a total bandwidth of 2048 MHz.
The SPWs were configured to avoid the strong methanol maser emission at 6.7 GHz.
For flux calibration we observed 3C286 and
the phase calibrator was J18202528.
Alternating observations between G11P1 and the phase calibrator
were made with on-source times of 900 s and 180 s, respectively.
The total observing time was 1 hr, of which 40 minutes were
on-source. All 27 antennas were available after flagging.
The data were processed using NRAO’s Common Astronomy Software Applications (CASA222http://casa.nrao.edu). Eight channels at the edges of each baseband were flagged due to substantial roll-off (and therefore loss of sensitivity). In addition, a large amount of radio frequency interference (RFI) was flagged throughout the observing band (approximately 20 of the total data). The bandpass solution was formed using 3C286. This solution was applied when solving for the complex gains. The flux density for 3C286 was adopted from the Perley–Butler 2010 flux calibration standards, and the derived flux density for the phase calibrator at 6.086 GHz was 1.026 0.002 Jy with spectral index of 0.29. The gain solutions were then applied to the target source G11P1. The images were made using Briggs weighting. Owing to the low S/N of the detections ( 20), no self-calibration was attempted.
As a consistency check, and to ensure the absence of line contamination or RFI, we imaged and
inspected each SPW separately. Each 1 GHz baseband was imaged separately to provide a better estimate
of spectral index. Finally, a combined image was made, including all data from both basebands.
The synthesized
beam of this combined image is ,
position angle PA , and rms noise Jy beam-1.
2.2. 1.3 cm Observations
The observations were made in the B-configuration on
2011 March 20 covering two 1 GHz wide bands
centered at 21 and 25.5 GHz.
Each band was divided into 8128 MHz
SPWs. The SPWs were configured to avoid the strong water maser emission at 22 GHz.
The same number of SPWs and
channels were used as in the 6 cm observations.
For flux calibration we observed 3C286 and
the phase calibrator was J18202528.
Alternating observations between the target and the phase calibrator
source were made with times of 270 and 90 s, respectively.
The total on-source time was 42 minutes. After flagging,
only 23 antennas were available.
Pointing corrections were obtained separately and applied during the observations.
The data reduction was done in the same fashion as for the 6 cm observations. The flux density for 3C286 was adopted from the Perley–Butler 2010 flux calibration standards, and the derived flux density for the phase calibrator at 23.186 GHz was 0.91 0.01 Jy with spectral index of 0.57. The images were made using natural weighting. Opacity corrections were applied during calibration.
The absence of line contamination and RFI was confirmed by imaging each SPW separately.
As at 6 cm, we imaged each baseband individually (for spectral index) and together
(for morphology and improved S/N).
The synthesized
beam of the combined map is ,
PA , and rms noise Jy beam-1.
3. Results
We detected radio continuum emission at all observed frequencies. The emission is clearly associated
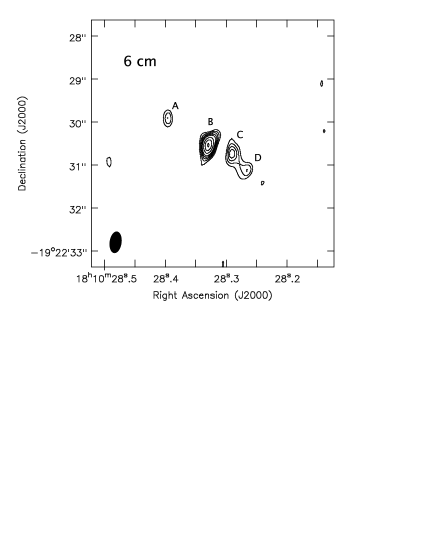
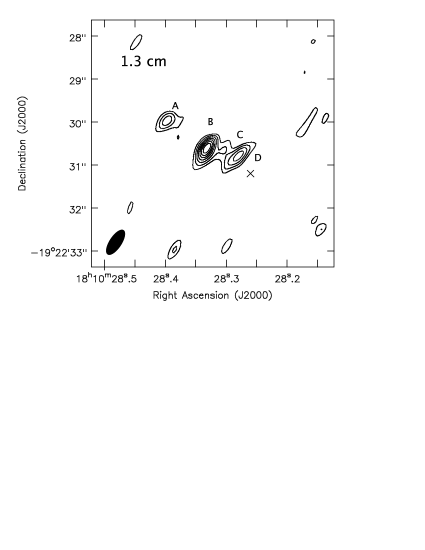
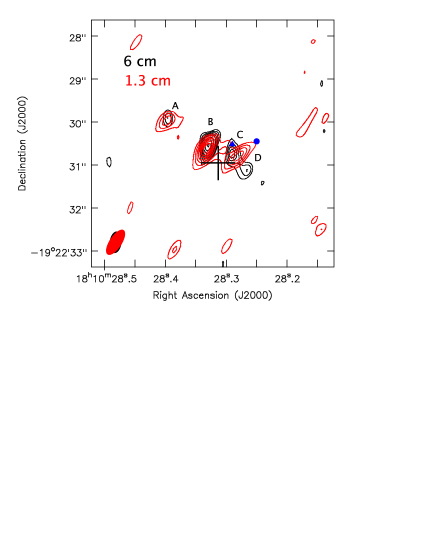
with G11P1 (see Figure 1, right panel). In Figure 2 we show contour plots of G11P1 at 6 and 1.3 cm.
Four and three components are detected in the 6 cm and
1.3 cm maps, respectively.
As indicated in figure 2, we refer to these components, from
east to west, as A, B (bright central source), C, and D.
The components lie in a linear structure with a PA
of . The outermost sources
(A and D) are separated by an angular distance of
(9000 AU at the distance of 3.6 kpc). Component D is not detected at 1.3 cm.
Table 1 lists the peak positions and flux densities of components A – D, as determined by gaussian fits using the IMFIT CASA routine. The astrometric accuracy of the VLA is better than 0.1′′. Components A and B have consistent peak positions, but component C appears slightly offset between and cm. Such an offset can occur if the continuum optical depth in the source varies strongly between the two observing frequencies; however since the offset is smaller than our resolution element, for simplicity we will treat the two emission peaks as a single source, component C. The radio components are mostly unresolved, implying upper limits on the size of the emitting regions of about AU. This small size of the emitting regions is also reflected in the low measured brightness temperatures within a synthesized beam, which are K for all components.
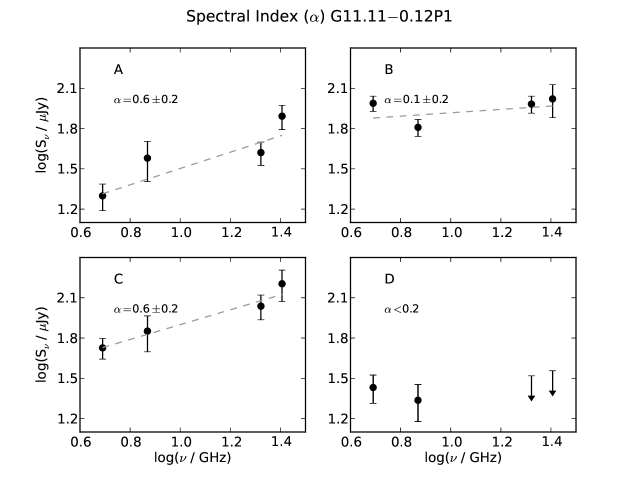
Figure 3 shows the fluxes and power law fits of the form , where is the spectral index and is the frequency for each detected component in G11P1. Components A and C have a rising spectral index indicative of thermal emission from ionized gas from a stratified medium, and component B has a flat behavior which is consistent with emission from optically thin ionized gas. For component D the 1.3 cm detection limits together with the cm data are consistent with a flat spectrum, but a falling spectral index, as expected for non-thermal emission, cannot be excluded.
Our measured flux densities are consistent with the non-detection at GHz by P06. Also, extrapolating our flux densities to 3 mm with a spectral index of 0.6 results in values far below the 12 mJy reported by P06, thus confirming their result that the 3 mm emission is likely due to dust.
| Component | RA | Dec | Sν | Spectral | |
|---|---|---|---|---|---|
| G11.11-P1 | (GHz) | (J2000) | (J2000) | (Jy) | index |
| A | 4.9 | 18 10 28.39 | 19 22 29.8 | 20.0(4.0) | 0.6(0.2) |
| 7.4 | 18 10 28.40 | 19 22 30.1 | 38.0(12.0) | ||
| 20.9 | 18 10 28.40 | 19 22 29.9 | 41.8(7.1) | ||
| 25.5 | 18 10 28.40 | 19 22 30.1 | 78.0(14.0) | ||
| B | 4.9 | 18 10 28.33 | 19 22 30.5 | 97.3(8.1) | 0.1(0.2) |
| 7.4 | 18 10 28.33 | 19 22 30.5 | 64.4(6.7) | ||
| 20.9 | 18 10 28.33 | 19 22 30.7 | 96.0(10.0) | ||
| 25.5 | 18 10 28.34 | 19 22 30.7 | 105.0(27.0) | ||
| C | 4.9 | 18 10 28.29 | 19 22 30.7 | 53.3(7.7)bbReported fluxes for component C contain a contribution from the extended weak component connecting components B and C. | 0.6(0.2) |
| 7.4 | 18 10 28.29 | 19 22 30.8 | 71.0(20.0)bbReported fluxes for component C contain a contribution from the extended weak component connecting components B and C. | ||
| 20.9 | 18 10 28.29 | 19 22 30.9 | 109.0(20.0)bbReported fluxes for component C contain a contribution from the extended weak component connecting components B and C. | ||
| 25.5 | 18 10 28.28 | 19 22 30.7 | 160.0(39.0)bbReported fluxes for component C contain a contribution from the extended weak component connecting components B and C. | ||
| D | 4.9 | 18 10 28.27 | 19 22 31.1 | 27.0(5.8) | 0.2 |
| 7.4 | 18 10 28.26 | 19 22 31.2 | 21.7(6.3) | ||
| 20.9 | |||||
| 25.5 |
Note. — 1 uncertainties are reported.
4. Analysis
The above results clearly show that a string of radio sources is associated with the massive proto-stellar object in G11P1. In this section we will discuss the physical nature of the emission, and present archival infrared data.
4.1. Radio Continuum
Components B and C appear connected at cm, however this bridge of emission is not detected at cm. For our analysis we will not consider this bridging structure, thus component B and C are treated as individual sources. First, we might consider that radio components A to D are manifestations of individual massive stars which ionize their surroundings, i.e. ultra or hyper compact HII regions (UCHII or HCHII). Due to the much improved continuum sensitivity of the VLA, it should be now possible to explore photo-ionized regions around stars of spectral type later than B2 throughout the Galaxy. The orientation of the 4 putative stars is approximately along the dark filament as might be expected for star formation in this environment. A similar alignment of proto-stellar objects along the dark cloud has for instance been observed in the region G28.34+0.06 (e.g. Wang et al. 2011). However, in the latter case the sources have separations of the order of pc, whereas in G11P1 there are 4 sources within a distance of AU (0.04 pc at the distance of G11P1). Several massive objects can in fact be found at such small and even smaller separation in young clusters (e.g. Orion Trapezium; NGC 2071: Carrasco-González et al. 2012). We will thus first consider the formation of 4 massive stars aligned along the filament.
An argument against the hypothesis that the 4 radio sources are ionized by 4 individual stars can be made if we consider the implied luminosities from 4 individual stars. Assuming optically thin free-free emission and neglecting absorption of ionizing photons within the UC/HCHII regions we calculated the Lyman continuum luminosity for each component using the formulas given in Kurtz et al. (1994). Using the tabulation in Crowther (2005), the corresponding spectral types are approximately B2/B3 for each radio component. Due to the assumptions made in the calculation, these values are lower limits. Such stars have a luminosity of L⊙, hence for four such stars we would predict a luminosity of the region of more than L⊙, which is much larger than the measured luminosity of the region of about 1200 L⊙ (P06) or 1346 L⊙ (Henning et al., 2010). Therefore the hypothesis of 4 individual UC/HCHII regions can be excluded.
Next, we can ask whether external photoionization can explain the 4 radio sources. In this scenario 4 clumps are externally ionized by an unseen massive protostar. The position of the putative accretion disk traced by GHz methanol masers (P06) lies somewhat offset from the line defined by the 4 radio sources (see Figure 4). We calculated the necessary flux of ionizing photons correcting for the ratio of solid angle of the radio sources as seen from the position of the methanol maser source. For the calculation we assumed source sizes of half of the synthesized beam, likely an overestimate resulting in a lower limit on the corrected ionizing flux. To externally ionize the four components we find that a single star of spectral type B1 or earlier would be required. Such stars have luminosities of L⊙, which is also in conflict with the measured luminosity of the region. A calculation placing the star at the peak position of radio continuum source B gives similar results. We conclude that direct photoionization of the cm components from a single massive proto-stellar objects is unlikely.
We suggest therefore that the radio continuum emission detected towards G11P1 is produced by shock ionization. This could be the result of either accretion shocks caused by supersonic infall onto an accretion disk, or shocks caused by the interaction of a stellar wind with surrounding molecular core matter. The expected radio continuum emission from accretion shocks has been calculated by Neufeld & Hollenbach (1996); at the distance of G11P1, and assuming a mass of M⊙ (P06), their model predicts a GHz flux density of below Jy for an accretion rate of Myr-1. Thus, unless one wants to accept an unusually large accretion rate, the accretion shock scenario seems to be ruled out. On the other hand, a scenario where a neutral wind driven by the embedded massive protostar shocks against surrounding high-density matter and produces free-free emission (Curiel et al. 1987 and references therein), appears more likely.
Before discussing this scenario in more detail below, we note that the above luminosity argument could also be made consistent with the data if we assume that only one of the four radio sources is a UC/HCHII region and the other sources are shock-ionized. The spectral behavior of component B is close to that of an optically thin HII region, hence we have considered this possibility as well. P06 and Gómez et al. (2011) have estimated a molecular hydrogen density of cm-3, and a temperature of K for the G11P1 central core. Including also the turbulent pressure of the molecular gas given by the FWHM of the hot NH3 component (km s-1), we have calculated the size of an UC/HCHII region around a B3 ZAMS star given by the condition of pressure equilibrium between molecular and ionized gas using the formulas of Xie et al. (1996). We obtain a size of about AU, which is consistent with the region being unresolved in our observations. Thus, our data do not exclude a UC/HCHII region interpretation for component B (only), plus cm emission from 3 shocked regions. These 3 continuum sources could then be either separate jets from individual proto-stars which are unresolved, or several shocks from a single jet, likely caused by episodic matter ejection. We also note that if one adopts the empirical correlation between radio and bolometric luminosity of Shirley et al. (2007) an interpretation of the radio sources as four independent lower mass stars is not excluded by the measured luminosity.
Because of the alignment and orientation of the 4 radio sources with respect to several disk tracers (see below) we will favor shock ionization from a single jet as the likely physical scenario for the cm emission. In this picture a massive star in or near component B drives a bipolar jet which causes the observed radio emission when the ejecta interact with the surrounding core matter. Assuming then that the radio emission detected at G11P1 originates from a jet, we use the standard model of Reynolds (1986) for free-free emission of a collimated, ionized flow or wind, with constant velocity, temperature and ionization fraction. Reynolds’ model suggests that the observed flux density and the angular size depend on frequency as and , where depends on the geometry of the jet and is the power-law index that describes the dependence of the jet half-width on the distance from the jet origin (Reynolds, 1986). For the G11P1 component B, the observed dependence of the flux density with frequency gives a value of , which within the uncertainties, is in agreement with a collimated ionized jet. The angular size dependence with frequency cannot be determined for any of the components since they are all unresolved with our angular resolution. Using equation 19 from Reynolds (1986) we can make a rough estimate of the mass-loss rate () of the G11P1 B-component, assuming parameter values that are typical of jets associated with luminous objects (= 700 km s-1; rad; T K, , ; e.g. Rodriguez et al. 1994). The estimated mass loss rate of G11P1 component B observed at 25.5 GHz is M⊙ yr-1. We can get an estimated value of the momentum rate () by multiplying the mass loss rate by the typical velocity of the wind in massive stars, which gives M⊙ yr-1 km s-1. On the other hand, if we assume that component B is a jet produced by shock induced ionization (e.g. Curiel et al., 1987; Johnston et al., 2013) with a shock efficiency () 0.1 and an optical depth of the emission at 25.5 GHz of 0.02, the estimated momentum rate is M⊙ yr-1 km s-1. The fact that estimated from the shock ionization mechanism is times bigger than the one predicted by Reynolds’ model suggest that the 25.5 GHz emission is not completely due to shocks in the jet. However, the momentum rate of the jet could ionize itself if the jet velocity is 1600 km s-1 or the shock efficiency is 0.4.
.
4.2. Near-IR Sources
P06 proposed from their study of the spectral energy distribution of G11P1 the presence of an accretion disk around the central massive young star. From 2MASS data (resolution 2′′), P06 detected three faint sources in the J and H bands with only one of those sources detected at K-band. In their analysis they found that these sources cannot be explained by reddening and they proposed that those NIR detections are knots of scattered light that escape from the star into an optically thin cone above a circumstellar disk.
We retrieved data from the UKIRT Infrared Deep Sky Survey (UKIDSS) GPS and compared them with the corresponding 2MASS data analyzed and discussed by P06. The UKIDSS project is defined in Lawrence et al. (2007). UKIDSS uses the UKIRT Wide Field Camera (WFCAM; Casali et al. (2007)). The photometric system is described in Hewett et al. (2006), and the calibration is described in Hodgkin et al. (2009). The pipeline processing and science archive are described in Irwin et al. (2009) and Hambly et al. (2008). The UKIDSS data are three magnitudes deeper and have higher angular resolution () compared to 2MASS data. The astrometric accuracy of the UKIDSS data is about 50 mas.
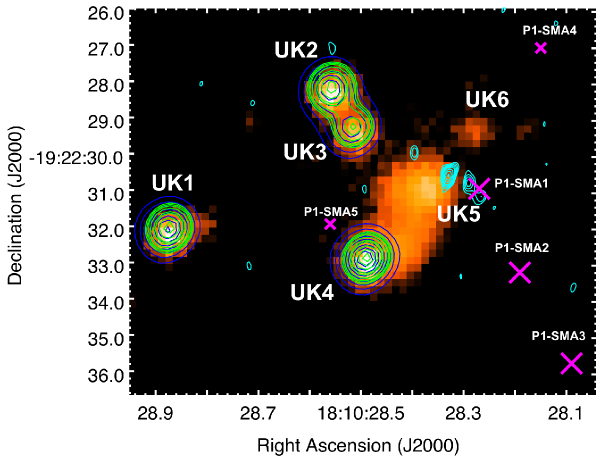
We found a total of six sources associated with the G11P1 core, two of which are only seen at K-band (see Figure 5).
The sources are labeled as UK1 to UK6.
Based on their positions in a JHK color-color diagram we found that UK1 and UK2 can be explained as main sequence stars with a visual extinction mag. Thus, we suggest that these two components are foreground stars.
Not much can be said about UK3 since its H-band magnitude is not available.
On the other hand, the position of UK4 in the JHK color-color diagram indicates intrinsic IR excess emission and therefore we suggest that UK4 is likely a young star. Thus,
the 2MASS sources from P06 associated with UK1, UK2 and UK4 do not appear to be knots of scattered light, but appear to be of stellar nature. On the other hand, components UK5 and UK6 are only detected at K-band which indicates very high extinction. UK5 is an extended source oriented in the direction toward UK6, along
a PA of . These two sources are separated by an angular distance
of (7900 AU at the distance of 3.6 kpc).
Figure 5 shows that these 2 components are oriented roughly perpendicular to the axis defined by the radio continuum components
which we believe is caused by a bipolar jet. We also note that the Mid-IR Spitzer IRAC data are clearly offset from the NIR sources and peak closer to the radio data.
Considering the excellent astrometrical agreement between Spitzer IRAC and UKIDSS data, we are convinced that the offset is real, which would speak against a YSO nature of
UK5 and UK6, but is consistent with their K-band emission coming from scattered light from an accretion disk.
Therefore, while different in detail, the higher quality UKIDSS data are
supportive of the interpretation of P06 for the presence of a disk-like structure in the G11P1 core.
Another interpretation for UK5 and UK6 is that they are scattered light at the inner wall cavity produced by the molecular outflow. Figure 5 shows that the outflow cavity appears brighter to the east which is consistent with the blueshifted SiO outflow from Wang et al. 2014. In this picture, the redshifted side at NIR (i.e. UK6) is fainter due to dependence of cavity brightness with inclination (e.g. Tobin et al., 2008).
5. Discussion
Several authors (e.g. P06, Gómez et al. 2011) have interpreted the G11P1 central object as a massive protostar in a very early stage of evolution. The detection of a mid-IR point-source and the measured luminosity of around L⊙ clearly indicate the presence of a stellar object, whose energy output is comparable to an M⊙ ZAMS star (P06). The presence of the GHz CH3OH and GHz H2O masers are strong indicators of massive star formation, and the presence of a massive core (e.g. 240 M⊙, Henning et al. 2010) allows in principle to accrete more mass. The relative youth of this system is demonstrated by the fact that most of the molecular gas in the core appears to be quite cold: P06 report a temperature of only K for the overall molecular core based on NH3 observations. Whether or not the central object in G11P1 is in fact accumulating more mass and will grow to a massive star can in principle be observationally decided by the detection of outflow activity, because flows and jets are thought to be intimately linked to mass accretion. The molecular line observations of Gómez et al. 2011 resulted in the detection of non-gaussian line wings, and a possible outflow traced by the CH3OH(2) lines. This was recently confirmed by Wang et al. (2014) who found an East–West outflow in the SiO(5–4) line. In the previous section we have argued that the radio continuum emission from G11P1 is best explained by an ionized jet, and we hence add to the picture an outflow tracer very near the protostar.
How do the results described in this paper fit into the picture of a massive protostar with a disk/jet system as defined by previous observations? We first note that the GHz CH3OH maser is located not on the axis defined by the radio continuum sources (see Fig. 4), but is offset by about . According to P06 the astrometrical uncertainty of their measurement is of that order, so that the maser could in fact be located nearer to the jet axis as expected if the maser spots arise in an accretion disk. Fitting individual gaussians to different channels within the maser line P06 find a linear structure of length oriented approximately North–South. Such linear structures have often been observed for the GHz CH3OH maser line (e.g. Minier et al. (2000)), however the interpretation as disk tracer is not unique, as similar structures are expected in shock fronts associated with outflows. In fact, in the scenario where the NIR knots (UK5 and UK6) are scattered light at the outflow cavities, a linearly distributed maser emission might be then tracing the walls of the outflow cavities (e.g. De Buizer & Minier, 2005; Torrelles et al., 2011). We also note that there is a maser listed in the GHz methanol multi-beam maser catalogue of Green et al. (2010) which position is different by more than from the position given in P06. To clarify these issues, higher angular resolution observations of this maser with high astrometric precision are needed.
As mentioned above, the CH3OH and SiO line observations of Gómez et al. (2011) and Wang et al. (2014), respectively, suggest a molecular flow from the massive star in G11P1 along the East–West direction, and this orientation is consistent with the North-South orientation of the CH3OH maser disk postulated by P06. The outflow direction defined by the cm continuum sources is closer to NE-SW, and in this case we also have a perpendicular component tracing a possible disk, namely the NIR emission discussed in the previous section. Additional evidence for this disk component comes from the recent SMA and VLA observations of Wang et al. (2014). Their Figure 11 shows that the m dust emission is oriented nearly perpendicular to the ionized jet, and the NH3(2,2) line shows a clear velocity gradient along that same direction. Both dust emission and NH3(2,2) are more likely to trace dense matter present in a disk/torus system than a molecular outflow.
This apparent contradiction of the different flow orientations can then be explained in at least two ways. First, it is possible that a second protostar is responsible for the East-West outflow, whereas the flow associated with the radio jet has not been detected. Second, a change of alignment of flow axis on different length scales is a known phenomenon, e.g. in the case of the massive protostar in IRAS 201264104, the jet axis changes from a NW–SE orientation on arc-second scales to a North–South direction when probed by CO on arc-minutes scales (Shepherd et al., 2000). Another well known case where a misalignment of outflow axis is observed is the protostar NGC 7538 IRS1; Kraus et al. (2006) describe a number of possible disk precession mechanisms which could explain such changes in the flow axis. If this is the the case for the G11P1 protostar, the outflow angle would have to change by from the scale of the ionized jet, to the scale where the molecular flows have been detected in SiO and CH3OH.
Previous studies have shown that all high-mass YSOs associated with ionized jets are also associated with large scale, high velocity collimated molecular outflows, and that there exists a correlation between the radio luminosity, and the momentum rate of the molecular outflows (e.g. Anglada et al. 1992). The GHz radio luminosity of G11P1 is relatively large with Sνd mJy kpc2, near the lower range of what is observed for jets from massive protostars (Rodríguez et al., 2008), but much larger than radio luminosities from low mass stars. In section 4.1 we have estimated mass loss and momentum rates for the jet in G11P1. The resulting values are lower than what is found for jets from massive protostars like IRAS 165474247 (Garay et al., 2003), or IRAS 165623959 (Guzmán et al., 2010), but there are still many uncertain assumptions made in the estimate of these quantities. Furthermore, these sources are much more luminous than G11P1, and we can speculate that the lower values for mass loss and momentum rates are due to the earlier evolutionary state of the protostar in G11P1. If we assume that the molecular flow observed by Wang et al. (2014) is related to the radio luminosity, we find that the jet/flow data of G11P1 fall close to the radio luminosity/momentum rate relation of Anglada et al. (1992).
6. Conclusion
Previous observations have established the stellar source in the G11P1 core as a new candidate for a massive protostar in a very early evolutionary stage. The upgraded VLA provides the high sensitivity to detect these types of very early massive protostars in the radio continuum down to a rms of few Jy/beam. Our VLA continuum observations reveal four weak, and unresolved sources, centered on the mid-IR source, which are aligned in a NE-SW direction. The spectral indices determined for each component are consistent with partially optically thick () free-free emission from ionized gas arising from a thermal jet (Anglada et al., 1998), where the mechanism of ionization is most likely by shock ionization (Curiel et al., 1987, 1989). We also present archival NIR data from UKIRT (resolution of ). These data reveal an extended structure only visible in K-band, which is oriented perpendicular to the orientation of the radio continuum data. This structure can be interpreted as scattered light from an accretion disk. Our observations thus provide new evidence that a disk/jet system is present in the protostar in G11P1.
References
- Anglada et al. (1992) Anglada, G., Rodriguez, L. F., Canto, J., Estalella, R., & Torrelles, J. M. 1992, ApJ, 395, 494
- Anglada et al. (1998) Anglada, G., Villuendas, E., Estalella, R., et al. 1998, AJ, 116, 2953
- Breen et al. (2013) Breen, S. L., Ellingsen, S. P., Contreras, Y., et al. 2013, MNRAS, 435, 524
- Butler et al. (2014) Butler, M. J., Tan, J. C., & Kainulainen, J. 2014, ApJ, 782, L30
- Carey et al. (1998) Carey, S. J., Clark, F. O., Egan, M. P., et al. 1998, ApJ, 508, 721
- Carey et al. (2000) Carey, S. J., Feldman, P. A., Redman, R. O., et al. 2000, ApJ, 543, L157
- Carrasco-González et al. (2012) Carrasco-González, C., Osorio, M., Anglada, G., et al. 2012, ApJ, 746, 71
- Casali et al. (2007) Casali, M., Adamson, A., Alves de Oliveira, C., et al. 2007, A&A, 467, 777
- Crowther (2005) Crowther, P. A. 2005, in IAU Symposium, Vol. 227, Massive Star Birth: A Crossroads of Astrophysics, ed. R. Cesaroni, M. Felli, E. Churchwell, & M. Walmsley, 389–396
- Curiel et al. (1987) Curiel, S., Canto, J., & Rodriguez, L. F. 1987, Revista Mexicana de Astronomia y Astrofisica, 14, 595
- Curiel et al. (1989) Curiel, S., Rodriguez, L. F., Bohigas, J., et al. 1989, Astrophysical Letters and Communications, 27, 299
- Cyganowski et al. (2008) Cyganowski, C. J., Whitney, B. A., Holden, E., et al. 2008, AJ, 136, 2391
- De Buizer & Minier (2005) De Buizer, J. M., & Minier, V. 2005, ApJ, 628, L151
- Garay et al. (2003) Garay, G., Brooks, K. J., Mardones, D., & Norris, R. P. 2003, ApJ, 587, 739
- Gómez et al. (2011) Gómez, L., Wyrowski, F., Pillai, T., Leurini, S., & Menten, K. M. 2011, A&A, 529, A161
- Green et al. (2010) Green, J. A., Caswell, J. L., Fuller, G. A., et al. 2010, MNRAS, 409, 913
- Guzmán et al. (2010) Guzmán, A. E., Garay, G., & Brooks, K. J. 2010, ApJ, 725, 734
- Hambly et al. (2008) Hambly, N. C., Collins, R. S., Cross, N. J. G., et al. 2008, MNRAS, 384, 637
- Henning et al. (2010) Henning, T., Linz, H., Krause, O., et al. 2010, A&A, 518, L95
- Hewett et al. (2006) Hewett, P. C., Warren, S. J., Leggett, S. K., & Hodgkin, S. T. 2006, MNRAS, 367, 454
- Hodgkin et al. (2009) Hodgkin, S. T., Irwin, M. J., Hewett, P. C., & Warren, S. J. 2009, MNRAS, 394, 675
- Irwin et al. (2009) Irwin, P. G. J., Teanby, N. A., & Davis, G. R. 2009, Icarus, 203, 287
- Johnston et al. (2013) Johnston, K. G., Shepherd, D. S., Robitaille, T. P., & Wood, K. 2013, A&A, 551, A43
- Johnstone et al. (2003) Johnstone, D., Fiege, J. D., Redman, R. O., Feldman, P. A., & Carey, S. J. 2003, ApJ, 588, L37
- Kraus et al. (2006) Kraus, S., Balega, Y., Elitzur, M., et al. 2006, A&A, 455, 521
- Kurtz et al. (1994) Kurtz, S., Churchwell, E., & Wood, D. O. S. 1994, ApJS, 91, 659
- Lawrence et al. (2007) Lawrence, A., Warren, S. J., Almaini, O., et al. 2007, MNRAS, 379, 1599
- Menten et al. (2005) Menten, K. M., Pillai, T., & Wyrowski, F. 2005, in IAU Symposium, Vol. 227, Massive Star Birth: A Crossroads of Astrophysics, ed. R. Cesaroni, M. Felli, E. Churchwell, & M. Walmsley, 23–34
- Minier et al. (2000) Minier, V., Booth, R. S., & Conway, J. E. 2000, A&A, 362, 1093
- Minier et al. (2003) Minier, V., Ellingsen, S. P., Norris, R. P., & Booth, R. S. 2003, A&A, 403, 1095
- Neufeld & Hollenbach (1996) Neufeld, D. A., & Hollenbach, D. J. 1996, ApJ, 471, L45
- Pillai et al. (2006) Pillai, T., Wyrowski, F., Menten, K. M., & Krügel, E. 2006, A&A, 447, 929
- Rathborne et al. (2006) Rathborne, J. M., Jackson, J. M., & Simon, R. 2006, ApJ, 641, 389
- Reynolds (1986) Reynolds, S. P. 1986, ApJ, 304, 713
- Rodriguez et al. (1994) Rodriguez, L. F., Garay, G., Curiel, S., et al. 1994, ApJ, 430, L65
- Rodríguez et al. (2008) Rodríguez, L. F., Moran, J. M., Franco-Hernández, R., et al. 2008, AJ, 135, 2370
- Shepherd et al. (2000) Shepherd, D. S., Yu, K. C., Bally, J., & Testi, L. 2000, ApJ, 535, 833
- Shirley et al. (2007) Shirley, Y. L., Claussen, M. J., Bourke, T. L., Young, C. H., & Blake, G. A. 2007, ApJ, 667, 329
- Tobin et al. (2008) Tobin, J. J., Hartmann, L., Calvet, N., & D’Alessio, P. 2008, ApJ, 679, 1364
- Torrelles et al. (2011) Torrelles, J. M., Patel, N. A., Curiel, S., et al. 2011, MNRAS, 410, 627
- Wang et al. (2011) Wang, K., Zhang, Q., Wu, Y., & Zhang, H. 2011, ApJ, 735, 64
- Wang et al. (2014) Wang, K., Zhang, Q., Testi, L., et al. 2014, MNRAS, 439, 3275
- Xie et al. (1996) Xie, T., Mundy, L. G., Vogel, S. N., & Hofner, P. 1996, ApJ, 473, L131