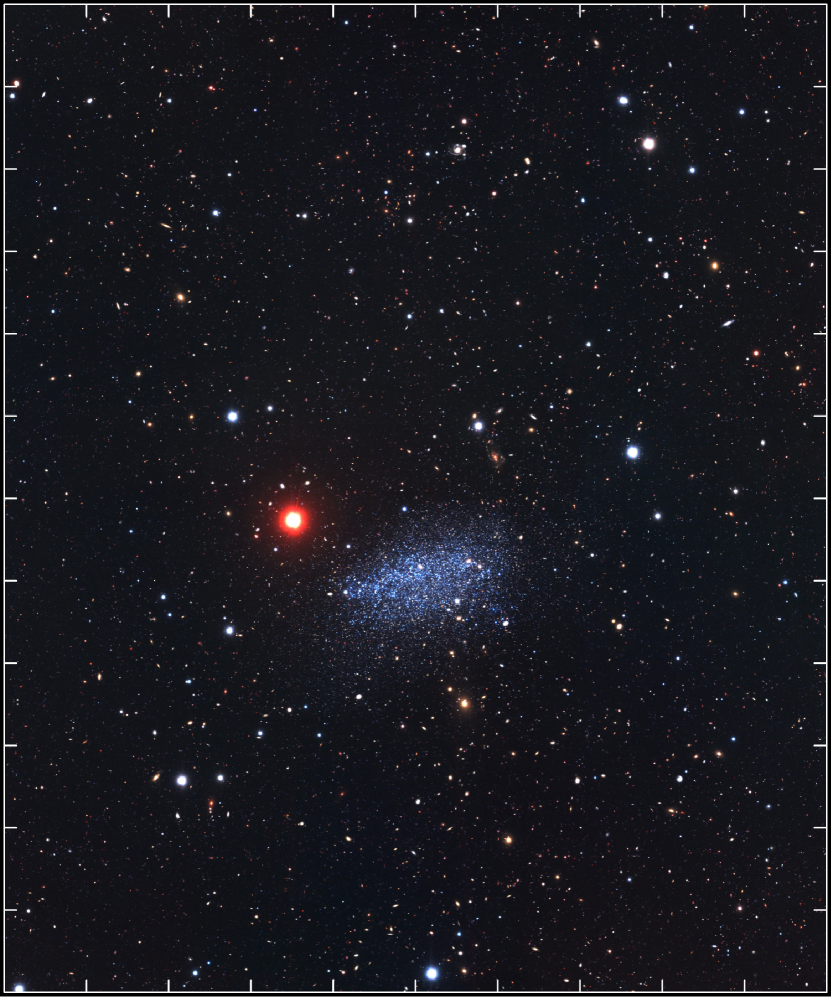
Dwarf Irregular Galaxy Leo A.
Suprime-Cam Wide-Field Stellar Photometry 11affiliation: Based on data collected at the Subaru Telescope, which is operated by the National Astronomical Observatory of Japan
Abstract
We have surveyed a complete extent of Leo A – an apparently isolated gas-rich low-mass dwarf irregular galaxy in the Local Group. The , , and passband CCD images (typical seeing 0.8″) were obtained with Subaru Telescope equipped with Suprime-Cam mosaic camera. The wide-field () photometry catalog of 38,856 objects ( mag) is presented. This survey is also intended to serve as “a finding chart” for future imaging and spectroscopic observation programs of Leo A.
1 Introduction
Dwarf irregular galaxies have been supposed to be the simplest of gas-rich stellar systems. Presumably complex Milky Way-size galaxies have accreted many of them as “building blocks”. Since a significant part of this population was affected/consumed during mergers, finding samples of isolated and unperturbed dwarf irregular galaxies and studying their evolution through the Hubble time is challenging. Analysis of these pristine systems, which were likely built-up only via self-enrichment, could provide insight into the star formation history of “building blocks”.
Leo A – an apparently isolated dwarf irregular galaxy in the Local Group – could serve as an example of such a “building block”. It is an extremely gas-rich (Young & Lo, 1996) dark matter dominated stellar system (Brown et al., 2007) of low stellar mass (Cole et al., 2007) and metallicity (van Zee et al., 2006). It consists of multiple stellar populations ranging from 10 Myr to 10 Gyr old (Cole et al., 2007, and references therein). The present-day star formation activity is traced by H II regions, while existence of old stellar population is proved by detection of RR Lyr stars (Dolphin et al., 2002).
Studies of stellar content in Leo A were performed with Hubble Space Telescope (HST) WFPC2 (Tolstoy et al., 1998; Schulte-Ladbeck et al., 2002) and ACS (Cole et al., 2007) by imaging of the central part. However, photometric mapping to a comparable depth of the whole extent of galaxy’s outskirts (Holmberg’s dimension ; Mateo, 1998) requires a wide-field imaging capability. The Subaru Telescope, equipped with Suprime-Cam mosaic camera, was ideally suited for this task and employed for our survey.
Structural analysis of Leo A by Vansevičius et al. (2004), based on the same Suprime-Cam image set, has revealed a two-component disk/halo-like structure of the radial stellar surface-density profile and a sharp stellar edge of Leo A. These findings are confirmed using the new photometry catalog, which is based on the improved reduction procedures. Here we present the stellar photometry catalog and discuss Suprime-Cam data reductions.
The following parameters of Leo A, as derived from the red giant branch (RGB) star distribution by Vansevičius et al. (2004), are adopted in this study: (1) center coordinates of the galaxy, , (J2000); (2) ellipticity – ratio of semi-minor to semi-major axis, ; (3) position angle of the major axis, °; (4) size of Leo A along the semi-major axis, ′.
2 Observations and Data Reductions
2.1 Suprime-Cam Imaging
Taking into account the angular size of Leo A (; Vansevičius et al., 2004), the Subaru Telescope, equipped with the Prime Focus Camera (Suprime-Cam; Miyazaki et al., 2002), was used to study the stellar content at the galaxy’s very outskirts. A single-shot Suprime-Cam mosaic ( CCD chips; each) covers a field of (scale ), and magnitude of mag is reached in 60 s.
We have observed Leo A on two nights of November 2001. Images of Leo A were acquired through , , and (tagged as “” throughout) Johnson-Cousins system passbands in clear sky and good seeing conditions (full width at half maximum of stellar images, ); see Table 1 for observation details. The analyzed field was centered at , (J2000), i.e., slightly above the central part of Leo A to keep the main body of galaxy around the middle of a single CCD; see Figure 1 for the stacked mosaic color image of the survey field.
“Long” and “short” exposures, consisting of five and three shots, respectively (see Table 1), were used to ensure a wide dynamical range ( mag) of the final photometry catalog. The telescope was dithered between shots to avoid gaps midst CCDs while mapping the field. The applied dithering pattern of “long” (5 shots; , ; , ; , ; , ; , in & , respectively) and “short” (3 shots; , ; , ; , in & , respectively) exposures assured an internal calibration of astrometry and photometry, relying on the same stars measured in adjacent CCD chips.
The standard reduction procedures (bias subtraction and flat-fielding) were performed with the software package SDFRED111SDFRED: http://subarutelescope.org/Observing/Instruments/SCam/sdfred/sdfred1.html.en (Yagi et al., 2002; Ouchi et al., 2004), dedicated to the Suprime-Cam data. For flat-fielding we used “dark night sky” flats, which were median combined from images of uncrowded sky regions of a M 33 survey, conducted in parallel to Leo A observations. From the analyses of the sky background across images we estimated the overall flat-fielding error to be of 2% for the passband and smaller for and . Note, however, that our internal photometric calibration procedure involved linear corrections of 0.03 mag photometric gradients at the edges of the mosaic derived from overlapping images, since “dark night sky” flats do not provide an exact representation of global sensitivity variation across wide-field CCD images (see, e.g., Chromey & Hasselbacher, 1996), however, they remove small-scale variations well.
The “StarL” program (Narbutis et al., 2009) was used to perform corrections of image defects, e.g., “blooming streaks” of saturated stars, and produce a defect-free mosaic image shown in Figure 1.
2.2 Coordinate System
For object cross-identification between different frames, exposures, and passbands their coordinates, (), have to be transformed to a reference coordinate system, (), of a surveyed field. Therefore, we adopted the SDFRED (Yagi et al., 2002; Ouchi et al., 2004) software package to create a reference mosaic image and to find transformation equations for each CCD frame to the reference coordinate system, ().
The SDFRED automatically corrected image distortions according to the prescription from the optical ray-tracing of Suprime-Cam and differential atmospheric refraction dependence on airmass (Miyazaki et al., 2002). The accuracy of 1.5 pix (0.3″) was achieved by this procedure between different passbands and exposures, but it was not suitable to cross-identify objects accurately enough for the photometric catalog.
Therefore, we stacked distortion-corrected images to make a reference passband mosaic with the pixel coordinate system, (). Using IRAF’s geomatch, we computed coordinate transformation equations, , for each image by interactively fitting a 5th-order polynomial to a sample of points distributed uniformly over an image, i.e., . This procedure improved the accuracy of coordinate match between different passbands and exposures, leaving residuals of 0.4 pix (0.08″).
The astrometric World Coordinate System (WCS) solution of the reference passband mosaic was derived by cross-correlating a list of reference objects with the USNO-B1.0 catalog of standard astrometric stars using IRAF’s ccmap. Since the mosaic was transformed with the SDFRED to the tangential sky projection, only linear terms were needed. The fitting procedure was performed by iteratively removing outliers and resulted in 150 uniformly distributed stars used to get an astrometric solution with r.m.s. of 0.2″. Finally, the pixel coordinate system of the reference mosaic, (), was tied to the equatorial sky (J2000) coordinate system, ().
2.3 PSF Photometry
Due to variable point spread function (PSF; FWHM changes up to 25% across the Suprime-Cam field, especially at mosaic edges) for analysis we used only six central CCDs () covering the whole extent of Leo A (see Figure 1). Since corrections of geometric image distortions (i.e., re-sampling to a tangential sky projection) and image stacking degrade the quality of PSF, stellar photometry was performed on the original flat-fielded CCD frames. Subsequently, aperture corrections, zero-point offsets, and residual gradients were applied via overlapping frames.
We have performed stellar PSF photometry on all individual “long” exposure frames by applying the DAOPHOT (Stetson, 1987) implemented in the IRAF software package (Tody, 1993). We followed the photometry procedures described in the DAOPHOT documentation, however, in order to automate them and select stars for PSF modeling, we used custom-built IRAF CL scripts and external programs. The Gaussian PSF models as linear functions of image coordinates, (), are based on reliable candidates of PSF stars (typical number 30), distributed uniformly across each CCD frame.
The PSF photometry was performed with IRAF’s allstar. The residual images were searched for new objects uncovered after subtraction of bright companions by setting a higher detection threshold of (a detection threshold for the first iteration was set to ) to avoid spurious detections. Newly found objects were appended to the initial object list and the allstar procedure was repeated. Tests have shown that two allstar iterations were sufficient to detect stars even in the crowded central part of Leo A.
Finally, neighbors of PSF stars were removed from images by subtracting their best-fit models. We measured the “total” magnitudes, , of those PSF stars using the radius apertures. These magnitudes were used as references to transform the “allstar” magnitudes, , to the “total” magnitude system of the image. Due to PSF variation across the image, aperture corrections are linear functions of coordinates in CCD frames with typical r.m.s. of the fit 0.005 mag, assuring that “allstar” magnitudes of stars are reliably transformed to the “total” magnitude system of the mosaic. We note, that residual aperture corrections from to the true magnitudes, measured through large radius aperture, are constant for individual exposures on each CCD, and were taken into account as zero-point offsets.
Since the fields are relatively sparse and there are too few bright stars suitable for PSF modeling in “short” exposure frames, the aperture photometry was performed, and bright objects appended to the PSF photometry list.
2.4 The Instrumental Photometric System
Since the exposure dithering scheme was used, the same object was measured in several individual frames, in some cases obtained with different CCDs. This assured an accurate internal calibration of instrumental magnitudes over the survey field by using the same stars from overlapping frames.
For each passband we derived a global photometric solution of instrumental magnitudes over the whole survey field. Photometry lists of objects measured in individual CCD frames were merged by positional coincidence adopting the maximum allowed coordinate difference of 2 pix (0.4″). The final instrumental magnitudes were computed by taking median values of the zero-point corrected magnitudes measured in individual exposures. Some stars in crowded regions were measured as “double” objects, i.e., artificially split by DAOPHOT. Those objects were analyzed interactively and considered to be single summing up their magnitudes, if distance between them was less than 1.5 pix (0.3″).
The initial “long” exposure object list was produced in three steps: 1) all objects in each passband detected in 2 or more individual exposures were selected ( – 62,095, – 52,794, – 57,533 objects); 2) the object lists in three passbands were merged by positional coincidence adopting the maximum allowed coordinate difference of 2 pix (0.4″); 3) objects possessing and at least one of the or passband magnitudes were included in the object list.
“Short” exposure aperture photometry was transformed to the “long” exposure system by applying zero-point corrections. The bright ( mag) stars from “short” exposures (saturated in “long” exposures) were included in the final catalog. Finally, based on visual inspection of color mosaic images, the object list was interactively cleaned from obvious background galaxies to produce the instrumental magnitude catalog, consisting of 38,856 objects.
Note, however, that instrumental magnitudes were derived neglecting differences in color equations of individual CCDs, since the quantum efficiency curves of individual CCDs (Miyazaki et al., 2002) differ only by % and make these corrections negligible.
2.5 The Standard Photometric System
To transform instrumental magnitudes to the standard photometric system we used stellar photometry of Leo A obtained by HST observations. The WFPC2 field observed by Tolstoy et al. (1998) was imaged through the F439W, F555W, and F814W passband filters. This data set was measured applying PSF photometry by Holtzman et al. (2006) and published on the “HST Local Group Stellar Photometry Archive”222http://astronomy.nmsu.edu/holtz/archival/html/lg.html, providing stellar magnitudes in , , and passbands of the standard Johnson-Cousins system, suitable for Suprime-Cam calibration.
The WFPC2 field is small () and overlaps only with one of six Suprime-Cam CCDs used in our study. However, an accurate internal photometric calibration of individual Suprime-Cam CCDs, having a maximum magnitude difference of 0.02 mag for bright stars ( mag), enabled us to use local photometric standards (Holtzman et al., 2006) to calibrate our instrumental magnitudes accross the entire field.
We have selected accurately measured ( mag; ) isolated () stars from the Holtzman et al. (2006) catalog and cross-identified them with reliably measured stars from our catalog, allowing a maximum coordinate miss-match of 0.2″.
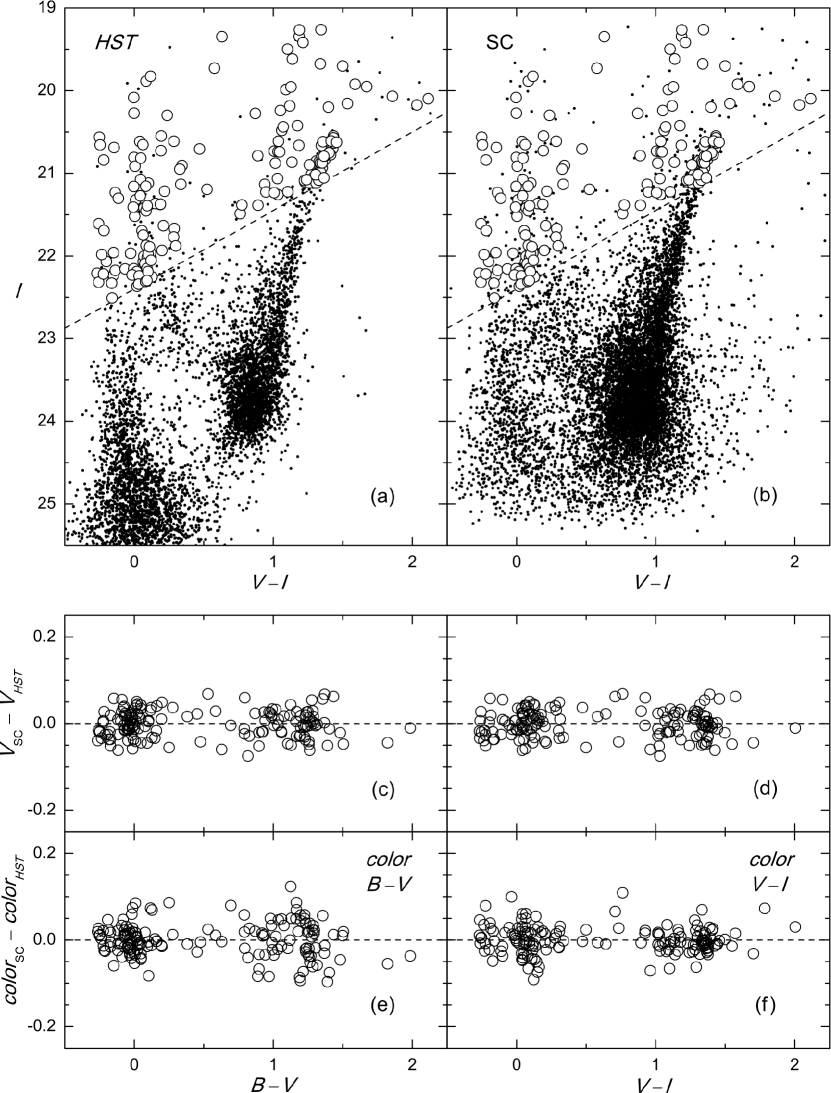
This resulted in 161 photometric standard, spanning the magnitude range from 20.0 to 22.5 mag and wide color (, ) ranges from to 2.0 mag. Figures 2(a) & (b) show versus diagrams of stellar objects in the WFPC2 (5,478 stars; Holtzman et al., 2006) and Suprime-Cam (9,739 stars located inside the ellipse of ′) fields.
The following calibration equations were derived to transform instrumental magnitudes to the standard photometric system:
| (1) | |||
| (2) | |||
| (3) |
Figures 2(c) & (d) show residuals of calibrated magnitude, , versus and colors, respectively. Residuals of colors, and , are shown versus corresponding colors in Figures 2(e) & (f), respectively. Photometric standards used for calibration (158 for and 161 for ) are indicated by open circles. The r.m.s. scatter of residuals is of 0.01 mag. Taking into account the number of standard stars, a transformation accuracy of 0.003 mag in all passbands was achieved.
3 Results
The Suprime-Cam photometry catalog of 38,856 objects ( mag) in Leo A field () centered at , is presented in Table 2. Object coordinates, magnitude, and colors, corresponding photometric errors (, , and ), the number of individual measurements in passband, and parameters of the PSF model fit in passband, derived by DAOPHOT, are provided. There are 3,841 and 7,835 objects lacking and colors, respectively; 95 bright stars are measured in “short” exposure images. The fraction of objects having the following number of independent measurements is: 29% – 2, 24% – 3, 24% – 4, and 23% – 5. Although obvious background galaxies are not included in the catalog, 6,942 objects (20%) are classified and marked as extended based on PSF model fitting results and visual inspection of color mosaic images.
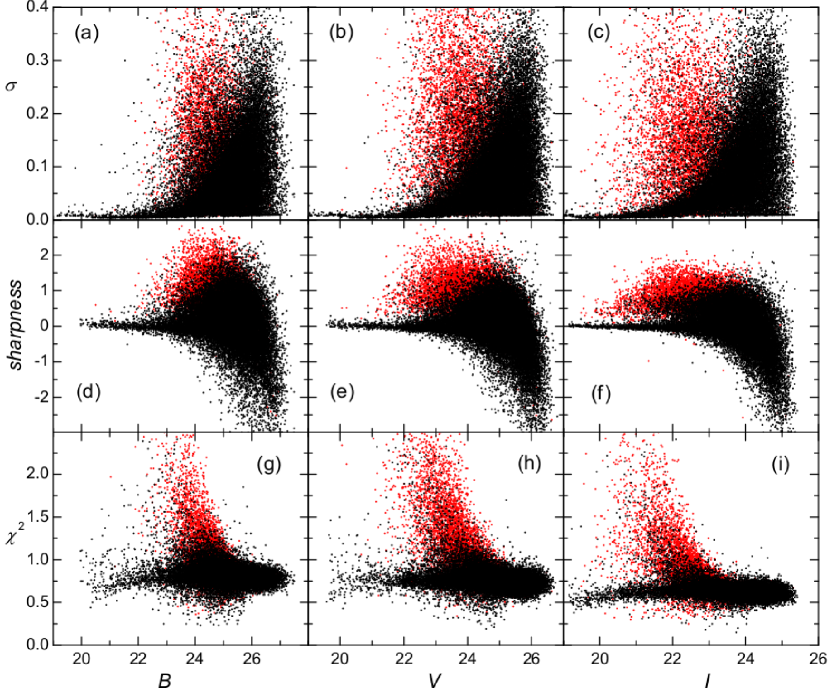
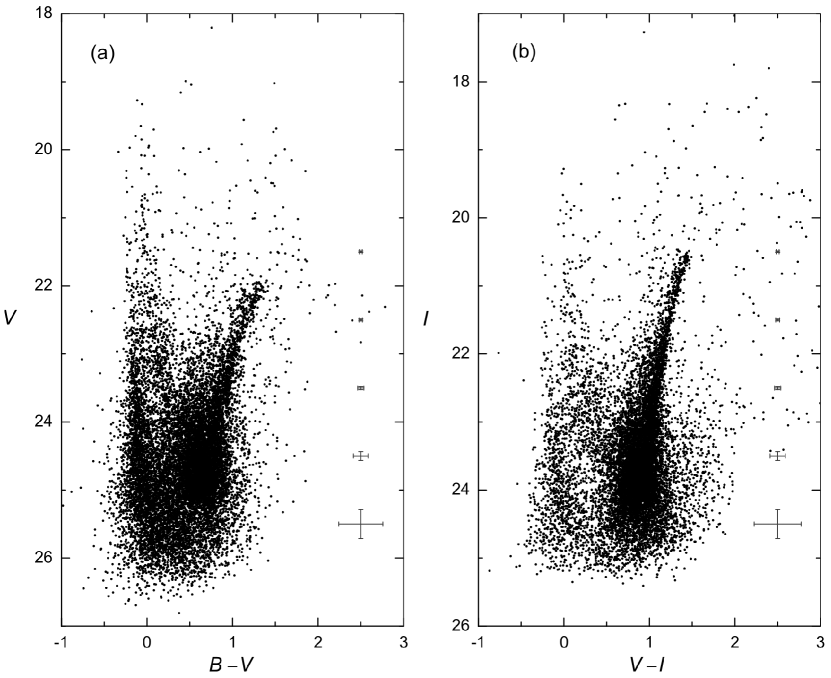
The parameters: , , and for 38,856 objects are plotted versus , , and magnitudes in Figure 3. Bright extended sources can be clearly distinguished in this parameter space, with the majority of them having and . Photometry results of stellar objects located inside the ellipse of semi-major axis ′, i.e., the main body of Leo A, are displayed in vs. (14,831 stars) and vs. (12,154 stars) diagrams, shown in Figures 4(a) & (b), respectively. The typical photometric errors, , are indicated with error-bars. The CMDs of Leo A show clear RGB population, main-sequence and blue-loop stars. The detection completeness of 50% (see Table 1) is located just below the position of red clump stars in the CMDs. Although judging from Figures 2(a) & (b), HST observations of Leo A central field by Tolstoy et al. (1998) have a comparable completeness limit to the Suprime-Cam data, we see a wider RGB in our data due to high field crowding. However, there is no strong crowding effect in the outer parts (′) of the galaxy, where our survey was mainly targeted.
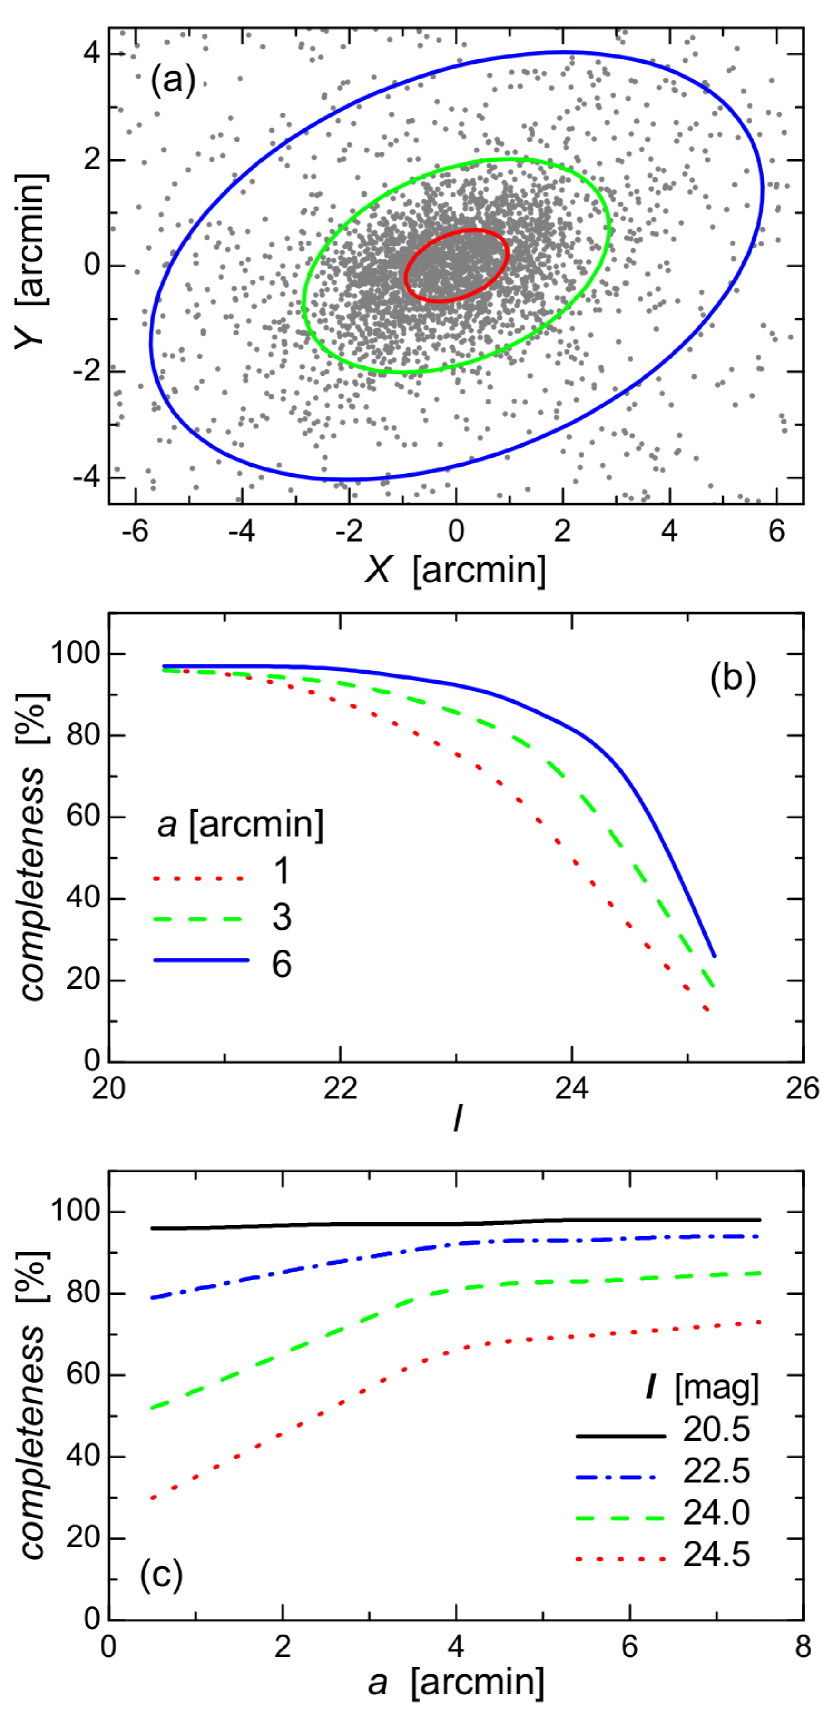
In order to estimate the completeness of the photometry catalogue in cases of various star densities more carefully, we performed artificial star tests (ASTs), following prescriptions by Stonkutė et al. (2008) within a rectangular test area of in size, centered on Leo A and extending beyond its limits (Vansevičius et al., 2004). We computed completeness333%, where and are the number of input and recovered artificial stars, respectively for 9 passband reference magnitudes, evenly distributed in the range of mag. For every reference magnitude we produced two sets of AST frames. The original frames of individual exposures were populated with 8,000 AST stars, distributed on a regular grid with a step of 7″ (i.e., to avoid self-crowding) within the test area. The second set of AST frames was produced in the same way; however, coordinates of 8,000 AST stars were shifted in and directions by 3.5″. This resulted in a total number of 16,000 AST spatial sampling points per reference magnitude.
To measure AST frames we used the same object detection and photometry procedures as for the original Leo A frames. For each of the 9 reference magnitudes photometric catalogs of all stars (containing a fraction of AST stars) detected in the AST test area were produced. We selected AST stars from these catalogs by matching their coordinates with the input AST star coordinates, allowing a maximum difference of 1.5 pix (0.3″). Based on the results of AST star photometry we estimated the completeness of the photometry catalog for three crowding cases: inside an ellipse of ′ and within two elliptical rings of 0.6′ in width at ′ and ′ radial distances. Completeness estimates as a function of the passband magnitude and radial distance from the galaxy center are shown in Figure 5. Brightest ( mag) stars are confidently detected even in the crowded central part, however, at mag completeness already varies from 50% to 85% depending on the radial distance from the galaxy center.
4 Discussion and Conclusions
Since deep wide-field imaging became available, studies of dwarf galaxy structures have been a subject of great interest during the recent years (see, e.g., Hidalgo et al., 2009, and references therein). Subaru Suprime-Cam has already been successfully used in analysis of other Local Group dwarf galaxies, e.g., the transitional galaxy DDO210 (McConnachie et al., 2006), Andromeda II dSph (McConnachie et al., 2007), and Ursa Major I dSph (Okamoto et al., 2008), among others.
We have performed a photometric survey of a field of size, covering the complete extent of an apparently isolated Local Group dwarf irregular galaxy Leo A, with Subaru Suprime-Cam in , , and passbands. In this study we present: (1) the photometry catalog of 38,856 objects ( mag), about 80% of which are classified as star-type; (2) , , and passband “finding charts” (stacked CCD mosaics), suitable for object identification, available via the WWW444http://www.astro.ff.vu.lt/data/leoa/.
This photometry data set of Leo A has already been used to cross-identify sources in the Spitzer study on census of asymptotic giant branch stars by Boyer et al. (2009). Therefore, the catalog and mosaic images could be useful for future imaging and spectroscopic observation programs. They complement the deepest available HST/ACS images of the central part of Leo A ( mag; Cole et al., 2007).
References
- Boyer et al. (2009) Boyer, M. L., Skillman, E. D., van Loon, J. T., Gehrz, R. D., & Woodward, C. E. 2009, ApJ, 697, 1993
- Brown et al. (2007) Brown, W. R., Geller, M. J., Kenyon, S. J., & Kurtz, M. J. 2007, ApJ, 666, 231
- Chromey & Hasselbacher (1996) Chromey, F. R., & Hasselbacher, D. A. 1996, PASP, 108, 944
- Cole et al. (2007) Cole, A. A., et al. 2007, ApJ, 659, L17
- Dolphin et al. (2002) Dolphin, A. E., et al. 2002, AJ, 123, 3154
- Hidalgo et al. (2009) Hidalgo, S. L., Aparicio, A., Martínez-Delgado, D., & Gallart, C. 2009, ApJ, 705, 704
- Holtzman et al. (2006) Holtzman, J. A., Afonso, C., & Dolphin, A. 2006, ApJS, 166, 534
- Mateo (1998) Mateo, M. L. 1998, ARA&A, 36, 435
- McConnachie et al. (2006) McConnachie, A. W., Arimoto, N., Irwin, M., & Tolstoy, E. 2006, MNRAS, 373, 715
- McConnachie et al. (2007) McConnachie, A. W., Arimoto, N., & Irwin, M. 2007, MNRAS, 379, 379
- Miyazaki et al. (2002) Miyazaki, S., et al. 2002, PASJ, 54, 833
- Narbutis et al. (2009) Narbutis, D., Vanagas, R., & Vansevičius, V. 2009, Baltic Astronomy, 18, 219
- Okamoto et al. (2008) Okamoto, S., Arimoto, N., Yamada, Y., & Onodera, M. 2008, A&A, 487, 103
- Ouchi et al. (2004) Ouchi, M., et al. 2004, ApJ, 611, 660
- Schlegel et al. (1998) Schlegel, D. J., Finkbeiner, D. P., & Davis, M. 1998, ApJ, 500, 525
- Schulte-Ladbeck et al. (2002) Schulte-Ladbeck, R. E., Hopp, U., Drozdovsky, I. O., Greggio, L., & Crone, M. M. 2002, AJ, 124, 896
- Stetson (1987) Stetson, P. B. 1987, PASP, 99, 191
- Stonkutė et al. (2008) Stonkutė, R., et al. 2008, AJ, 135, 1482
- Tody (1993) Tody, D. 1993, Astronomical Data Analysis Software and Systems II, 52, 173
- Tolstoy et al. (1998) Tolstoy, E., et al. 1998, AJ, 116, 1244
- Vansevičius et al. (2004) Vansevičius, V., et al. 2004, ApJ, 611, L93
- van Zee et al. (2006) van Zee, L., Skillman, E. D., & Haynes, M. P. 2006, ApJ, 637, 269
- Yagi et al. (2002) Yagi, M., Kashikawa, N., Sekiguchi, M., Doi, M., Yasuda, N., Shimasaku, K., & Okamura, S. 2002, AJ, 123, 66
- Young & Lo (1996) Young, L. M., & Lo, K. Y. 1996, ApJ, 462, 203
| Passband | Exposuresaa Number and duration (seconds) of exposures | Seeingbb Range of stellar FWHM | cc Limiting magnitude at detection completeness of 50% |
|---|---|---|---|
| [″] | [mag] | ||
| 0.7 – 0.9 | 26.2 | ||
| 1.0 – 1.4 | |||
| 0.6 – 0.9 | 25.8 | ||
| 0.8 – 0.9 | |||
| 0.7 – 0.8 | 24.8 | ||
| 0.5 – 0.6 |
| ID | aa R.A. & Decl. (J2000) coordinates in the USNO-B1.0 catalog system | aa R.A. & Decl. (J2000) coordinates in the USNO-B1.0 catalog system | bbThe Johnson-Cousins system | bbThe Johnson-Cousins system | bbThe Johnson-Cousins system | cc Photometric errors: , | cc Photometric errors: , | cc Photometric errors: , | dd Number of measurements in passband; | ee and – DAOPHOT parameters of PSF model fitting in passband; not available for bright stars ( mag) measured by aperture photometry in “short” exposure frames | ee and – DAOPHOT parameters of PSF model fitting in passband; not available for bright stars ( mag) measured by aperture photometry in “short” exposure frames | Typeff Classification based on PSF model fitting and visual inspection of images: 0 – star, 1 – extended object |
|---|---|---|---|---|---|---|---|---|---|---|---|---|
| J095839.45+305247.5 | 09:58:39.451 | +30:52:47.51 | 24.486 | 0.400 | 0.449 | 0.014 | 0.030 | 0.171 | 3 | 0.31 | 0.77 | 0 |
| J095839.45+305323.5 | 09:58:39.455 | +30:53:23.52 | 24.788 | 0.577 | 1.326 | 0.055 | 0.113 | 0.072 | 2 | 0.47 | 0.91 | 1 |
| J095839.46+305453.7 | 09:58:39.464 | +30:54:53.70 | 23.708 | 0.972 | 1.281 | 0.490 | 0.491 | 0.531 | 3 | 0.80 | 1.16 | 1 |
| J095839.47+305128.1 | 09:58:39.468 | +30:51:28.13 | 25.788 | 0.743 | 1.424 | 0.201 | 0.312 | 0.352 | 2 | -0.72 | 0.72 | 0 |
| J095839.51+305241.5 | 09:58:39.513 | +30:52:41.51 | 25.803 | 0.394 | 0.124 | 0.175 | 2 | -0.36 | 0.67 | 0 |
Note. — The photometry catalog of objects residing in the field of , centered at , . This table is available in its entirety in a machine-readable form in the online journal. A portion is shown here for guidance regarding its form and content.