The unintended influence of control systems on edge-plasma
transport and stability in the Joint European Torus
Abstract
A unique experiment in the Joint European Torus (JET) consecutively produced 120 almost identical plasma pulses, providing two orders of magnitude more data than is usually available. This allows the statistical detection of previously unobservable phenomena such as a sequence of resonant-like waiting times between edge-localised instabilities (ELMs). Here we investigate the causes of this phenomenon. By synchronising data to the 1000s of ELM times and averaging the results, random errors are reduced by a factor of 50, allowing unprecedentedly detailed behaviour to be described. A clear link can then be observed between plasma confinement, ELM occurrence, vertical plasma oscillations, and an otherwise unobservable oscillation in a control coil current that is not usually associated with ELM occurrence. The results suggest a strong and unanticipated edge-plasma dependence on control system behaviour.
pacs:
52.35.Py, 05.45.Tp, 52.55.DyThe successful operation of a large magnetically confined fusion plasma experiment in a tokamak such as ITER ITER , will require the successful mitigation of potentially damaging edge-localised plasma instabilities (ELMs) Zohm ; Kamiya . Unless they are controlled or avoided, an economically viable fusion power plant seems an unrealistic prospect. Here we describe observations that point to an unexpected new method for modifying the edge plasma stability and density.
The origin of this discovery is the analysis of data from over 120 consecutively created 2T, 2MA, high confinement (H-mode) plasmas in the Joint European Torus (JET). These were designed to study the movement of eroded plasma facing material within JET’s vacuum vessel after the installation of JET’s new ITER-like wall ILW , full details are in Brezinsek . The data set is unprecedentedly large, with each plasma having about 6 seconds of H-mode with type I ELMs. Combining data from the exceptionally steady-state final 2 seconds of H-mode, provides 240 seconds of plasma with 10000 ELMs.
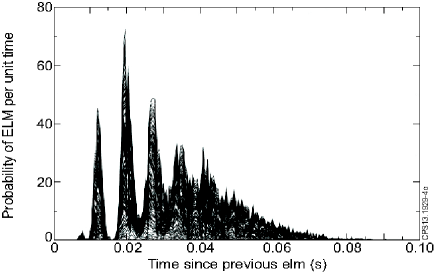
The large quantities of data produced the most finely resolved probability density function (pdf) for the waiting times between ELMs to date. In contrast to expectations from previous work WebsterPRL , the pdf was found to have a sequence of maxima and minima separated by 8ms intervals, with the first maxima 12ms after the previous ELM (figure 1) resonances . Here we explore the cause of this phenomenon. Key to our analysis is the unprecedentedly large amount of ELM data; each ELM is in principle, statistically equivalent. By synchronising data to the ELM times, and averaging over e.g. 3000 ELMs, the central limit theorem ensures that random errors will be reduced by a factor of . This allows detail to be observed that would not otherwise be possible, and enables the analysis presented here. The Berylium II (527nm) radiation measured at the inner divertor in 0.1ms intervals is used to identify ELM-times, as in WebsterPRL . When synchronising the data to ELM times, we deliberately exclude data for which the previous ELMs occurs within 40 ms. This is to exclude any large post-ELM responses from being included in the pre-ELM signal, but reduces the number of ELMs to 3000. The resulting plots (figures 2, 3, and 4) include the average and its standard deviation, plus values from a typical JET pulse in the set (83794). The Supplementary Material SM lists the pulses that we consider.
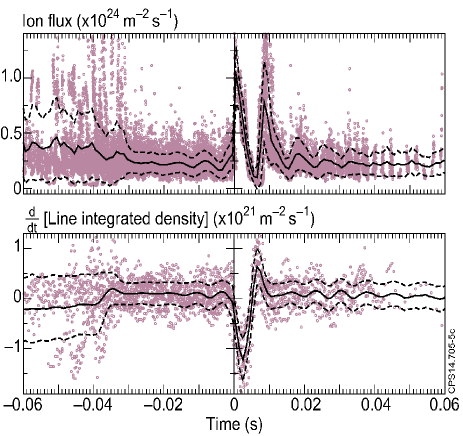
Figure 2 plots Langmuir probe measurements of Deuterium ion fluxes to JET’s inner divertor, and the rate of change of line-integrated plasma density measured along a chord through the plasma’s mid-plane. Because the chord is through the mid-plane, the line-integral is insensitive to small vertical plasma displacements, and should solely measure changes in plasma density. Both plots show 8ms-period oscillations in the ion flux and rate of change of plasma density, with increased ion fluxes coinciding with decreasing density, and vice versa. Line-integrated edge-density measurements are similar.
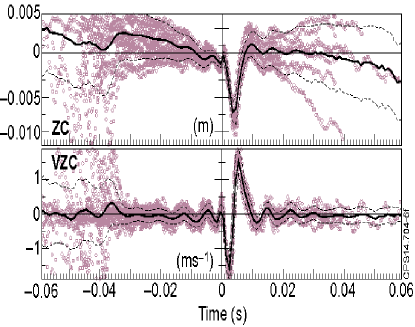
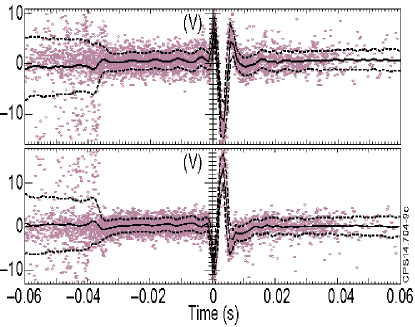
Figure 3 shows: the vertical position and velocity of the plasma current’s centre as calculated by EFIT EFIT ; EFIT2 , and electromotive forces (EMFs) measured by toroidal “flux” loops that are vertically above and below the plasma. There are clear 8ms-period pre-ELM oscillations in EFIT’s calculated plasma motion, that appear to be confirmed by EMFs that are measured by the two flux loops. The measured EMFs are out of phase with each other, consistent with a vertical plasma oscillation, and have a phase and amplitude that is consistent with the vertical velocity calculated by EFIT. It is well known that vertical plasma displacements can modify plasma stability Liang , and the oscillation’s period is the same as for enhanced (or reduced) ELM occurrence and ion losses, so it is possible that they are triggered by the vertical oscillations. The maxima in ELM occurrence and ion fluxes are when the plasma is moving rapidly towards its furthest downwards displacement, and the minima in ELM occurrence and ion fluxes have the plasma near its uppermost position. The correlation between EMFs, plasma motion, and ELMs, explains the phase relationship observed between ELM occurrence and measured flux loop voltages in JET’s divertor in Chapman .
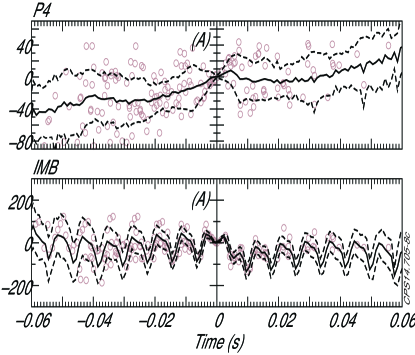
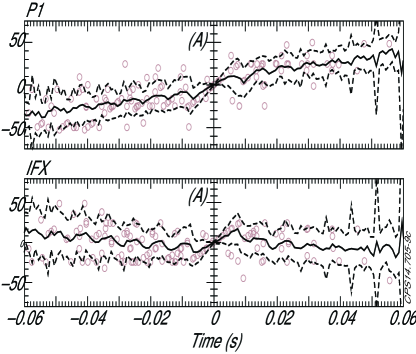
Previous analysis resonances indicated that the oscillations observed in figures 2 and 3 must result from either a plasma phenomena or a real time control system, but found no evidence for the vertical control system being responsible. JET also has a real-time shape control system that alters 9 coil circuits: 4 divertor coils, and circuits named as: P1, P4, SHA, IMB, and PFX (see Sartori for details). The divertor coils are used to control the plasma strike point positions, P1 controls the plasma current, P4 controls the outer gap (ROG), SHA controls the plasma’s triangularity and elongation, IMB controls the top gap (TOG), and PFX controls the inner gap (RIG); although as indicated in figure 2 of Sartori , each circuit modifies the plasma’s shape and position in a variety of ways. The shape controller can modify these currents every 2ms, and they are recorded every 8ms, which is too infrequent for an 8ms period oscillation to be observable in time traces of the currents. Consequently the 240s of data and 3000 ELMs become essential. Figure 4 plots the measured currents after synchronising them to the ELM times and offsetting them by their value at the ELM (), estimated by linearly interpolating between adjacent data values. The result is surprisingly successful, with comparatively small error bars in many of the plots.
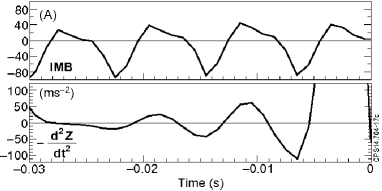
The divertor coil and SHA currents are comparatively unremarkable and are not shown here. As are the P4 currents, that show a gradual increase prior to ELMs but no oscillations. In contrast, P1, PFX, and IMB, show clear oscillations with an 8ms timescale prior to ELMs. It is worth emphasising that these plots represent measured currents in the circuits (not voltages), with associated magnetic fields that directly displace the plasma’s shape and position. For these plasmas the control system settings use P1 to keep the plasma current constant, the PFX currents are not used to control RIG but are requested to be kept a constant fraction of the plasma’s current (that is approximately constant), and use IMB to control TOG. The currents in IMB in particular show clear oscillations. The error bars on these average IMB currents are very small, indicating that this 150A current oscillation has a very consistent 8ms period. This seems likely to be the cause of the oscillatory observations described here and elsewhere resonances . The ELMs occur 4ms after a maximum in IMB, which is 12ms from the previous maximum. The maxima are at 12, 20, 28, 36, 44, and 52 ms before and after an ELM; identical to the timings of the maxima in figure 2 of resonances . An increase in IMB current would be expected to pull the plasma down and outwards Sartori , and a decrease in IMB to push the plasma up and inwards. Figure 5 is consistent with this, finding a downwards plasma acceleration when the oscillation in IMB current is +ve, and an upwards acceleration when the oscillation in IMB current is -ve. The ELMs (and enhanced ion fluxes), occur as IMB pulls the plasma outward and downwards.
The size and coherence of the oscillations in IMB make a persuasive case for IMB being the cause of the oscillatory phenomena discussed in this paper. As does their exact coincidence with enhanced (or reduced) ion fluxes and ELM occurrence, and the correlation between the sign of the IMB current’s oscillation and the direction of plasma acceleration. How the oscillations arise is unclear, but it is known that oscillations can easily arise in a control system involving 9 independent circuits and the plasma Sartori . The oscillations are not universally present in JET plasmas, and depend on plasma heating and fueling for example resonances , and could involve a coupling between various independent circuits, the plasma, and the plasma’s motion. A rigorous analysis is likely to require both a faster recording of control coil currents and an effective modelling of the plasma’s response to them.
We emphasise that because the currents in these circuits were only recorded every 8ms, it is impossible to get an indication that the oscillations were present from the time series data alone - this was only possible due to the large number of ELMs and plasma pulses in the analysis. We also emphasise that the oscillations in IMB current could arise from a complex process or sequence of processes involving one or more of: plasma instabilities, turbulence, transport processes, material erosion and recycling for example, but we think it simplest to regard the IMB current as the “cause” of the vertical oscillations and to search for the cause or sequence of processes by which the IMB oscillations are produced.
To summarise, an unprecedented number of 120 identical JET plasmas has allowed the observation of a totally unexpected connection between a seemingly benign shape control system, ELM occurrence, and edge transport. There are numerous implications. Firstly, these and similar effects could be common but unobserved, due to insufficient data. This has clear implications for the analysis of experiments for ELM pacing in particular Liang , there could be synergies favouring different ELM frequencies that need to be tested. Second, it suggests that a control system or a plasma-control system interaction is causing vertical oscillations, and are either directly or indirectly modifying the plasma’s edge-transport and stability. More significantly, it opens the possibility that entire classes of ELMs could involve synergistic control system interactions - this will be explored in greater detail elsewhere, and may require a modification of the paradigm whereby plasma stability and transport is studied independently of control system behaviour; and vice versa. Finally, the suggestion that IMB can modify edge transport rates leads us to ask, could it modify edge densities sufficiently to avoid ELMs entirely? We hope these possibilities will be explored in the near future.
Acknowledgements: AJW thanks: Francesco Maviglia, David Keeling, Geoffrey Cunningham, Ian Chapman, Peter Lomas, Alan West, Paul Smith, Simon Hotchin, Andre Neto, Philip Andrew, Maximos Tsalas, Tobias Schlummer, and Ephrem Delabie, for help in various ways. This work was supported by EURATOM and carried out within the framework of the European Fusion Development Agreement. For further information on the contents of this paper please contact publications-officer@jet.efda.org. The views and opinions expressed herein do not necessarily reflect those of the European Commission. The work was also part-funded by the RCUK Energy Programme under grant EP/I501045.
References
- (1) R. Aymar et al. for THE ITER TEAM, Plasma Physics and Controlled Fusion 44, 519, (2002).
- (2) H. Zohm, Plasma Physics and Controlled Fusion 38, 105, (1996).
- (3) Kamiya et al., Plasma Physics and Controlled Fusion 49, S43, (2007).
- (4) R. Neu, G. Arnoux, M. Beurskens, et al. Phys. Plasmas 20, 056111, (2013)
- (5) S. Brezinsek, T. Loarer, V. Phillips, et al. Nucl. Fusion, 53, 083023, (2013).
- (6) A.J. Webster and R.O. Dendy, Phys. Rev. Lett. 110, 155004, (2013).
- (7) A.J. Webster, R.O. Dendy, F.A. Calderon, S.C. Chapman, E. Delabie, D. Dodt, R. Felton, T.N. Todd, V. Riccardo, B. Alper, S. Brezinsek, P. Coad, J. Likonen, M. Rubel, and JET EFDA Contributors, (arXiv:1310.0287), Plasma Phys. Control. Fusion, 56, 075017, (2014).
- (8) Supplementary material.
- (9) L.L. Lao, H. St. John, R.D. Stambaugh, A.G. Kellman and W. Pfeiffer, Nucl. Fusion 25, 1611, (1985).
- (10) L.C. Appel, G.T.A. Huysmans, L.L. Lao, et al. 33rd EPS Conference on Plasma Phys. Rome, 19 - 23 June 2006 ECA Vol.30I, P-2.184 (2006).
- (11) Y. Liang, Fusion Science and Technology 59, 586, (2011).
- (12) S.C. Chapman, R.O. Dendy, T.N. Todd, N.W. Watkins, A.J. Webster, F.A. Calderon, J. Morris, and JET-EFDA Contributors, Phys. Plasmas, 21, 062302, (2014).
- (13) F. Sartori, G. De Tommasi, F. Piccolo, IEEE Control Systems Magazine 26, 64-78, (2006).