The Size Evolution of Elliptical Galaxies
Abstract
Recent work has suggested that the amplitude of the size mass relation of massive early type galaxies evolves with redshift. Here we use a semi-analytical galaxy formation model to study the size evolution of massive early type galaxies. We find this model is able to reproduce the amplitude of present day amplitude and slope of the relation between size and stellar mass for these galaxies, as well as its evolution. The amplitude of this relation reflects the typical compactness of dark halos at the time when most of the stars are formed. This link between size and star formation epoch is propagated in galaxy mergers. Mergers of high or moderate mass ratio (less than 1:3) become increasingly important with increasing present day stellar mass for galaxies more massive than . At lower masses, low mass ratio mergers play a more important role. In situ star formation contribute more to the size growth than it does to stellar mass growth. We also find that, for ETGs identified at , minor mergers dominate subsequent growth both for stellar mass and in size, consistent with earlier theoretical results.
1 Introduction
The most massive galaxies are typically early type galaxies (hereafter ETGs). Understanding the abundance and properties of ETGsis very important for galaxy formation theory and is also relevant to the determination of cosmological parameters (e.g. De Lucia & Blaizot, 2007; Conselice, 2014). The evolution of ETGs is thought to be driven by mergers, and hence to reflect the hierarchical nature of structure formation in the CDM model (Frenk et al., 1985; White & Frenk, 1991; Kauffmann, White & Guiderdoni, 1993; Lacey & Cole, 1993; Parry, Eke & Frenk, 2009).
Size is one of the most important observables in efforts to understand the evolution of ETGs. The size of a galaxy is typically defined as the projected radius, , containing half of its stellar mass, . The scaling relation between and for the ETG population has been studied by a number of recent galaxy surveys [e.g.(Shen et al., 2003; Bernardi et al., 2010; Buitrago et al., 2008; van der Wel et al., 2014; Cassata et al., 2013; Cooper et al., 2012)]. It has been known for many years that ETGs (defined according to various combinations of mass, star formation rate, colour and surface brightness profile shape) are much more compact at high redshift, compared to their counterparts in the local Universe (Daddi et al., 2005; McIntosh et al., 2005; Trujillo et al., 2006; di Serego Alighieri et al., 2005). An often-quoted result is that the effective radius of a ‘typical massive ETG’ increases by up to a factor of from to (Trujillo et al., 2006; Cassata et al., 2011; Cenarro & Trujillo, 2009; Buitrago et al., 2008; van Dokkum et al., 2008; Damjanov et al., 2011; van der Wel et al., 2014). Over the same redshift range, the corresponding ‘typical mass’ increases by only a factor of 2 (van Dokkum et al., 2010; Baldry et al., 2012). These results most often refer to the average size and mass of all ETGs above a fixed mass, applying the same rest-frame selection criteria at all redshifts. Recent work has provided more detailed insights: for example, there is evidence that the size increase may have been be larger for galaxies of larger present-day stellar mass (Ryan et al., 2012), and Saracco, Longhetti & Gargiulo (2011); Shankar et al. (2013); Napolitano, Romanowsky & Tortora (2010) found that the size of ETGs selected may depend on their stellar age. This age dependence is not apparent in the local Universe (Trujillo, Ferreras & de La Rosa, 2011). The central stellar mass density of massive galaxies at high redshift is similar to that of comparable galaxies in the local Universe (Bezanson et al., 2009; Hopkins et al., 2009; van Dokkum et al., 2010; Huang et al., 2013), and the majority of the evolution of the stellar mass density profiles of these galaxies seems to occur in their low surface brightness outer regions (Saracco, Gargiulo & Longhetti, 2012). Similarly, the central velocity dispersions of ETGs shows only a weak decline with decreasing redshift at (Cenarro & Trujillo, 2009).
Explanations for these observations have been sought in the context of the CDM model. This is far from straightforward – unlike the growth of dark matter structure, galaxy evolution in CDM has a number of redshift-dependant characteristic scales introduced by baryonic physics (Guo & White, 2008). Moreover, when galaxy populations are defined by redshift-independent selection functions (as in the case of ETGs), it becomes necessary to account for the apparent ‘evolution’ due to galaxies entering and leaving these selections, in addition to the evolution of galaxies that remain in the sample from high to low redshift. A fully self-consistent theory of how the ETG population evolves therefore requires a complete forward model of the entire galaxy population.
Here we study the size-mass relation of the ETG population at different epochs, from to , in the semi-analytic galaxy formation model developed by Guo et al. (2011, 2013). This model reproduces many properties of galaxies observed in the local Universe and at high redshift, including the size – mass relation for both early and late type galaxies at the present day (Guo et al., 2011). We compare our model to observed galaxy size data over the same redshift range. In the context of the evolving amplitude of the size – mass relation, we examine the origin and relative importance of sample evolution and intrinsic evolution, concentrating on the mechanisms naturally provided by standard galaxy formation theory, namely star formation and dissipationless merging.
Mergers of high mass ratio, in particular, are thought to be capable of increasing galaxy size while providing relatively little corresponding increase in mass and having little or no effect on central density or velocity dispersion (Cole et al., 2000; Hilz, Naab & Ostriker, 2013; Hopkins et al., 2009; Trujillo, Ferreras & de La Rosa, 2011; Newman et al., 2012; Bezanson et al., 2009). Evolution dominated by these ‘minor’ mergers therefore provides a plausible explanation of the observational results at mentioned above [, e.g. Naab, Johansson & Ostriker 2009]. Observational arguments supporting this hypothesis have also been made based on the greater frequency of higher mass ratio mergers (e.g. Trujillo, 2013; McLure et al., 2013). Recent hydrodynamical simulations (e.g. Naab, Johansson & Ostriker, 2009; Oser et al., 2012) and N-body experiments (Laporte et al., 2013) have demonstrated that this explanation is indeed plausible in a cosmological context. In our model, the various evolutionary processes relevant to ETGs are included consistently with one another and with the galaxy population as a whole, allowing us to comment further on the relative importance of minor mergers. Note we do not address the nature of so-called ultra-compact galaxies, which represent a small fraction of the ETG population and are thought to form through intense, highly dissipative starbursts (e.g. Dekel et al., 2009; Hopkins et al., 2009).
This paper is structured as follows. In section 2 we briefly describe the N-body simulation and semi-analytic model used for this work. In section: 3 we compare size–mass relations at different redshifts in the model to observed relations. In Section 4 we study the different mechanisms driving the evolution of the size – stellar mass relation in the model. We summarize our results in Sec. 5.
2 Simulation and semi-analytical models
The galaxy formation model in this work is based on dark matter halo merger trees extracted from the cosmological -body Millennium Simulation. Descritpions of the Millennium Simulation and our galaxy formation model can be found in Springel et al. (2005) and Guo et al. (2011, 2013), respectively. Here we summarize the most important characteristics of the simulation and the equations in the model relevant to the sizes of ETGs.
2.1 The simulation
The Millennium Simulation (Springel et al., 2005) is a cosmological N-body simulation, which follows particles from redshift to the present day in a box of length 500 Mpc/ on each side (where the Hubble parameter ). This volume is large enough to investigate the statistical distributions of the properties of massive ETGs. Each dark matter particle has a mass of , allowing us to follow galaxies down to masses comparable to that of the Small Magellanic Cloud. The simulation adopted cosmological parameters consistent with the first year WMAP results: .
Particle data were stored at 64 logarithmically spaced output times. At each snapshot, the Friends-of-Friends groupfinding algorithm was used to link particles separated by less than 0.2 of the average interparticle separation (Davis et al., 1985). The SUBFIND algorithm (Springel et al., 2001) was then applied to decompose these groups into self-bound substructures (hereafter subhaloes). Merger trees were constructed by linking subhalos at different output times into chains of progenitors and descendants using the algorithm described in Springel et al. (2005); Boylan-Kolchin et al. (2009). The galaxy model then processes these merger trees.
We call the most massive subhalo in a FOF group the ‘main halo’. A galaxy assigned to the potential minimum of a main halo is referred to as a central galaxy, while galaxies assigned to satellite subhalos are referred to as satellite galaxies. Satellite galaxies include so-called ‘orphans’ whose subhalos cannot be resolved anymore by the -body simulation; the orbits of these galaxies are tracked semi-analytically, such that the ability to follow satellites until they merge is not limited by the resoultion of the -body simulation (Springel et al., 2001). For the main halo of each FOF group, we define a total mass, , enclosed by a radius, , within which the mean density is 200 times the critical density for closure at the corresponding redshift.
2.2 Semi-analytical Model
In the standard CDM model, galaxies grow in dark matter dominated potentials as the result of in situ star formation in condensed gas and the accretion of less massive satellite galaxies (White & Rees, 1978). In contrast to the self-similar growth of dark matter halos, the rate of change of stellar mass through both of these channels varies according the existing stellar mass and, at a fixed mass, with redshift (Guo & White, 2008). In this model, star formation always dominates the growth of stellar mass for low mass galaxies (present-day ). More massive galaxies grow mainly through star formation at and by accretion and merging thereafter. Detailed descriptions of stellar mass growth in similar galaxy formation models can be found in Guo et al. (2011, 2013); De Lucia & Blaizot (2007); Croton et al. (2006); Springel et al. (2001). This model also tracks changes in the size of galaxies as their mass evolves. Galaxies are separated into three components – gas disks, stellar disks and stellar bulges. The size and mass of each of these components is followed separately, according to the following prescriptions.
2.2.1 Disk sizes
When gas condenses into the centre of a potential well, we assume that it has the same specific angular momentum () as its host halo. The total angular momentum of the gas disk is thus
| (1) |
where and are the new and original total angular momentum of the gas disk, respectively. is the total angular momentum of recently cooled gas (, where is the amount of gas cooled in a given time interval) and is the total angular momentum carried by the gas component of merging satellites. is the angular momentum lost to stellar disk through star formation.
The stellar disk gains angular momentum through star formation and loses it through disk instabilities, which transfer stars from the disk to the bulge component as required to marginally stabilize the stellar disk against gravitational instability. The balance equation for the stellar disk angular momentum is therefore
| (2) |
where
| (3) |
Here is the amount of new formed star and is the specific angular momentum of the gas disk.
We assume both the gas disk and the stellar disk have exponential surface density profiles and the circular velocity curve is flat, hence the exponential scale length of the gas or stellar disk is given by Croton et al. (2006)
| (4) |
where denotes the total mass in the gas or stellar disk and the corresponding total angular momentum. In practice we use , the maximum circular velocity of the dark halo, as a proxy for . Note this directly connect the sizes of disks to the characteristic scale of their dark matter halo.
2.2.2 Spheroid sizes
When halos become subhalos of more massive systems, their galaxies become satellites. Satellites with resolved subhaloes survive until either (i) they are deemed to be tidally disrupted or (ii) their corresponding subhalo is lost from the -body simulation and the time for their inspiral to the centre of their host potential is less than the lookback time at which their subhalo was lost. Further caveats to these prescriptions are described in Guo et al. (2011). Stars from tidally disrupted objects are placed into a ’stellar halo’ reservoir. For the purposes of this paper, these stars are considered to be unobservable, and they are are never transferred back to any central galaxy. Hence only stars from satellites merging to the centre of their host can influence the size of the host’s central galaxy.
Binary mergers between galaxies (and dark matter haloes) are often divided into ‘major’ and ‘minor’ categories according to mass ratio of the two progenitors. Following convention in the literature, Guo et al. (2011) used a baryon mass ratio threshold of to divide ‘major’ and ‘minor’ mergers. In this model of major mergers, violent relaxation leads to the complete destruction of centrifugally support disks, such that the remnant is purely dispersion-suppoted (e.g. Naab et al., 2007). In contrast, the disk of the more massive (primary) progenitor is allowed to survive in minor mergers, with the stars from the less massive (secondary) progenitor being scattered into the stellar spheroid (bulge) of the remanant.
Mergers also trigger rapid gas disipation, represented by a ‘starburst’ mode of star formation. In the case of major mergers, all gas from both progenitors is used to fuel a starburst that adds stars to the spheroidal component of the remnant. In the minor merger case, gas from the secondary progenitor is added to the gas disk of the remnant, and stars formed in the starburst are also added to the surviving stellar disk. These bursts can convert a large fraction of the available cold gas into stars. A recipe from Somerville, Primack & Faber (2001) is used here to model the fraction of gas converted into stars during a starburst:
| (5) |
where and are the total baryonic mass of the satellite and central galaxies, respectively.
Assuming energy conservation and virial equilibrium, the growth in the size of the spheroid component in a merger between two galaxies can be approximated by Cole et al. (2000):
| (6) |
Here is the so-called structure parameter, relating the binding energy of a galaxy to its mass and radius, and the factor parmeterizes the effective interaction energy of the two galaxies.
In major mergers, both existing stars and stars formed in the associated starburst are counted when calculating the spheroid size of the remnant, i.e. where and are the stellar mass and cold gas mass of the central and satellite galaxies, respectively. In minor mergers, all stars in the satellite galaxy are added to the bulge of the central galaxy. The corresponding and are then assumed to be and , respectively, where denotes the stellar mass in the spheroids of the central galaxies. and are the corresponding half mass radii.
Dynamical instabilities in the disk are another important channel by which stars are transfered to the spheroidal component. Guo et al. (2011) assumed a simple criterion to estimate the onset of instability,
| (7) |
where is the mass of the stellar disk and its exponential scale length. When Eq. 7 is satisfied, a stellar mass of is transfered from the disk to the spheorid such that the disk is made marginally stable. The corresponding growth in spheroid size is also modeled using Eq. 6, defining and to be the stellar mass and the half mass radius of the existing bulge, if any, and and to be the radius containing a mass in the unstable disk. The pre-factor is set to in this case, higher than in the merger case, since the ‘old’ and ‘new’ spheroid stars at least partly overlap at the onset of the instability, implying a higher interaction energy.
Although the Guo et al. (2011) model accounts for the rapid conversion of gas disipated in mergers to stars, the energy balance represented by Eqn. 6 does not take this dissipation into account. Doing so would reduce the size of the remnant further in cases where gas makes up a substantial fraction of the mass of either progenitor (e.g. Covington et al., 2008). Shankar et al. (2013) have shown that the sizes of low mass ETGs in this model would be in better agreement with observations if this effect was included. Such changes are beyond the scope of the present paper.
2.3 Projected half mass radius
All the radii discussed above are defined in three dimensions. To compare these to observational data directly, we need to convert them to radii in projection. We assume that the spheroidal components of our galaxies follow a Jaffe profile (Jaffe, 1983):
| (8) |
Here is the stellar mass of the bulge, and is the corresponding 3-D half-mass radius. The projected density profile is given by
| (9) |
We assume the Jaffe model to simply this calculation, noting that it may not be a good description of all galactic spheroids.
We assume an exponential profile for the disk component,
| (10) |
where is the stellar mass of the disk and the exponential scale length. The total surface mass density (surface brigtness) is the sum of these two components
| (11) |
2.4 Fiducial ETG definition
A wide variety of definitions of the ETG population are found in the literature. Some specifiy the fraction of light or mass in the spheroidal component, some impose upper limints on specific star formation rate, and some select by color or spectral shape. To perform a meaningful comparison between model predictions and observational data in the following section, we will adapt our selection criteria to match roughly those of each dataset we compare to. For simplicity, however, in all other sections this paper we use only one fiducial classification of ETGs in the model, according to their total stellar mass, bulge-to-total stellar mass ratio and specific star formation rate:
| (12) |
.
3 Size evolution
3.1 Model vs. observation
In this section, we compare the evolution of the size of ‘typical’ ETGs and the entire ETG size–mass relation between model predictions and observations.
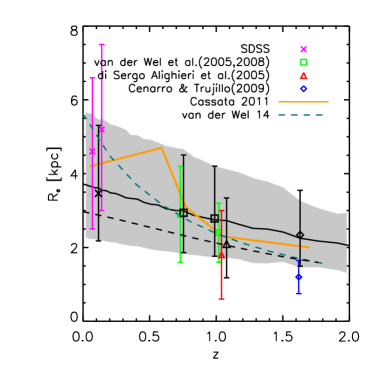
Fig. 1 shows how the median size of the ETG population in the model, defined according to our fiducial criterion (eqn. 12), varies with redshift (solid black line). The median size of galaxies selected in this way increases by a factor of between redshift and .
We compare this prediction with a number of recent observational estimates obtained at different redshifts. For each coloured point or line in Fig. 1, representing an observational result, there is a corresponding black point or line of the same style representing an equivalent selection from the model. The datasets and selection criteria are summarised in Table 1. To reflect uncertainties in the observational determination of stellar mass (Longhetti & Saracco, 2009; Mitchell et al., 2013), we have convolved the stellar mass of each model galaxy with a Gaussian of dispersion 0.25 dex in . Where necesary, we have recalibrated stellar masses from observations to the assumption of a universal Chabrier IMF (Chabrier, 2003) used by Guo et al. (2011).
| former works | surveys | [] | morphology | sSFR [] | z | symbol/line |
|---|---|---|---|---|---|---|
| Cassata et al. (2011) | GOODS WFC3 | visually spheroidal | 0¡z¡2.5 | yellow line | ||
| model | 0¡z¡2.0 | black line | ||||
| Cenarro & Trujillo (2009) | SDSS DR6 | S0, E | Purple crosses | |||
| model | Black cross | |||||
| Cenarro & Trujillo (2009) | GMASS | S0, E | blue diamond | |||
| model | Black diamond | |||||
| van der Wel et al. (2005) | CDFS, RDCS | S0, E | 0.9¡z¡1.2 | green squares | ||
| model | Black square | |||||
| van der Wel et al. (2008) | CDFS, RDCS | S0, E | 0.6¡z¡0.8 | green squares | ||
| model | Black square | |||||
| di Serego Alighieri et al. (2005) | K20 | early-type spectrum | 0.88¡z¡1.3 | red triangle | ||
| model | Black triangle | |||||
| van der Wel et al. (2014) | 3D-HST, CANDELS | U-V, V-J | 0 ¡ z ¡ 2 | cyan dashed curve | ||
| model | 0¡z¡2 | black dashed lines |
The median size of model ETGs at is kpc lower than the SDSS data quoted by Cassata et al. (2011)(yellow line). At , ETGs in model have very similar size to their counterparts in observations, either selected by morphology (van der Wel et al., 2005, 2008)(green squares) or spectral energy distribution (di Serego Alighieri et al., 2005)(red triangles). For ETGs selected by both morphology and specific star formation rate (Cassata et al., 2011), the model predictions are consistent with the observed results at the level up to redshift .
In the study of van der Wel et al. (2014)(cyan dashed curve), ETGs were selected by by color – we used sSFR as a proxy for this selection as colous in the model are subject to additional uncertainties. The discrepency between the model and these observations decreases at higher redshift. Samples drawn from the model with the mass and morphology criteria of Cenarro & Trujillo (2009)(yellow line) lie on the line defined by our fiducial selection, because the morphology cut is the same and the mass cut makes no practical difference. However, the data of Cenarro & Trujillo (2009) define a significantly steeper relation, with a larger median size compared to the model at low redshift and slightly smaller median size compared to the model at .
Although there is some tension between the model and data at high and low redshift, the trend of size evolution of the model from to the present day is in reasonable agreement with observations. ETG samples have a smaller median size at by a factor . We note that, since the mass range defining ETGs is only bounded at low mass, the fact that more high-mass ETGs enter the sample at low redshift would cause some evolution in the ‘average’ size of the ETG population even if the amplitude and slope of the size – mass relation remained fixed. However, as the galaxy mass function truncates exponentially at high masses, the contribution of additional high mass galaxies to the average size measure is only of the order of a few per cent. Hence, the increase in average size must be driven by a change in the overall amplitude of the size – mass relation with redshift.
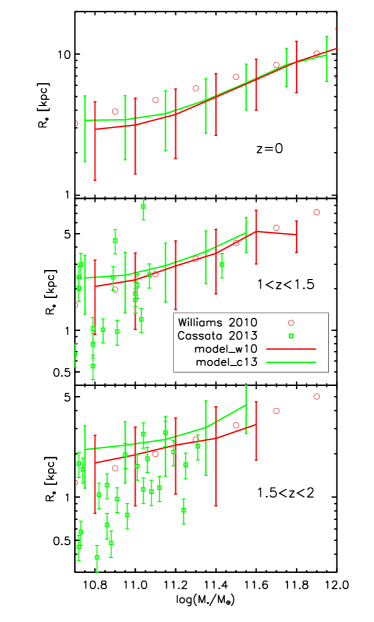
In Fig. 2 we compare the evolution of the model size vs. stellar mass relation with observations in three redshift intervals. Red circles in each panel show measurements by Williams et al. (2010), who used SDSS data at and an updated version of the K-selected galaxy catalog of Williams et al. (2009) for higher redshift galaxies. ETGs are definde by sSFR, where is the age of the Universe at the corresponding redshift. We select model ETGs with the same criteria; the red solid curve with errors indicates their median size and its deviation, respectively. Note that instead of including all galaxies in the same redshift intervals of Williams et al. (2010), we select only in a narrow slice around the median redshift of each interval. For a given stellar mass, the half mass radius of ETGs selected in this way is predicted to increase by a factor of across this range of redshift – this change in amplitude is substantially greater than the increase in the ‘typical’ mass of ETGs due to the inclusion of a larger fraction of very massive galaxies at low redshift. Model predictions are broadly consistent with the Williams et al. (2010) data at all redshifts, particularly for high mass ETGs. The agreement for low mass ETGs is somewhat better at higher redshift.
Most recently, Cassata et al. (2013) used the Cosmic Assembly Near-infrared Deep Extragalactic Legacy Survey (CANDLES) to study the size vs. stellar mass relation for ETGs between . They selected spheroidal galaxies with and . Individual measurements for each of their galaxies are shown with green symbols in Fig. 2. For comparison we select model galaxies with and . The size – mass relations of this selection at the median redshift of each interval explored by Cassata et al. (2013) are shown with green solid curves ( errors). Model predictions for ETGs selected in this way are less obviously consistent with the observational data than in the previous case, particularly in the highest redshift interval where the overestimate of size at low mass is even more pronounced. We believe this is (at least partly) because the Guo et al. (2011) model does not take into account dissipation of energy by gas during mergers. This should make the remnants of gas-rich high-redshift major mergers considerably smaller, but will not affect the remanants of gas-poor mergers, which dominate at lower redshift.
In summary, the evolution in the ‘typical ETG’ size in the model is driven primarily by the increasing amplitude of the size – mass relation with redshift.
3.2 Amplitude of the size–mass relation
In this section, we will explore the origin of the evolution in the amplitude of the ETG size – mass relation. Two factors are relevant. Firstly, galaxies classified as ETGs at high redshift can grow in mass and size over time. The size-mass relation will evolve according to the rate of size change per unit additional mass. Secondly, galaxies may enter (or leave) the ETG population. If the median size at fixed mass for ‘newly formed’ ETGs changes over time, the size-mass relation will evolve even if individual ETGs do not. Since the number of galaxies classified as ETGs at high redshift is only a few percent of that at , the latter effect could easily dominate the apparent evolution in the observed size–mass relation.
To separate these two effects in the model, we divide ETGs into three disjoint sets, according to the redshift interval in which they are first identified as ETGs according to our fiducial selection:
-
1.
HighZ: first identified as ETGs before
-
2.
MidZ: first identified as ETGs between
-
3.
LowZ: first identified as ETGs after
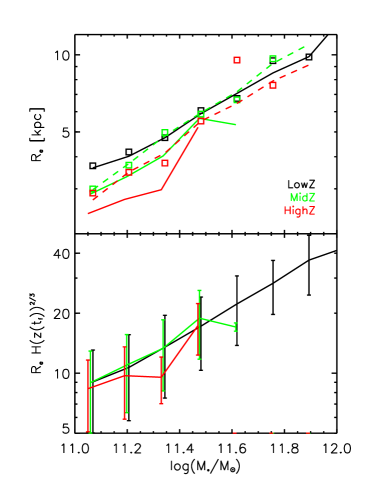
The top panel of Fig 3 shows the median size – mass relation for each of these groups (red, green and black solid lines as indicated in the legend). The slope of the relation is almost independent of redshift. The amplitude increases by a factor of between successive groups. A dashed line of the same colour shows the relation defined at by descendants of the corresponding group at (almost all descendants are still ETGs). Descendants of the HighZ and MidZ samples cover the full mass range of the LowZ sample, showing that some galaxies have grown in mass. HighZ galaxies remain slightly more compact than more recently formed ETGs at a fixed mass. This may also be true for MidZ galaxies with descendants less massive than .
Open square symbols in the top panel of Fig 3 also show relations for the descendants of each sample at , but unlike the dashed lines they only include descendants that are satellites at . About of HighZ samples at are satellites. The fraction is for MidZ samples. It can be seen that the relations for HighZ and MidZ are the same regardless of whether the galaxies have become satellites or not. This is consistent with the finding of Cassata et al. (2011) that, among galaxies in clusters, older galaxies have smaller sizes at given stellar mass. We predict that this is true also in the field.
At a fixed mass, dark matter halos are more compact at high redshift, with the virial radius evolving as , where is the Hubble parameter. In the model this redshift dependence of halo scale propagates to the sizes of newly formed galaxies, via the angular momentum conservation of infalling gas (Eq. 4). The formation of bulges preserves the relative compactness of the system if the two progenitors are of similar age (hence size), but mergers with many more diffuse galaxies will have a ‘diluting’ effect (Eq. 6). Therefore, if galaxies form most of their stars at one early epoch, their sizes should reflect the intial scale of their host halos even at , provided that their final mass is not dominated by mergers with galaxies formed at lower redshift.
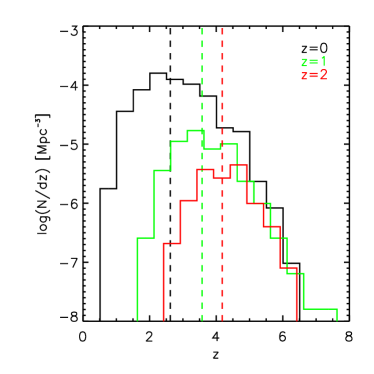
To test this idea, we define a galaxy’s formation time to be the time by which half of its stellar mass is formed. Note that this is not time by which half the stellar mass is assembled into a single object (often used as a defintion of galaxy ‘formation time’ in the literature). At , the stars in one galaxy may belong to many separate galaxies. Fig. 4 shows the distribution of for LowZ , MidZ , and HighZ are shown with black, red, and green histograms, respectively. The formation time depends on stellar mass. Stars in massive ETGs assemble at earlier time than those in less massive ETGs. To remove the mass dependence, we further restrict to those with stellar mass . Dashed vertical lines of the same color indicate the median formation redshift of the corresponding sample. For LowZ, the median redshift is , while for HighZ the median redshift is . The scaling between these two median redshifts predicts a factor of difference in size, close to actual the difference between the LowZ and HighZ samples.
To illustrate this effect, we scale the radius of each galaxy by a factor of and recompute the size mass relation for each sample. The results are shown in the bottom panel of Fig. 3. Solid curves with error bars show the mean size and the standard error on the mean size. The scaled size – mass relations overlap with each other for the LowZ and MidZ samples. At , the scaled size of HighZ is the same as those for the LowZ and MidZ. This implies that most of the change in the ampltidue of the relation between these samples can be explained by the evolution of the scale of dark matter halos in which their stars form. The rescaled sizes are systematically lower for the HighZ sample (although the statistics are poor; the relations are in marginal agreement taking into account the error on the mean values.
4 Formation and evolution of ETGs
The last section demonstrated that evolution in the characteristic star formation time of galaxies classified as ETGs largely determines the amplitude of the ETG size – mass relation at different redshifts. In this section we explore the drivers of evolution in this relation, namely changes in the sizes and masses of galaxies over time.
4.1 Formation of ETGs
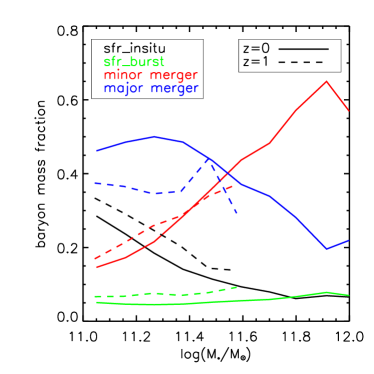
In Fig. 5 we sum the fractional contribution of in situ star formation, starbursts, minor and major mergers to mass growth along the main branch of the galaxy merger tree, for LowZ (solid) and MidZ (dashed) samples. This is done for every galaxy in each sample in bins of stellar mass at ; we then plot the median contribution for each mass bin. Among ‘in situ’ star formation processes, we separate stars formed in merger-induced starbursts (black lines) from stars formed in quiescent disks (green). We separate accrered stars according the mass ratio of their progenitor, using the minor/major merger criterion (red/blue respectively).
The contribution from mergers dominates the growth in stellar mass at all masses. For the LowZ sample, below , major mergers contribute a larger fraction of mass than minor mergers, while at higher masses, minor mergers dominate. The contribution from minor mergers increases with increasing stellar mass, while contribution from major mergers deceases. The MidZ sample does not include galaxies much beyond this transition mass; at lower masses the same trends are apparent, although major mergers become slightly less important relative to quiescent in situ star formation. In situ formation accounts for and of the mass in the LowZ and MidZ samples respectively at low masses, and this contribution decreases with increasing galaxy mass. This limited contribution is not surprising in the context of the ETG selection, which, in the model, isolates objects that are dominated by massive spheroids and/or low star formation rates. The contribution from starbursts is only and for the LowZ and MidZ samples, respectively, over all masses shown. This agrees with previous findings that most mergers that s have experienced were gas poor (Naab, Johansson & Ostriker, 2009; Oser et al., 2012; Hopkins et al., 2009). This is reassuring, because in this regime Eq. 6 is a reasonable approximation to size growth during mergers (Cole et al., 2000).
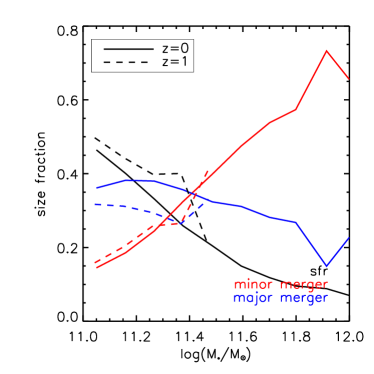
In Fig. 6 we compare the contribution of each of these galaxy-building processes to the change in galaxy size. In the model galaxy mass always increases, but the net change in size for individual galaxies can, in principle, be negative. The average change for galaxies in our ETG samples is positive, however. We combine the contribution of major or minor merger and the starburst it intrigerS and treat them together. Disk instability has neglected effect on size since typically only of the final bulge mass is involved.
The relative contributions of major and minor mergers to size change are very similar to their contribution to the stellar mass. The fraction of size growth attributable to major mergers decreases with final galaxy mass, while the fraction attributable to minor mergers increases. Interestingly, in situ star formation plays a more important role in the size growth of the LowZ sample compared to that in the mass growth, being responsible for to up to 50% of the net increase in size of galaxies with final mass . The importance of in situ star formation decreases very rapidly with increasing stellar mass, as expected from its neglibile contribtion to the stellar mass in this regime. Mergers domiante the growth of the ETG size. We draw similar conclusions from the MidZ sample, in line with the relative differences in the contributions to the stellar mass growth between the two samples.
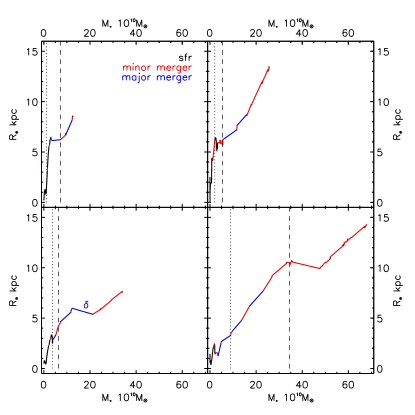
In Fig. 7 we show how four individual ETGs in the model evolved, in order to understand better the average behaviour seen in previous figures. Each time one of these galaxies changes in size and mass, we plot a vector joining the initial and final positions in the size – mass plane. Mass increases monotonically, but size can increase or decrease. The colour of each vector corresponds to the mechanism responsible for the change. At low masses (high redshifts) our example trajectories are dominated by star formation (black), which contributes little to the final mass but induces rapid fluctuations in size. After (dotted vertical lines), however, merging dominates. Consisten with the average behaviour, major mergers (blue) dominate in our lowest mass example and minor mergers (red) become more significant at higher final masses.
There are several notable features in the trajectories shown in Fig. 7. For example, there is no clear distinction in the typical slope (size change per unit additional mass) of the line segments corresponding to major and minor mergers. This is in part because the formula used to compute size change (Eqn. 6 ) explicitly includes the mass ratio – it does not include a sharp boundary between the two classes of merger. In most cases the masses contributed by ’minor’ mergers are almost as large as those contributed by major mergers, suggesting that they are not all that ’minor’ and the distinction is somewhat artificial in this context. Another reason for the lack of a clear distinction is also related to the perhaps surprising result that mergers can have near-zero net size change and, in some cases, even make the remnant more compact than the primary progenitor. In the model this is not due to the dissipation of interaction energy by gas (which is not included) nor to the nuclear starburst (which contributes only a small amount of mass). Rather it is the result of mergers between a diffuse primary and a more compact secondary. Examination of Eqn. 6 shows that this is readily acheived with mergers of moderate mass ratio. An example shown in Fig. 7, where the blue marks a case where size decreaseis after a major merger. Before the merger, the effective radius of the two progenitors are kpc and kpc. The corresponding stellar masses are and . After merger, the size of the remnant is kpc.
4.2 Evolution of high redshift ETGs
In the previous section we considered the contributions to size and mass growth since formation for all galaxies classified as ETGs at a particular epoch. This simulation also allows us to study the related (but not identical) question of how ETG galaxies identified at a particular epoch subsequently evolve. Many authors have considered this question. Cenarro & Trujillo (2009) found the velocity dispersion of ETGs barely evolved since redshift and thus concluded that minor mergers are be responsible for the growth in size. Using hydrodynamical simulations, Naab, Johansson & Ostriker (2009) and Oser et al. (2012) also found that minor mergers are the main cause of ETG size evolution. Here we examine the causes of size growth in the HighZ and MidZ samples draw from the the semi-analytical galaxy formation model.
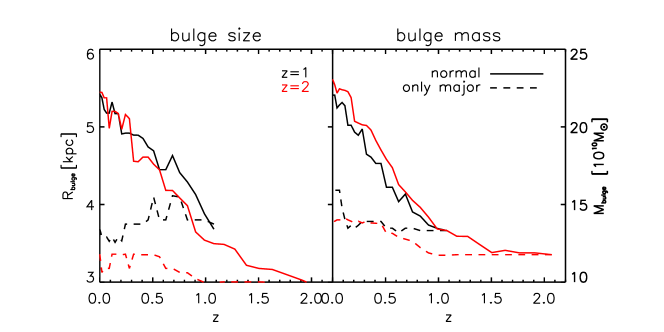
Fig. 8 shows how the average size and mass of HighZ ETGs (red solid lines) and MidZ ETGs (black solid lines) evolve to lower redshift. As these galaxies may re-grow disks, we consider only the bulge component. The evolution of the MidZ sample more or less tracks that of HighZ ETGs, even though most of the MidZ galaxies were not ETGs at . We see that the median bulge mass of HighZETGs increases by a factor of and the median size increases by a factor of . The fractional changes in the MidZ sample are similar ( in mass and in size).
We then switch off minor mergers and disk instabilities after the redshift of selection: stars accreted from satellites during minor mergers are added to the disk rather than the bulge, as are stars formed in bursts associated with these mergers. The resulting size and mass growth is considerably smaller in this case (dashed curves); a factor of in mass and in size between and . Major mergers are therefore only responsible for weak size evolution from ; from they make almost no net contribution to mass growth and even appear to slightly decrease the average size. Clearly, the growth of ETGs in the model is driven by minor mergers, in line with previous findings from semi-analytic models (De Lucia & Blaizot, 2007) and hydrodynamical simulations (Naab, Johansson & Ostriker, 2009; Oser et al., 2012).
5 Conclusion
We use an up-to-date semi-analytic galaxy formation model (Guo et al., 2011) to study the size evolution of massive early type galaxies (ETGs). We find that the typical half light radius of model ETGsselected at is a factor of 1.8 larger than that of galaxies selected in the same way at . This finding is broadly consistent with several recent observational results.
This increase in the typical size of the ETG population can be attributed to two factors related to the fact that different galaxy populations are selected by our fiducial ETGcriteria at different redshifts (the abundance of ETGsdefined by these criteria increases by two orders of magnitude between and , so the majority of present-day ETGscannot have been ETGsat higher redshift).
Firstly, since these criteria do not impose an upper limit on stellar mass, evolution in the shape of the high-mass end of the ETGstellar mass function results in an increasingly large fraction of extremely massive and extended galaxies entering the ETGsample at lower redshifts. However, the median mass increases only by as a result of this effect, which is far from enough to account for the factor of difference in the typical ETGsize.
The second and more significant factor is a ‘real’ difference in the size – stellar mass relation of galaxies selected as ETGsat these different redshifts. We find that the Guo et al. (2011) model reproduces the slope and amplitude of the observed relation from to at the level. This motivates us to explore the origin of this evolution in the model. In the standard CDM cosmology, dark matter halos forming at earlier times are more concentrated. Our model for the initial sizes of gas discs based on the conservation of angular momentum translates this into a smaller average scale for galaxies formed at high redshift. We can demonstrate this by scaling the radii of ETGs according to the time when half of their stars formed; with this rescaling, ETGsamples selected at different redshifts lie on roughly the same median size-mass relation. Hence the increase in amplitude of the relation at lower redshift is mostly explained by increasing numbers of more recently formed galaxies entering the ETGsample.
Mergers, stellar accretion and further in situ star formation during the low redshift evolution of ETGspreserve this formation time dependence, to a greater or lesser extent. Mergers always dominate over star formation in the late-time mass and size growth of ETGs. Minor mergers play a more important role only for ETGs at . Merger-driven starbursts contribute only about , in line with the fact that most mergers are gas poor after . In situ star formation contributes more to size growth than it does to stellar mass growth, though in both cases, it is sub-dominant compared to mergers. We find that ETGs selected at high redshifts grow mainly via minor mergers to their present day configuration. Bulge mass and size grows by a factor of and from to , respectively. Our study of individual galaxies in the model highlights the fact that individual mergers and star formation events can also decrease their size.
We note that the model used here does not take into account the gravitational energy dissipated by gas processes during mergers, which could reduce the size of the remnant. This is most important at higher redshift where gas rich mergers are more common, reflected in the relatively larger size of the model predictions when compared to the data at Shankar et al. (2013).
Most ETGs identified at high redshift evolve into central galaxies at the present day (although most central galaxies today were not ETGsat high redshift). It is interesting to study the progenitors of ETGs identified at different redshifts and their relation with other high redshift populations, such as extremely red galaxies and Lyman-break galaxies. This will be done in a companion work in the near future (Xie et al. in prep).
acknowledgments
We acknowledge support from NSFC grants (Nos 11143005, 11133003 and 11303033 ) and the Strategic Priority Research Program “The Emergence of Cosmological Structure” of the Chinese Academy of Sciences (No. XDB09000000). QG also acknowledges a Royal Society Newton International Fellowship. LR acknowledges the support from Youth Innovation Promotion Association of CAS. LG also acknowledges the MPG partner Group family, and an STFC Advanced Fellowship, as well as the hospitality of the Institute for Computational Cosmology at Durham University.
References
- Baldry et al. (2012) Baldry I. K. et al., 2012, MNRAS, 421, 621
- Bernardi et al. (2010) Bernardi M., Shankar F., Hyde J. B., Mei S., Marulli F., Sheth R. K., 2010, MNRAS, 404, 2087
- Bezanson et al. (2009) Bezanson R., van Dokkum P. G., Tal T., Marchesini D., Kriek M., Franx M., Coppi P., 2009, ApJ, 697, 1290
- Boylan-Kolchin et al. (2009) Boylan-Kolchin M., Springel V., White S. D. M., Jenkins A., Lemson G., 2009, MNRAS, 398, 1150
- Buitrago et al. (2008) Buitrago F., Trujillo I., Conselice C. J., Bouwens R. J., Dickinson M., Yan H., 2008, ApJ, 687, L61
- Cassata et al. (2011) Cassata P. et al., 2011, ApJ, 743, 96
- Cassata et al. (2013) Cassata P. et al., 2013, ApJ, 775, 106
- Cenarro & Trujillo (2009) Cenarro A. J., Trujillo I., 2009, ApJ, 696, L43
- Chabrier (2003) Chabrier G., 2003, PASP, 115, 763
- Cole et al. (2000) Cole S., Lacey C. G., Baugh C. M., Frenk C. S., 2000, MNRAS, 319, 168
- Conselice (2014) Conselice C. J., 2014, ARA&A, 52, 291
- Cooper et al. (2012) Cooper M. C. et al., 2012, MNRAS, 419, 3018
- Covington et al. (2008) Covington M., Dekel A., Cox T. J., Jonsson P., Primack J. R., 2008, MNRAS, 384, 94
- Croton et al. (2006) Croton D. J. et al., 2006, MNRAS, 365, 11
- Daddi et al. (2005) Daddi E. et al., 2005, ApJ, 626, 680
- Damjanov et al. (2011) Damjanov I. et al., 2011, ApJ, 739, L44
- Davis et al. (1985) Davis M., Efstathiou G., Frenk C. S., White S. D. M., 1985, ApJ, 292, 371
- De Lucia & Blaizot (2007) De Lucia G., Blaizot J., 2007, MNRAS, 375, 2
- Dekel et al. (2009) Dekel A. et al., 2009, Nature, 457, 451
- di Serego Alighieri et al. (2005) di Serego Alighieri S. et al., 2005, A&A, 442, 125
- Frenk et al. (1985) Frenk C. S., White S. D. M., Efstathiou G., Davis M., 1985, Nature, 317, 595
- Guo et al. (2011) Guo Q. et al., 2011, MNRAS, 413, 101
- Guo et al. (2013) Guo Q. et al., 2013, MNRAS, 435, 897
- Guo & White (2008) Guo Q., White S. D. M., 2008, MNRAS, 384, 2
- Hilz, Naab & Ostriker (2013) Hilz M., Naab T., Ostriker J. P., 2013, MNRAS, 429, 2924
- Hopkins et al. (2009) Hopkins P. F. et al., 2009, MNRAS, 397, 802
- Huang et al. (2013) Huang S., Ho L. C., Peng C. Y., Li Z.-Y., Barth A. J., 2013, ApJ, 768, L28
- Jaffe (1983) Jaffe W., 1983, MNRAS, 202, 995
- Kauffmann, White & Guiderdoni (1993) Kauffmann G., White S. D. M., Guiderdoni B., 1993, MNRAS, 264, 201
- Lacey & Cole (1993) Lacey C., Cole S., 1993, MNRAS, 262, 627
- Laporte et al. (2013) Laporte C. F. P., White S. D. M., Naab T., Gao L., 2013, MNRAS, 435, 901
- Longhetti & Saracco (2009) Longhetti M., Saracco P., 2009, MNRAS, 394, 774
- McIntosh et al. (2005) McIntosh D. H. et al., 2005, ApJ, 632, 191
- McLure et al. (2013) McLure R. J. et al., 2013, MNRAS, 428, 1088
- Mitchell et al. (2013) Mitchell P. D., Lacey C. G., Baugh C. M., Cole S., 2013, MNRAS, 435, 87
- Naab, Johansson & Ostriker (2009) Naab T., Johansson P. H., Ostriker J. P., 2009, ApJ, 699, L178
- Naab et al. (2007) Naab T., Johansson P. H., Ostriker J. P., Efstathiou G., 2007, ApJ, 658, 710
- Napolitano, Romanowsky & Tortora (2010) Napolitano N. R., Romanowsky A. J., Tortora C., 2010, MNRAS, 405, 2351
- Newman et al. (2012) Newman A. B., Ellis R. S., Bundy K., Treu T., 2012, ApJ, 746, 162
- Oser et al. (2012) Oser L., Naab T., Ostriker J. P., Johansson P. H., 2012, ApJ, 744, 63
- Parry, Eke & Frenk (2009) Parry O. H., Eke V. R., Frenk C. S., 2009, MNRAS, 396, 1972
- Ryan et al. (2012) Ryan, Jr. R. E. et al., 2012, ApJ, 749, 53
- Saracco, Gargiulo & Longhetti (2012) Saracco P., Gargiulo A., Longhetti M., 2012, MNRAS, 422, 3107
- Saracco, Longhetti & Gargiulo (2011) Saracco P., Longhetti M., Gargiulo A., 2011, MNRAS, 412, 2707
- Shankar et al. (2013) Shankar F., Marulli F., Bernardi M., Mei S., Meert A., Vikram V., 2013, MNRAS, 428, 109
- Shen et al. (2003) Shen S., Mo H. J., White S. D. M., Blanton M. R., Kauffmann G., Voges W., Brinkmann J., Csabai I., 2003, MNRAS, 343, 978
- Somerville, Primack & Faber (2001) Somerville R. S., Primack J. R., Faber S. M., 2001, MNRAS, 320, 504
- Springel et al. (2005) Springel V. et al., 2005, Nature, 435, 629
- Springel et al. (2001) Springel V., White S. D. M., Tormen G., Kauffmann G., 2001, MNRAS, 328, 726
- Trujillo (2013) Trujillo I., 2013, in IAU Symposium, Vol. 295, IAU Symposium, Thomas D., Pasquali A., Ferreras I., eds., pp. 27–36
- Trujillo, Ferreras & de La Rosa (2011) Trujillo I., Ferreras I., de La Rosa I. G., 2011, MNRAS, 415, 3903
- Trujillo et al. (2006) Trujillo I. et al., 2006, MNRAS, 373, L36
- van der Wel et al. (2005) van der Wel A., Franx M., van Dokkum P. G., Rix H.-W., Illingworth G. D., Rosati P., 2005, ApJ, 631, 145
- van der Wel et al. (2014) van der Wel A. et al., 2014, ArXiv e-prints
- van der Wel et al. (2008) van der Wel A., Holden B. P., Zirm A. W., Franx M., Rettura A., Illingworth G. D., Ford H. C., 2008, ApJ, 688, 48
- van Dokkum et al. (2008) van Dokkum P. G. et al., 2008, ApJ, 677, L5
- van Dokkum et al. (2010) van Dokkum P. G. et al., 2010, ApJ, 709, 1018
- White & Frenk (1991) White S. D. M., Frenk C. S., 1991, ApJ, 379, 52
- White & Rees (1978) White S. D. M., Rees M. J., 1978, MNRAS, 183, 341
- Williams et al. (2009) Williams R. J., Quadri R. F., Franx M., van Dokkum P., Labbé I., 2009, ApJ, 691, 1879
- Williams et al. (2010) Williams R. J., Quadri R. F., Franx M., van Dokkum P., Toft S., Kriek M., Labbé I., 2010, ApJ, 713, 738