Neutron inelastic scattering measurements of low energy phonons in the multiferroic BiFeO3
Abstract
We present neutron inelastic scattering measurements of the low-energy phonons in single crystal BiFeO3. The dispersions of the three acoustic phonon modes (LA along [100], TA1 along [010] and TA2 along ) and two low energy optic phonon modes (LO and TO1) have been mapped out between 300 K and 700 K. Elastic constants are extracted from the phonon measurements. The energy linewidths of both TA phonons at the zone boundary clearly broaden when the system is warmed toward the magnetic ordering temperature K. This suggests that the magnetic and low-energy lattice dynamics in this multiferroic material are coupled.
I Introduction
Being both ferroelectric and antiferromagnetic at room temperature, BiFeO3 holds tantalizing promise for novel device applications and has become one of the most studied multiferroic materials. Catalan and Scott (2009) The direct coupling between the static ferroelectric order ( K) Palewicz et al. (2007, 2010) and antiferromagnetic order ( K) is relatively weak, resulting in a cycloidal spin structure with long wavelength modulations ( Å). Sosnowska et al. (1982) Yet there has been a growing interest in the coupling between dynamical properties in recent years. For example, a “magneto-optical” resonance has been proposed theoretically, de Sousa and Moore (2008) and extra modes located below the lowest-lying optic phonon energies have been observed in Raman measurements. Cazayous et al. (2008); Kumar et al. (2008); Rovillain et al. (2010); Kumar et al. (2011) Zone-center optic phonon modes have been studied extensively using Raman spectroscopy Hlinka et al. (2011); Palai et al. (2010); Haumont et al. (2006); Rovillain et al. (2009) and infrared reflectivity. Lobo et al. (2007) A full understanding of the energy-momentum dependence of the dynamics in BiFeO3 is, however, still far from complete. Only with the recent achievements in the growth of large BiFeO3 single crystals have researchers been able to start carrying out neutron inelastic and x-ray scattering measurements on both the lattice and spin dynamics Xu et al. (2012); Jeong et al. (2012); Matsuda et al. (2012); Delaire et al. (2012); Borissenko et al. (2013).
In this paper we present neutron inelastic scattering measurements of the low-energy phonon modes in a large BiFeO3 single crystal from 300 K to 700 K. The dispersions of the three acoustic phonon modes (TA1, propagating along [010] and polarized along [100]; TA2, propagating along and polarized along [110]; and LA, propagating and polarized along [100]), and the lowest-lying optic modes are mapped out in three different Brillouin zones. The measured phonon dispersions and intensities (after removing the Bose-factor) show no significant change with temperature outside of experimental errors. However, the transverse acoustic modes at the zone-boundary clearly broaden in energy when the sample is heated towards ; this suggests that a coupling exists between the low-energy lattice and antiferromagnetic dynamics in this multiferroic system.
II Experiment
Single crystals of BiFeO3 were grown using the traveling-solvent floating-zone technique. Ito et al. (2011) The crystal used in this study has a cylindrical shape, a mass of 4 g, and a mosaic full width at half-maximum (FWHM) of less than 1∘. Neutron inelastic scattering experiments were performed on the HYSPEC time-of-flight spectrometer Stone et al. (2014), which is located at the Spallation Neutron Source (SNS) at Oak Ridge National Laboratory. The incident neutron energy was fixed at 20 meV. We will refer to the pseudo-cubic unit cell with Å when describing our results. In this coordinate system the magnetic ordering wave vector is (0.5,0.5,0.5). The crystal -axis was oriented vertically to allow access to reflections of the form in the horizontal scattering plane. During the measurements the crystal was rotated about the -axis by 90∘ in steps of 2∘ in order to provide full coverage of the reciprocal lattice scattering plane (within kinematical constraints).
III Results and Discussion
In Fig. 1, we plot the dynamic response function , which is simply the measured neutron scattering intensity divided by the Bose factor, at 300, 500, and 700 K. Each panel contains data obtained from two-dimensional (2D) slices through energy-momentum space. The left panels show LA phonons propagating along [100] between the points at (100) and (200). The center panels show phonons propagating along between (110) and (200). Near the (110) zone center these are TA2 and TO2 modes. The right panels show phonons propagating along [010] between (200) and (210), which are TA1 and TO1 phonons near (200). We see that whereas the LA, TA1, and TA2 phonons are all well defined, the optic modes are much less clear in our measurements. In particular, the structure factor of the TO2 mode near (110) is extremely weak and can barely be observed.
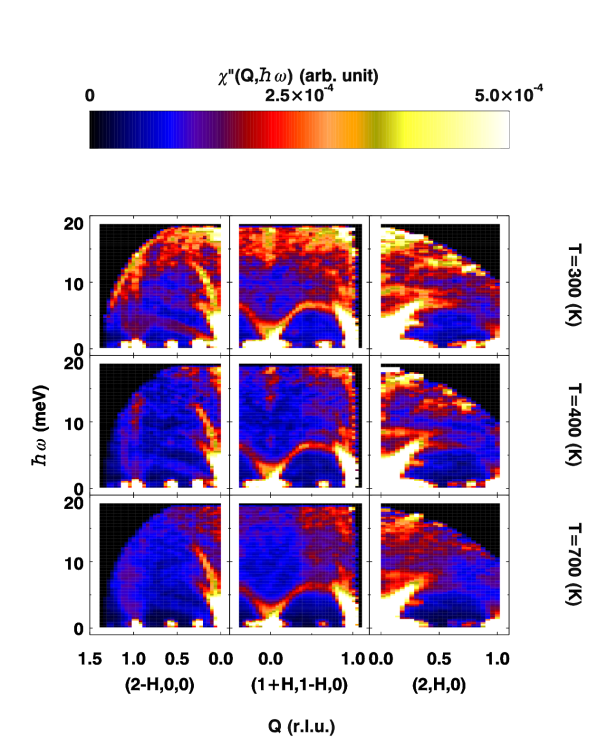
The data in Fig. 1 reveal no significant changes in the overall features of the dynamic response in BiFeO3 between 300 K and 700 K. To obtain more detailed information, we fit these data using Lorentzian functions of convoluted with the Gaussian instrumental resolution function to extract the acoustic and optic phonon intensities vs. energy transfer at various wave vectors . The phonon energy, energy width (), and intensity were also obtained from these fits.
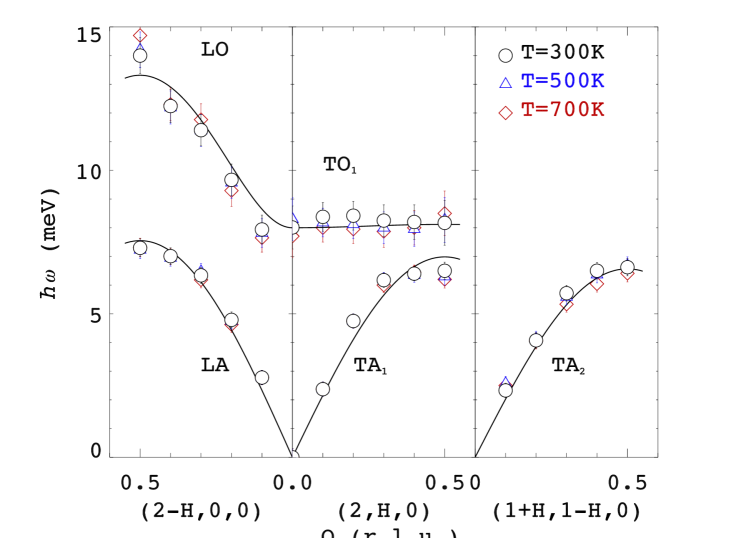
The phonon dispersions obtained from the fits are shown in Fig. 2. We note here that all uncertainties and error bars in this and subsequent figures represent standard deviations. The energies of all acoustic modes show little to no temperature variation, especially in the long wave-length (small ) limit. Near the zone boundary a slight softening on warming is observed for the TA1 mode near (2,0.5,0) and for the TA2 mode near (1.5,0.5,0). However the size of this softening is meV, which is comparable to our experimental uncertainty. The optic phonon intensities are considerably weaker than those of the acoustic phonons, and consequently the optic phonon energies have larger error bars. The TO2 phonon intensity near the (110) zone center is particularly weak (Fig. 1, middle column), and for this reason we were not able to determine the TO2 phonon dispersion along . In the other two zones, the TO1 mode propagating along [100] is almost flat, while the LO mode measured along [100] is quite steep. Similar to the negligible softening observed for the zone-boundary acoustic modes, the zone-center optic modes also show a slight decrease in energy on warming. But the zone-boundary optic mode energies exhibit a slight increase instead.
Our results are generally consistent with the neutron inelastic scattering measurements of Delaire et al. on powder samples of BiFeO3. Delaire et al. (2012) They found that the lowest-energy optic phonon branch bottoms out around 8 meV and that the top of the TA branch is close to 6.5 meV. From Fig. 2, one can see that the relevant energies are roughly 8.0 meV (lowest TO phonon energy) and 6.5 meV (top of the TA phonon branch). The value of 8.0 meV is also close to the 57 cm-1 line observed via Raman scattering Palai et al. (2010) and the 66 cm-1 line seen in infrared measurements, Lobo et al. (2007) both of which probe zone-center () optic modes. Other Raman Hlinka et al. (2011) and x-ray inelastic scattering studies Borissenko et al. (2013) suggest that the lowest-energy TO mode is around 9.2 meV. However our results show that a zone-center optic mode is present at 8 meV, clearly below 9 meV, as is illustrated in Figs. 1 and 2.
Based on the measured acoustic phonon branches, a number of useful bulk parameters such as the elastic constants can be obtained. Neighbours and Schacher (1967) Here we make use of the expression
| (1) |
where is the phonon velocity for the TA1, TA2 or LA modes, g/cm3 is the density of BiFeO3, and is the effective elastic constant, where for the LA mode along [100], for the TA1 mode along [100], and for the TA2 mode along .
| Mode | Propagation vector | Polarization vector | Velocity (m/s) |
|---|---|---|---|
| LA | [100] | [100] | 2.6(5) |
| TA1 | [100] | [010] | 2.2(4) |
| TA2 | [110] | 1.6(3) |
The acoustic phonon velocities were obtained from the limiting slopes of the 300 K dispersion curves shown in Fig. 2 and are are listed in Table I. From these we obtain GPa, GPa, GPa, and the bulk modulus GPa. We note that the room temperature values of the longitudinal elastic constant derived from previous experimental Borissenko et al. (2013); Smirnova et al. (2011); Doig et al. (2013) and theoretical work Goffinet et al. (2009); Shang et al. (2009) on BiFeO3 are highly inconsistent. The value of ranges from GPa (our neutron measurements), to GPa (ultrasonic measurements), to GPa (x-ray inelastic measurements). We believe that the difference between our results and those from the ultrasonic measurements is an artifact of comparing for a single crystal sample to for a ceramic sample. is determined by the longitudinal acoustic phonon velocity along [100]. When the LA phonon velocities along other crystallographic directions are higher, a powder/ceramic average will lead to a larger value of . With respect to the x-ray scattering measurements in Ref. Borissenko et al., 2013, we note that a different coordinate system with trigonal symmetry was used along with a different definition of . For the purpose of obtaining bulk properties in the pseudo-cubic coordinate system, our results provide a direct reference for the acoustic phonon velocities and elastic constants.
In addition to the acoustic modes and low-energy optic modes discussed above, we have also observed a few spurious signals in our measurements. For example, one can see a faint streak of intensity originating from the (200) Bragg peak in the top-left panel of Fig. 1 that increases to about 4 meV at (1.5,0,0), thus resembling a phonon branch below the LA branch. The intensity of this spurion has no temperature dependence, which is why when is plotted in Fig. 1 (and the Bose factor is divided out) it appears to weaken at higher temperatures. When we checked the energy gain side of our scattering data, we found no trace of this spurion, which does not happen with real phonons. We believe it is most likely caused by spurious intensities coming from detectors located close to the strong (200) Bragg peak. We also looked for, but did not detect, any extra modes that resemble the “electromagnon” excitations observed by Raman measurements Cazayous et al. (2008); Kumar et al. (2008); Rovillain et al. (2010); Kumar et al. (2011).
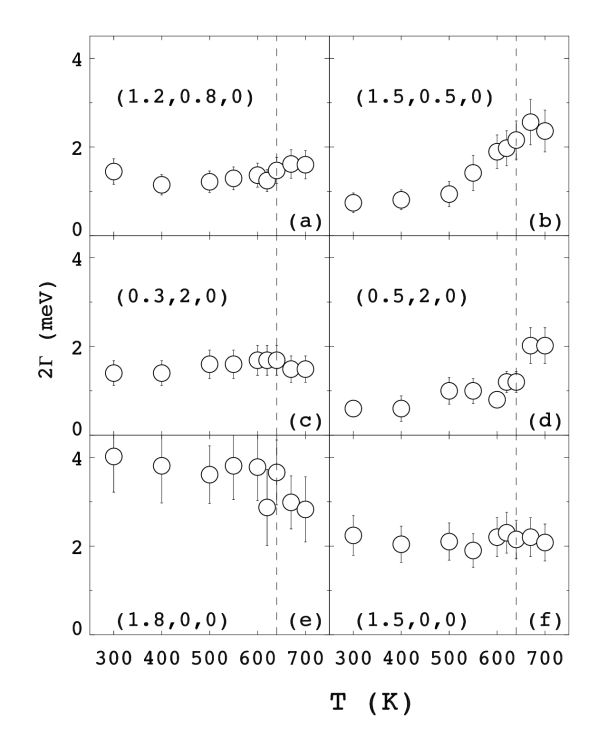
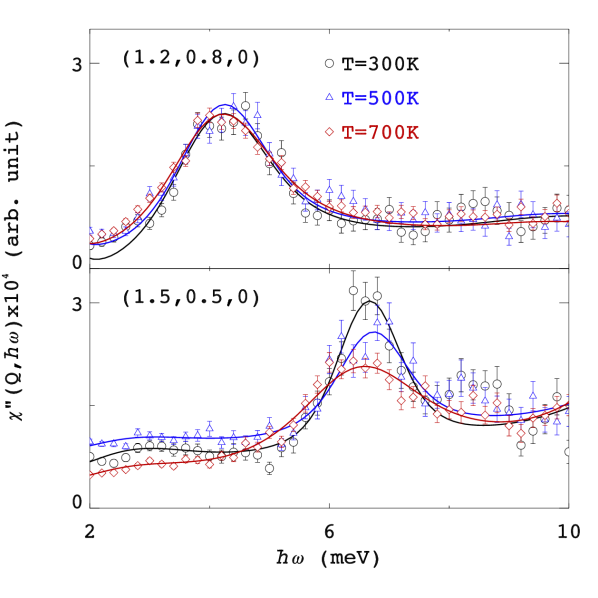
Fig. 3 shows energy scans for the TA2 mode () at two different wave vectors. The intensities correspond to the dynamic response function (measured scattering intensity divided by the Bose factor). For small values of , like that shown in the top panel, there is virtually no change of between 300 K and 700 K. But at the zone boundary (), as shown in the bottom panel, we observe a clear broadening of the phonon linewidth that is accompanied with a slight softening as the temperature increases towards K. We see some evidence of an optic phonon located near 8.5 meV in the bottom panel of Fig. 3, however it is so weak that we are unable to fit it in a meaningful way. Fortunately it does not affect our measurement of the TA2 phonon linewidth. We also observe a broadening of the zone-boundary TA1 mode, but none is seen for the zone-boundary LA mode. A plot of the phonon energy widths between 300 K and 700 K for different is shown in Fig. 4. Here we see that only in panels (b) and (d), which are the zone boundary positions for the TA1 and TA2 modes, do the phonon energy widths increase on heating close to . For all other wave vectors there is very little temperature dependence to the phonon energy widths.
This anomaly in the TA phonon energy width is unlikely to be the result of pure thermal broadening because it correlates well with and is not seen at other wave vectors. Previous neutron scattering measurements of the phonon density-of-states (DOS) in powdered BiFeO3 Delaire et al. (2012) reveal a strong anharmonicity as evidenced by phonon softening and broadening on warming. These DOS measurements are mostly focused on the optic modes; by contrast, our measurements show that the acoustic phonons in BiFeO3 are well defined and display no significant energy broadening or softening from 300 K to 700 K for small . Signs of anharmonicity only occur for TA phonons at the zone-boundaries.
The fact that the TA phonon broadening at the zone boundary becomes pronounced when the Nèel temperature is approached and the magnetic order starts to melt implies a possible connection between the TA phonons and the magnetic phase transition. Previous Raman measurements Haumont et al. (2006); Rovillain et al. (2009) have suggested that certain optic phonon modes also behave anomalously near , which is indicative of a spin-phonon coupling in this multiferroic material and possibly other multiferroic perovskites. Stock et al. (2013) Our results show that the effects of spin-phonon coupling also extend to the TA phonons. It is possible that this anomalous zone-boundary TA phonon broadening is a combination of spin-polar phonon (TO mode) coupling and TA-TO phonon coupling. While the lowest-lying TO phonon can be affected by the magnetic order near based on results from the optic measurements, the coupling between the TA and TO modes can lead to the anomalies in the TA branches as well. The coupling is strongest at zone-boundaries because the energy difference between the two modes decreases at large . This can also explain the lack of energy broadening in the LA mode, as the LO phonon energy is much higher at zone boundary and the LO-LA coupling there should be significantly weaker. Although the underlying mechanism of this coupling in BiFeO3 is not entirely clear, it is evident that the melting of the magnetic order at correlates with a decrease in the zone-boundary TA phonon lifetime, which suggests the development of a lattice instability.
IV Summary
Using neutron time-of-flight spectroscopy we have measured the dispersions of the LA, TA1, and TA2 phonon modes for a single crystal of BiFeO3 and determined the elastic constants , , and . The lowest energy TO and LO phonon dispersions were also measured, and these are consistent with previous Raman and infrared studies. Our results suggest that the zone-center optic mode energy softens slightly on warming. Most importantly, the transverse acoustic phonons measured at the zone boundary clearly broaden in energy when is approached from below. This indicates that the acoustic phonon modes and magnetic excitations are coupled in this multiferroic material.
Acknowledgments
JAS, ZJX, GDG, SMS, and GYX acknowledge support by Office of Basic Energy Sciences, U.S. Department of Energy under contract No. DE-AC02-98CH10886. JW and RJB are also supported by the Office of Basic Energy Sciences, U.S. Department of Energy through contract No. DE-AC02-05CH11231. This research at the Oak Ridge National Laboratory Spallation Neutron Source was sponsored by the Scientific User Facilities Division, Office of Basic Energy Sciences, U. S. Department of Energy. CS acknowledges the Carnegie Trust for the Universities of Scotland and the Royal Society. TI is partly supported by the Mitsubishi Foundation.
References
- Catalan and Scott (2009) G. Catalan and J. F. Scott, Advanced Materials 21, 2463 (2009).
- Palewicz et al. (2007) A. Palewicz, R. Przenioslo, I. Sosnowska, and A. W. Hewat, Acta Crystal. B 63, 537 (2007).
- Palewicz et al. (2010) A. Palewicz, I. Sosnowska, R. Przenioslo, and A. W. Hewat, Acta Physica Polonica A 117, 296 (2010).
- Sosnowska et al. (1982) I. Sosnowska, T. P. Neumaier, and E. Steichele, Journal of Physics C: Solid State Physics 15, 4835 (1982).
- de Sousa and Moore (2008) R. de Sousa and J. E. Moore, Phys. Rev. B 77, 012406 (2008).
- Cazayous et al. (2008) M. Cazayous, Y. Gallais, A. Sacuto, R. de Sousa, D. Lebeugle, and D. Colson, Phys. Rev. Lett. 101, 037601 (2008).
- Kumar et al. (2008) A. Kumar, N. M. Murari, and R. S. Katiyara, Appl. Phys. Lett. 92, 152907 (2008).
- Rovillain et al. (2010) P. Rovillain, R. de Sousa, Y. Gallais, A. Sacuto, M. A. Measson, D. Colson, A. Forget, M. Bibes, A. Barthelemy, and M. Cazayous, Nature Materials 9, 975 (2010).
- Kumar et al. (2011) A. Kumar, J. F. Scott, and R. S. Katiyar, Appl. Phys. Lett. 99, 062504 (2011).
- Hlinka et al. (2011) J. Hlinka, J. Pokorny, S. Karimi, and I. M. Reaney, Phys. Rev. B 83, 020101 (2011).
- Palai et al. (2010) R. Palai, H. Schmid, J. F. Scott, and R. S. Katiyar, Phys. Rev. B 81, 064110 (2010).
- Haumont et al. (2006) R. Haumont, J. Kreisel, P. Bouvier, and F. Hippert, Phys. Rev. B 73, 132101 (2006).
- Rovillain et al. (2009) P. Rovillain, M. Cazayous, Y. Gallais, A. Sacuto, R. Lobo, D. Lebeugle, and D. Colson, Phys. Rev. B 79, 180411 (2009).
- Lobo et al. (2007) R. P. S. M. Lobo, R. L. Moreira, D. Lebeugle, and D. Colson, Phys. Rev. B 76, 172105 (2007).
- Xu et al. (2012) Z. Xu, J. Wen, T. Berlijn, P. M. Gehring, C. Stock, M. B. Stone, W. Ku, G. Gu, S. M. Shapiro, R. J. Birgeneau, and G. Xu, Phys. Rev. B 86, 174419 (2012).
- Jeong et al. (2012) J. Jeong, E. A. Goremychkin, T. Guidi, K. Nakajima, G. S. Jeon, S.-A. Kim, S. Furukawa, Y. B. Kim, S. Lee, V. Kiryukhin, S.-W. Cheong, and J.-G. Park, Phys. Rev. Lett. 108, 077202 (2012).
- Matsuda et al. (2012) M. Matsuda, R. S. Fishman, T. Hong, C. H. Lee, T. Ushiyama, Y. Yangisawa, Y. Tomioka, and T. Ito, Phys. Rev. Lett. 109, 067205 (2012).
- Delaire et al. (2012) O. Delaire, M. B. Stone, J. Ma, A. Huq, D. Gout, C. Brown, K. F. Wang, and Z. F. Ren, Phys. Rev. B 85, 064405 (2012).
- Borissenko et al. (2013) E. Borissenko, M. Goffinet, A. Bosak, P. Rovillain, M. Cazayous, D. Colson, P. Ghosez, and M. Krisch, J. Phys. Cond. Matt. 25, 102201 (2013).
- Ito et al. (2011) T. Ito, T. Ushiyama, Y. Yanagisawa, R. Kumai, and Y. Tomioka, Crystal Growth & Design 11, 5139 (2011).
- Stone et al. (2014) M. B. Stone, J. L. Niedziela, D. L. Abernathy, L. DeBeer-Schmitt, G. Ehlers, O. Garlea, G. E. Granroth, M. Graves-Brook, A. I. Kolesnikov, A. Podlesnyak, and B. Winn, Rev. of Sci. Inst. 85, 045113 (2014).
- Neighbours and Schacher (1967) J. R. Neighbours and G. E. Schacher, J. Appl. Phys. 38, 5366 (1967).
- Smirnova et al. (2011) E. P. Smirnova, A. Sotnikov, S. Ktitorov, N. Zaitseva, H. Schmidt, and M. Weihnacht, Euro. Phys. J. B 83, 39 (2011).
- Doig et al. (2013) K. I. Doig, F. Aguesse, A. K. Axelsson, N. M. Alford, S. Nawaz, V. R. Palkar, S. P. P. Jones, R. D. Johnson, R. A. Synowicki, and J. Lloyd-Hughes, Phys. Rev. B 88, 094425 (2013).
- Goffinet et al. (2009) M. Goffinet, P. Hermet, D. I. Bilc, and P. Ghosez, Phys. Rev. B 79, 014403 (2009).
- Shang et al. (2009) S. L. Shang, G. Sheng, Y. Wang, L. Q. Chen, and Z. K. Liu, Phys. Rev. B 80, 052102 (2009).
- Stock et al. (2013) C. Stock, S. R. Dunsiger, R. A. Mole, X. Li, and H. Luo, Phys. Rev. B 88, 094105 (2013).