Validation of a new background discrimination method for the TACTIC TeV -ray telescope with Markarian 421 data
Abstract
This paper describes the validation of a new background discrimination method based on Random Forest technique by re-analysing the Markarian 421 (Mrk 421) observations performed by the TACTIC (TeV Atmospheric Cherenkov Telescope with Imaging Camera) -ray telescope. The Random Forest technique is a flexible multivariate method which combines Bagging and Random Split Selection to construct a large collection of decision trees and then combines them to construct a common classifier. Markarian 421 in a high state was observed by TACTIC during December 07, 2005 - April 30, 2006 for 202 h. Previous analysis of this data led to a detection of flaring activity from the source at Energy 1 TeV. Within this data set, a spell of 97 h revealed strong detection of a -ray signal with daily flux of Crab unit on several days. Here we re-analyze this spell as well as the data from the entire observation period with the Random Forest method. Application of this method led to an improvement in the signal detection strength by along with a increase in detected rays compared to the conventional Dynamic Supercuts method. The resultant differential spectrum obtained is represented by a power law with an exponential cut off and TeV. Such a spectrum is consistent with previously reported results and justifies the use of Random Forest method for analyzing data from atmospheric Cherenkov telescopes.
keywords:
Classification , Multivariate , Random Forest , IACT1 Introduction
The active galactic nucleus (AGN) Markarian (Mrk) 421 is the first extragalactic source observed in the TeV energy range [1]. It is one of the blazars most widely observed by Imaging Atmospheric Cherenkov Technique (IACT). The observation of this source by various telescopes has produced a great wealth of scientific insights into the working of blazars in the TeV energy regime. Flux variation on varied time scales from as small as few minutes to as large as few years has turned this source into a laboratory for understanding the high energy emission mechanisms. The flux doubling time of as short as minutes [2] as well as flux variation by more than one order of magnitude [3] have also been observed.
Mrk421 in the high state was observed in by various IACTs. The MAGIC telescope observed this source from April 22 to April 30, 2006 [4]. The Whipple telescope [5] carried out the observation in April and June 2006. This source was also observed by the TACTIC telescope from 27 December 2005 - 30 April 2006 for a total of h [6]. Previous analysis of a spell of h of this data revealed strong detection of a -ray signal with daily flux of Crab unit at Energy TeV. The analysis was carried out by the Dynamic Supercuts method [7]. Here we re-analyze the entire data set using a tree based classifier method named Random Forest. The earlier efforts to employ multivariate methods for /hadron segregation were initiated by Bock et. al. [8]. Later on, the effectiveness of tree based classifiers was demonstrated by two operational IACT systems, MAGIC [9] and HESS [10, 11, 12, 13]. In particular, the Random Forest method was employed by the MAGIC telescope [14].
The structure of the paper is as follows: The first section presents a short description of the TACTIC telescope. Next section describes the database used in training the Random Forest. The subsequent section compares the excess -ray events obtained by Random Forest method for different spells of observation with respect to the previously reported results [6]. Finally, we conclude this paper by estimating the energy spectrum of Mrk 421.
2 The TACTIC Telescope
The TACTIC -ray telescope [15] has been in operation at Mt. Abu (, m asl) in Western India for the study of TeV -ray emissions from celestial sources. The telescope employs a 349-pixel photomultiplier tube imaging camera with a uniform pixel resolution of and a field-of-view to collect atmospheric Cherenkov events generated by extensive air shower due to charged cosmic-rays or -rays. The TACTIC telescope uses an F/1 type tracking light-collector of m2 area. It consists of 34 front-face aluminum-coated glass spherical mirrors of 60 cm diameter each with a focal length 400cm. The innermost 121 pixels (11 11 matrix) are used for generating the event trigger based on the philosophy of Nearest Neighbor Pairs (NNP). The telescope has a pointing and tracking accuracy of better than 3 arc-minutes. The tracking accuracy is checked on a regular basis with so called “pointing runs”, where an optical star having its declination close to that of the candidate -ray source is tracked continuously for about 5 hours. The pointing run calibration data is then incorporated so that appropriate corrections can be applied. TACTIC records cosmic-ray events with a rate of 2.0 Hz at a typical zenith angle of and is operating at a -ray threshold energy of 1 TeV. The TACTIC readout employs charge integration over the full gating window.
3 Image parameters for classification
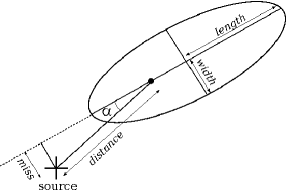
The spatial distribution of Cherenkov photons on the image plane of the camera is known as the “image”. The parameters used to describe the image are known as the Hillas parameters [16]. A typical spatial distribution of Cherenkov photons on the camera can be parameterized as an ellipse. Figure 1 shows the schematic representation of Hillas parameters. The rms spread of Cherenkov light along the major/minor axis of image is known as the length/width of an image. The length and width parameter are a measure of the lateral and vertical development of the shower. The distance parameter represents the distance from the image centroid to the centre of the field of view. It is a crude measure of the core distance of the -ray initiated shower. The image parameter frac2 represents the degree of light concentration. It is defined as the ratio of the sum of the two highest pixel signal to the sum of all the signals. The size parameter represents the total number of photoelectrons contained in the Cherenkov image. The parameter is the angle of the image and a line joining the centroid of the image to the centre of the field of view. It is a measure of the orientation of the shower axis.
Above image parameters were used as classifying parameters for /hadron segregation. In addition to the above parameters, a new derived parameter “dens”, defined [14] as
| (1) |
was used.
3.1 Monte Carlo and real data samples used for the method validation
The TACTIC telescope observed Mrk 421 for a total of h between December - April . The source was observed for six different lunations labeled as Spell I - Spell VI. The observation was restricted to zenith angles
A Monte Carlo simulation database was generated by using the CORSIKA air shower code [17]. The simulations were carried out [18] for the Mount Abu observatory altitude (m). A total of 74000 -ray events in the energy range from 1-20 TeV were generated according to differential spectral index . These events were generated at five zenith angles: , , , and . Because of the technical limitation of Monte Carlo simulation, zenith angles have discrete values whereas the observational hadrons have a continuous distribution in zenith angle. It is important to take this fact into account. The simulated training sample was prepablack in such a way that the zenith angle distribution as well as the size distribution for and hadron showers were as close as possible to those of the real data. We approximated all the observational zenith angles between by , by etc. The camera trigger was simulated, taking into account photon losses due to wavelength dependent photon absorption, reflection coefficient of the mirror facets, light concentrators used in the camera and the quantum efficiency of photomultiplier tubes. All the triggeblack events underwent the usual image cleaning procedure [19] to eliminate the background noise. In order to have a robust and well contained image inside the camera, prefiltering cuts of size (photoelectrons) and distance were applied. It yielded a total of events for -rays. It is not advisable to use Monte Carlo hadrons while using the observation data because the hadronic showers have large fluctuations. Moreover, the generation of hadron showers is much more time consuming owing to very small trigger probability. In the presence of ON or OFF source observational data, there is no need to use the simulated hadrons, the cosmic ray hadrons from the observation can be used. In the present study, the actual events recorded by the TACTIC telescope are used instead of simulated hadrons.
4 /hadron classification methods
The problem of /hadron segregation is formulated as a two class problem: Viz -ray showers represent one class, hadronic showers represent the second. Here we will apply the Random Forest method for /hadron classification. As mentioned earlier [6], the previous analysis of this data was carried out by using the Dynamic Supercuts method. Both methods are described below.
4.1 Dynamic Supercuts method
In the conventional Hillas parameter technique, various sequential cuts in the image parameters are applied so as to maximize the -ray like signal and reject maximum number of background events. However, this scheme has a disadvantage because the width and length parameters grow with the primary energy. It is observed that width and length of an image are well correlated with the logarithm of size. The size of the image provides an estimate of the primary energy. The process of scaling the width and length parameters with the size parameter is known as the Dynamic Supercuts method. By employing this method, the optimal number of cut parameters and their values were estimated by numerically maximizing (over the Hillas parameters) the so called “quality factor [20], defined as
| (2) |
Here and are and hadron acceptances respectively. The set of image parameters after quality factor maximization are shown in (Table 1).
| Parameter | Cut Values |
|---|---|
| LENGTH (L) | |
| WIDTH (W) | |
| DISTANCE (D) | ;(zenith ang.) |
| SIZE (S) | ;(6.5 digital counts1.0 pe ) |
| ALPHA () | |
| FRAC2 (F2) |
4.2 Random Forest Method
This is a multivariate method based on the aggregation of a large number of decision trees. In this method, Bagging and Random Split Selection is combined to construct a common classifier. The Random Forest algorithm was developed by Leo Breiman and Adele Cutler 222http://www.stat.berkeley.edu/ breiman/RandomForests/. The decision trees are constructed by partitioning the dataset recursively. Tree construction begins with the root node containing the entire dataset and ends at the leaf node. Every node is then assigned a class. Finally a voting decides on the class assignment for each event. For a detailed description of the Random Forest method, the reader is referblack to our recent work [21] as well as [9].
5 /hadron discrimination using the Random Forest method
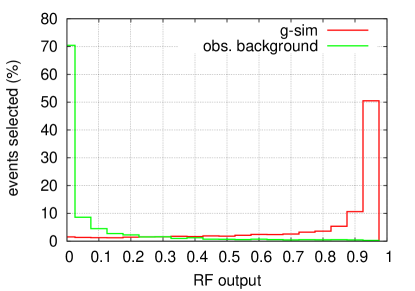
A total of simulated -ray events were obtained from simulation after applying the precuts defined in the earlier section. In order to have a balanced data set for and hadrons, we extracted a total of events from the ON source observations (with ) available from Mrk 421 and Crab Nebula observations carried out in . A total of events each from Mrk 421 and Crab Nebula observations were extracted respectively. The ON source events above this alpha range are pblackominantly background events. There is a possibility of a small gamma contamination above but the Random Forest algorithm is sufficiently stable to deal with contamination. This was checked by successively contaminating a proton Monte Carlo sample with Monte Carlo gammas. In total, events from the -sample and of the events from the hadron-sample were employed to train the Random forest and the remaining events were used as a test sample. The frequency distribution of pblackicted and hadron events from Random Forest for a test sample containing 17820 and background events as a function of Random Forest cut value is shown in Figure 2. For determining the output cutoff value from the Random Forest method to optimize the separation of the two event classes, we maximized the statistical significance () of the signal following [8]. The statistical significance is defined as
| (3) |
where and are the number of -rays and hadrons, after classification, respectively. A cut value of was chosen on the basis of optimized significance. It is to be noted that the present cut value is obtained by carrying out the simulation for the Crab Nebula. Once the significance is optimized, the same cut value is used for Mrk421.

6 Application of Random Forest method for Mrk 421 observation
The recorded data with the telescope was subjected to the standard image cleaning procedure [22] by using the picture and boundary threshold of and . All such events were processed to characterize the images using the Hillas parameters. Typically -ray events have narrow elliptical shapes whereas hadronic events are more irregular. These differences in image shape are used for segregating / hadron events. The Dynamic Supercuts method yields an excess of -ray events with a statistical significance of 11.5 [6].
6.1 Alpha plot analysis for Mrk 421 using Random Forest method
The distribution determines the excess number of -ray events. The background events were extracted from whereas defines the region of signal events. Before employing the Random Forest for Mrk421 data, we validated the method by analyzing the Crab Nebula data observed during nearly the same lunation (November 10, 2005 to January 30, 2006). The Random forest method yielded a total of () events for a total of h of observation. The same data was analyzed by restricting the zenith angle of observation from 15-45∘, a zenith angle range similar to that of Mrk 421 observation. A total of events were obtained in an observation time of h with a corresponding ray rate of ) h-1. This -ray rate is designated as a reference of 1 Crab Unit (CU). The same trained forest was employed for estimating the number of excess events as well as the energy spectrum for Mrk 421. All the observation spells were analyzed individually. Table 2 shows the spell wise analysis.
| Spell | Obs. time | -ray | -ray rate | Significance |
| ( h. ) | events | (h-1) | () | |
| I | 9.24 | 23 (9) | 2.49 (0.97) | 1.7 (0.4) |
| II | 35.71 | 322 (275) | 9.01 (7.70) | 6.9 (5.8) |
| III | 61.53 | 730 (676) | 11.86 (10.99) | 13.8 (10.6) |
| IV | 34.54 | 131 (91) | 3.79 (2.64) | 3.2 (1.9) |
| V | 31.14 | 100 (61) | 3.38(1.96) | 3.2 (1.6) |
| VI | 29.55 | 151 (123) | 5.10 (4.16) | 4.0 (3.8) |
| All data | 201.72 | 1457 (1236) | 7.22 (6.13) | 14.6 (11.5) |
| II +III | 97.24 | 1052 (951) | 10.82 (9.78) | 13.8 (12.00) |
The significance of the signal was calculated by using Li & Ma [23].

The data from all the spells (I-VI) yielded a total of events with a statistical significance of 14.6 . Figure 3 shows the plot for the Mrk 421 source for the entire observation h. It demonstrates that compablack to the Dynamic Supercuts method, which produced a total of events with a statistical significance of 11.5 , the Random Forest method leads to an improvement in the excess events by and significance by .
7 Energy spectrum of Mrk 421
The primary -ray energy reconstruction was carried out by applying the Artificial Neural Network method (ANN) [6]. The -ray energy reconstructed with a single imaging telescope, in general, is a function of image size, distance and zenith angle. The energy estimation was carried out by employing a 3:30:1 ( i.e. 3 nodes in the input layer, 30 nodes in hidden layer and 1 node in the output layer) configuration of ANN with a back propagation training algorithm [24]. We used a total of 10,000 -ray showers for training the network. The showers were generated at five zenith angles (, , , and ). The effective area as a function of zenith angles and energy was estimated by the standard procedure [7]. The trained network provided the weights which were employed to estimate the energy of excess -ray events.
The differential photon flux per energy bin is a direct function of zenith angle, energy-dependent effective area and -ray retention. Eventually, the spectrum was obtained by using the formula
| (4) |
where and are the number of events and the differential flux at energy , measublack in the ith energy bin and over the zenith angle range of 0∘-45∘ respectively. is the observation time in the jth zenith angle bin with corresponding energy-dependent effective area () and -ray acceptance (). The 5 zenith angle bins (j=1-5) used are 0∘-10∘, 10∘-20∘, 20∘-30∘, 30∘-40∘ and 40∘-50∘ with effective collection area and -ray acceptance values available at 5∘, 15∘, 25∘, 35∘ and 45∘. The number of -ray events () in a particular energy bin is calculated by subtracting the expected number of background events from the -ray domain events. In order to validate the trained ANN, the spectrum of the Crab Nebula was reproduced. The spectrum of the Crab nebula is fitted by a power law with cm-2 s-1 TeV-1 and .
After reproducing the Crab Nebula spectrum, we obtained the spectrum of Mrk 421 for the spells II and III where the source was emitting at more than 1 CU. The resultant spectrum is well fitted by a simple power law with exponential cut off with 10-11 cm-2 s-1 TeV-1 and and . Both the obtained spectra (Figure 4) match well with the previously reported results [6].


8 Results and Discussion
The extragalactic source Mrk 421 was observed by the TACTIC imaging telescope during December - April for h. Previous analysis of this data using the Dynamic Supercuts method led to a detection of flaring activity from the source at Energy TeV. Here we re-analyzed this data by using the machine learning Random Forest method. The Dynamic Supercuts method as well as the Random Forest method showed that Mrk 421 was in the high state in Spell II and III. The key result of this study is that the Random Forest method estimated more excess -ray like events compablack to previous results [6]. This is so because Supercuts method yielded a total of excess events for the entire data set, while the Random Forest method resulted in ( excess events. The signal strength estimated by the Random Forest method was 14.6 as compablack to 11.5 obtained by the Dynamic Supercuts method. The energy spectrum of Mrk 421 as measublack by the TACTIC telescope for spell II and III is compatible with a power law with exponential cut off. The Random Forest method yielded more events than the Dynamic Supercuts method. In order to find out the energy dependance of excess -ray events, we compablack the energy dependent effective area at two representative zenith angles (). Figure 5 shows the effective collection areas of the telescope after the application of Dynamic Supercuts and Random Forest method as a function of -ray energy.


It is clear that the application of the Random Forest method leads to higher effective area beyond TeV, i.e. the Random Forest method is able to collect more high energy events compablack to the Dynamic Supercuts method. In addition to the source detection in high state in Spell II and III, TACTIC also observed this source during the last lag of Spell VI in the month of April 2006. It may be mentioned that during this period, this source was also observed by various groups. The Whipple telescope [5] carried out the observation in April and June 2006. The MAGIC telescope observed this source from April 22 to April 30, 2006 [4]. Both experiments detected the source in high state. However, TACTIC has only a 4.1 detection during this period which might be owing to its lesser sensitivity. It should be noted that the TACTIC readout employs charge integration over the full gating window. It contrasts to MAGIC where FADC-readout [25] is used, allowing to exploit the time-development of the image for gamma/hadron separation. It has been demonstrated that the use of timing information in the analysis of the MAGIC data results in an enhancement of about a factor 1.4 of the flux sensitivity to point-like sources. The sensitivity of the TACTIC telescope might improve by adopting this strategy.
The applicability and superiority of the Random Forest method over the Dynamic Supercuts method for the TACTIC telescope has been demonstrated by the present study. In a subsequent work, this method will be employed for available data of various sources corresponding to both detection and non-detection by the Dynamic Supercuts method.
Acknowledgements
MS thanks P. Savicky for making available the decision plot of the simulated MAGIC data333http://archive.ics.uci.edu/ml/datasets/MAGIC+Gamma+Telescope/, N. Bhatt, K.K.Yadav for useful discussions, H. Bhatt and B. Ghosal for re estimating the excess -ray events using the Dynamic Supercuts method. The authors also thank all the colleagues of the instrumentation and observation team.
References
- [1] M. Punch et al., Nature 358 (1992) 477.
- [2] J.A. Gaidos et al., Nature 383 (1996) 319.
- [3] G. Fossati et al., ApJ 677 (2008) 906, 0710.4138.
- [4] J. Aleksić et al., A& A 519 (2010) A32, 1001.1291.
- [5] D. Horan et al., ApJ 695 (2009) 596, 0901.1225.
- [6] K.K. Yadav et al., Astroparticle Physics 27 (2007) 447, astro-ph/0701890.
- [7] G. Mohanty et al., Astroparticle Physics 9 (1998) 15.
- [8] R.K. Bock et al., Nuclear Instruments and Methods in Physics Research A 516 (2004) 511.
- [9] J. Albert et al., Nuclear Instruments and Methods in Physics Research A 588 (2008) 424, 0709.3719.
- [10] S. Ohm, C. van Eldik and K. Egberts, Astroparticle Physics 31 (2009) 383, 0904.1136.
- [11] A. Fiasson et al., Astroparticle Physics 34 (2010) 25, 1004.3375.
- [12] F. Dubois, G. Lamanna and A. Jacholkowska, Astroparticle Physics 32 (2009) 73.
- [13] Y. Becherini et al., Astroparticle Physics 34 (2011) 858, 1104.5359.
- [14] T. Hengstebeck, Measurement of the energy spectrum of the BL Lac object PG1553+113 with the MAGIC telescope in 2005 and 2006, PhD thesis, 2007.
- [15] R. Koul et al., Nuclear Instruments and Methods in Physics Research A 578 (2007) 548, 0706.2055.
- [16] A.M. hillas, International Cosmic Ray Conference, edited by . F. C. Jones, , International Cosmic Ray Conference Vol. 3, pp. 445–448, 1985.
- [17] D. Heck et al., Forschungszentrum Karlsruhe Report FZKA 6019 (1998) 1.
- [18] M.K. Koul et al., Nuclear Instruments and Methods in Physics Research A 646 (2011) 204, 1105.1954.
- [19] . HEGRA Collaboration et al., Astroparticle Physics 4 (1996) 199.
- [20] M. Gaug, DESY-THESIS-2001-022 (2001).
- [21] M. Sharma et al., Accepted in Research in Astronomy & Astrophysics 00 (2014) 000.
- [22] . HEGRA Collaboration et al., Astroparticle Physics 4 (1996) 199.
- [23] T.P. Li and Y.Q. Ma, ApJ 272 (1983) 317.
- [24] M. Reidmiller, Computer Standards Interfaces 16 (1994) 265.
- [25] J. Albert et al., Nuclear Instruments and Methods in Physics Research A 594 (2008) 407, astro-ph/0612385.