The stellar accretion origin of stellar population gradients in massive galaxies at large radii
Abstract
We investigate the evolution of stellar population gradients from to in massive galaxies at large radii () using ten cosmological zoom simulations of halos with . The simulations follow metal cooling and enrichment from SNII, SNIa and AGB winds. We explore the differential impact of an empirical model for galactic winds that reproduces the mass-metallicity relation and its evolution with redshift. At larger radii the galaxies, for both models, become more dominated by stars accreted from satellite galaxies in major and minor mergers. In the wind model, fewer stars are accreted, but they are significantly more metal poor resulting in steep global metallicity ( dex/dex) and color (e.g. dex/dex) gradients in agreement with observations. In contrast, colour and metallicity gradients of the models without winds are inconsistent with observations. Age gradients are in general mildly positive at ( dex/dex) with significant differences between the models at higher redshift. We demonstrate that for the wind model, stellar accretion is steepening existing in-situ metallicity gradients by about 0.2 dex by the present day and helps to match observed gradients of massive early-type galaxies at large radii. Colour and metallicity gradients are significantly steeper for systems which have accreted stars in minor mergers, while galaxies with major mergers have relatively flat gradients, confirming previous results. The effect of stellar migration of in-situ formed stars to large radii is discussed. This study highlights the importance of stellar accretion for stellar population properties of massive galaxies at large radii, which can provide important constraints for formation models.
keywords:
galaxies: abundances; galaxies: formation; galaxies: evolution; galaxies: general; galaxies: stellar content; methods: numerical1 Introduction
Metallicity gradients in galaxies contain important informations. It is a natural prediction of modern hierarchical cosmological models that the assembly of massive galaxies involves major and minor mergers although most stars in most galaxies have been made in-situ from accreted or recycled gas. Nonetheless, these mergers are expected to play a significant role for the structural and morphological evolution of the massive early-type galaxy population (e.g. Kauffmann et al., 1996; Kauffmann, 1996; De Lucia et al., 2006; Khochfar & Silk, 2006; De Lucia & Blaizot, 2007; Guo & White, 2008a; Kormendy et al., 2009; Hopkins et al., 2010; Oser et al., 2010; Naab et al., 2013). During mergers, gas and stars that have formed in other, typically smaller galaxies are added to the main galaxies, their stellar populations are mixed and new stars can form, predominantly in the central regions. In the absence of a significant cold gas component, the mixing of the stellar populations is entirely determined by stellar dynamics.
Two important structural galaxy properties, which are thought to be strongly influenced by mergers, are the (in general negative) abundance and colour gradients observed early-on in massive, present-day elliptical (e.g. de Vaucouleurs, 1961; McClure & Racine, 1969; Franx & Illingworth, 1990; Peletier et al., 1990; Davies et al., 1993; Carollo et al., 1993; Mehlert et al., 2003; Wu et al., 2005; La Barbera et al., 2005; Annibali et al., 2007; Rawle et al., 2010; Eigenthaler & Zeilinger, 2013), but also in disk galaxies (e.g. Wyse & Silk, 1989; Vila-Costas & Edmunds, 1992; Zaritsky et al., 1994; van Zee et al., 1998; MacArthur et al., 2004), typically within .
Thanks to improved and more elaborated observational techniques, present-day metallicity and colour gradients can nowadays be measured out to much larger radii (beyond ), occasionally out to even , (e.g. Sánchez-Blázquez et al., 2007; La Barbera & de Carvalho, 2009; Foster et al., 2009; Weijmans et al., 2009; Spolaor et al., 2010; Coccato et al., 2010; La Barbera et al., 2012; Greene et al., 2012, 2013; Mihos et al., 2013; Pastorello et al., 2014; Raskutti et al., 2014; D’Souza et al., 2014, Duc et al. 2014) and future observational surveys will allow observations at higher redshifts. For the gaseous component, observations, interestingly, suggest an inversion at high redshifts (), i.e. positive gaseous metallicity gradients, which could be caused by gas dilution due to cold gas infall or on-going mergers (Cresci et al., 2010; Queyrel et al., 2012; Jones et al., 2013).
Theoretically, the evolution of such abundance gradients has been in the focus already of the very first numerical N-Body simulations of mergers of spheroidal galaxies later on also focusing on shapes and kinematics, scaling relations, sizes and dark matter fractions (White, 1978, 1979; Makino & Hut, 1997; Boylan-Kolchin et al., 2005; Naab et al., 2006; Boylan-Kolchin et al., 2006, 2008; Di Matteo et al., 2009; Nipoti et al., 2009; Nipoti et al., 2012). Already the simulations by White (1978, 1980) clearly indicated significant mixing and severely flattened population gradients in equal mass (or major) merger events (see also Kobayashi, 2004 including a more detailed treatment for chemical enrichment and the more recent studies by Rupke et al., 2010 and Navarro-González et al., 2013). Di Matteo et al. (2009), for example, find with such simulations a flattening of the metallicity gradient depending on the strength of the initial gradients (before the merger). It has also been predicted early-on that minor mergers show a different mixing behaviour. The stars of the merging galaxies are predominantly added at large radii and - assuming lower metallicity for the satellites - lead to abundance (colour) gradients at large radii (Villumsen, 1983).
In the same spirit, Hilz et al. (2012); Hilz et al. (2013) have recently re-investigated in detail the collisionless dynamics of major and minor mergers of spheroidal galaxies embedded in massive extended dark matter halos in direct comparison to analytic predictions (Cole et al., 2000; Naab et al., 2009; Bezanson et al., 2009). They confirm the previous findings and also demonstrate how violent relaxation in major mergers mixes dark matter into the central regions (Boylan-Kolchin et al., 2005, 2006). However, in minor mergers with mass-ratios of 1:5 to 1:10, violent relaxation is less important and the influence of a dark matter component is significant. Stars of the merging satellites are stripped and added to the host system at even larger radii dominated by dark matter (see also Laporte et al., 2012; Oogi & Habe, 2013; Laporte et al., 2013; Cooper et al., 2013) . As a result, the effective radii of the galaxies as well as the dark matter fractions grow more rapidly and the Sersic index of the surface density profiles increase significantly (Hilz et al., 2013).
The above experiments result in a clear prediction. Early-type galaxies with major collisionless mergers dominating the formation history have flat population gradients, galaxies with a significant contribution from minor mergers (and no subsequent major merger) have significant population gradients at large radii, where the stars of the accreted satellites assemble - a process promoted by dark matter. These considerations are by no means purely theoretical as ’dry’ mergers of gas poor early-type galaxies have been directly observed up to high redshift (van Dokkum, 2005; Tran et al., 2005; Bell et al., 2006; Lotz, 2008; Jogee, 2009; Newman et al., 2012; Man et al., 2012).
Hierarchical cosmological models in comparison with observations provide more realistic models for the assembly of massive galaxies - beyond a simple sequence of binary mergers. Direct observations indicate that a significant fraction of massive early-type galaxies () were more compact in the past (Daddi et al., 2005; van der Wel et al., 2005; Trujillo et al., 2006; Longhetti et al., 2007; Toft et al., 2007; Buitrago et al., 2008; van Dokkum et al., 2008; van der Wel et al., 2008; Cimatti et al., 2008; Franx et al., 2008; Damjanov et al., 2009; Cenarro & Trujillo, 2009; Bezanson et al., 2009; van Dokkum et al., 2010; van de Sande et al., 2011) and have predominantly grown in mass and size by the assembly (and not the formation) of stellar mass at larger radii (Hopkins et al., 2009; van Dokkum et al., 2010; Szomoru et al., 2012; Saracco et al., 2012; Patel et al., 2013).
A plausible formation scenario bears a two-phase characteristic (De Lucia & Blaizot, 2007; Naab et al., 2007; Guo & White, 2008a; Genel et al., 2008; Feldmann et al., 2010; Oser et al., 2010; Feldmann et al., 2011; Johansson et al., 2012; Hirschmann et al., 2013). The early formation of (compact) massive galaxies is dominated by dissipative processes (i.e. significant radiative energy losses) and in-situ star formation. Instead, towards lower redshifts in-situ star formation becomes less important and the galaxies grow in mass and size by the accretion of stars formed in other galaxies and added in major and minor mergers with dissipation becoming less and less important. Such a scenario is supported by direct numerical simulations (Johansson et al., 2009; Lackner & Ostriker, 2010; Laporte et al., 2012; Oser et al., 2012; Lackner et al., 2012a; Gabor & Davé, 2012), semi-analytical models (De Lucia et al., 2006; De Lucia & Blaizot, 2007; Guo & White, 2008a; Hirschmann et al., 2012) and independent estimates from abundance matching techniques (Moster et al., 2013; Behroozi et al., 2013; Yang et al., 2013). All models predict that the accretion of stars is more important for massive galaxies than for less massive ones. The amount of accreted stars for massive galaxies hosted in massive halos varies, however, from about 40% to 60%.
Instead, for lower mass (e.g. Milky-Way-like) galaxies neither major nor minor mergers dominate the stars found in the bulk of the systems at any time and dissipative processes are still important at low redshifts. It is generally thought that roughly % of the stars in a Milky-Way-like galaxy are formed in-situ from infalling gas. This particularly implies that (in-situ formed) stellar metallicity gradients of disk dominated galaxies originate from a different process than discussed so far (not the accretion of stars, see e.g. Tortora et al., 2010): by the continuous infall of metal-poor gas with higher and higher angular momentum towards low redshift which can be then turned into stars at larger and larger radii (inside-out formation).. Various models (chemical evolution and hydrodynamical simulations) can predict gradients in disk galaxies (e.g. Matteucci & Francois, 1989; Steinmetz & Mueller, 1994) and all models indicate that with evolving time the gradients become flatter as the disks grow (e.g. Molla et al., 1997; Prantzos & Silk, 1998; Chiappini et al., 2001; Mollá & Díaz, 2005; Naab & Ostriker, 2006; Spitoni & Matteucci, 2011; Pilkington et al., 2012; Fu et al., 2013).
Apart from the stellar mass dependence (and from galaxy-to-galaxy variations), the accreted and in-situ formed stellar fractions also strongly depend on the exact galaxy formation model, and it has been shown that physical processes like feedback from supernovae, young massive stars and AGN can significantly influence the relative importance of in-situ formation versus accretion of stars (Lackner et al., 2012a; Hirschmann et al., 2012; Hirschmann et al., 2013; Dubois et al., 2013). Therefore, such processes most likely also affect the evolution of in-situ formed metallicity gradients and the relevance of the contribution of accreted stars (and thus, the overall gradient). Pilkington et al. (2012) have, for example, investigated the evolution of metallicity gradients in disk galaxies using hydrodynamical simulations and find that different sub-grid and feedback schemes can significantly alter the in-situ formed metallicity gradients, while the merger history has only a minor effect.
As stated earlier – the origin of metallicity and colour gradients of disk galaxies was investigated in detail by observations and chemical evolution models or cosmological simulations. Even if very basic, the formation and evolution of metallicity gradients of early-type galaxies is,however, less well explored in literature, despite some recent and on-going progress from the observational side (e.g. Spolaor et al., 2010; La Barbera & de Carvalho, 2009; Tortora et al., 2010; Greene et al., 2012; La Barbera et al., 2012; Greene et al., 2013; Raskutti et al., 2014; Pastorello et al., 2014, Duc et al. 2014, in prep.). Previous studies mainly focused on inner stellar population gradients (up to 3 ) at relatively low resolution (softening length kpc in a cosmological set-up) either performing isolated merger simulations (Di Matteo et al., 2009; Rupke et al., 2010) or cosmological simulations (Kawata & Gibson, 2003; Kobayashi, 2004; Navarro-González et al., 2013). They all agree on a flattening of the gradients due to major mergers (depending on the exact mass-ratio though). Kobayashi (2004) additionally state that inner gradients can be regenerated when strong central star formation is induced. Navarro-González et al. (2013) mention that minor mergers (accretion of stellar systems) bring in older and less metallic stars which can steepen metallicity gradients. But they investigate only inner gradients (up to 2 ) at comparably poor spatial resolution (2.7 kpc).
Therefore, in this work, we focus on the stellar accretion origin of metallicity and colour gradients in simulated massive galaxies at large radii () in a full cosmological context. We particularly intend to explore the combined effect of strong galactic winds and of the individual merger and accretion histories on the in-situ formed and accreted stellar fractions and on the steepening/flattening of the metallicity, age and colour gradients at these large radii. We explicitly distinguish between metallicity gradients formed by in-situ star formation and by accretion of stars. Our results give a possible explanation for the origin and evolution of abundance gradients of massive galaxies in hierarchical cosmological galaxy formation models. In addition, they provide theoretical predictions for future observational surveys measuring abundance gradients at such large radii and/or at high redshifts.
For this analysis, we consider the 10 most massive high-resolution, cosmological zoom simulations (covering a mass range of ) presented in Hirschmann et al. (2013) including a treatment for metal enrichment (SNII, SNIa and AGB stars) and a phenomenological feedback scheme for galactic winds.
These cosmological zoom simulations were shown to be successful in suppressing early star formation at , in predicting reasonable star formation histories for galaxies in present day halos of , in producing galaxies with high cold gas fractions (30 - 60 per cent) at high redshift, and in significantly reducing the baryon conversion efficiencies for halos () at all redshifts in overall good agreement with observational constraints. Due to the delayed onset of star formation in the wind models, the metal enrichment of gas and stars is delayed and is also found to agree well with observational constraints. In addition, galactic winds increase the ratio of in-situ formed to accreted stars – the relative importance of dissipative vs. dissipationless assembly. These cosmological zoom simulations provide, therefore, a good basis for our analysis of the spatial distribution of metallicity and colours in massive galaxies.
The paper is organised as follows. Section 2 provides an introduction into our simulation set-up and the construction, quantification and visualisation of the merger histories. In section 3 we show the redshift evolution of the mass-metallicity and the mass-age relations. We further show the evolution of the (outer) metallicity and age gradients in Sections 4 and 5, distinguishing between the metallicity and the stellar age of the accreted and in-situ formed stellar component and discussing the effect of galactic winds. Using stellar population models, we investigate the evolution of color gradients in Section 6. Section 7 provides a discussion about the effect of the merger history on the individual gradients and section 8 also a comparison of our simulated gradients with currently available observational data. A final summary of this work is given in Section 9.
2 High-resolution simulations of individual galaxy halos
2.1 Simulation setup
For this analysis, we have selected the ten most massive halos from the high-resolution, cosmological zoom simulation set presented in Hirschmann et al. (2013) (M0163, M0209, M0215, M0224, M0227, M0259, M0290, M0300, M0305, M0329). They are based on the initial conditions described in detail in Oser et al. (2010, 2012). We briefly review the simulation setup here, but refer the reader to the original papers for more details.
The dark matter halos for further refinement were selected from a dark matter only N-body simulation with a co-moving periodic box length of and particles (Moster et al., 2010). We assume a CDM cosmology based on the WMAP3 measurements (see e.g. Spergel et al., 2003) with , , , and . The simulation was started at and run to with a fixed co-moving softening length of and a dark matter particle mass of . From this simulation, we picked different halos identified with the halo finder algorithm at . To construct the high-resolution initial conditions for the re-simulations, we traced back in time all particles closer than to the centre of the halo in any snapshot and replaced them with dark matter as well as gas particles at higher resolution (). In the high resolution region the dark matter particles have a mass resolution of , which is 8 times higher than in the original simulation, and the gas particle masses are . The co-moving gravitational softening length for the gas and star particles is and for the high-resolution dark matter particles.
| MNoW | ||||||||||||||||||
|---|---|---|---|---|---|---|---|---|---|---|---|---|---|---|---|---|---|---|
| ID | ||||||||||||||||||
| kpc | 1e-1 | 1e-2 | 1e-1 | 1e-2 | 1e-1 | 1e-2 | 1e-2 | 1e-3 | 1e-2 | 1e-3 | 1e-2 | 1e-3 | ||||||
| dex/dex | dex/kpc | dex/dex | dex/kpc | dex/dex | dex/kpc | dex/dex | dex/kpc | dex/dex | dex/kpc | dex/dex | dex/kpc | |||||||
| M0163 | 914.6 | 35.81 | 9.70 | 6.0 | 1 | 29 | ||||||||||||
| M0209 | 678.6 | 20.74 | 9.33 | 3.1 | 2 | 13 | ||||||||||||
| M0215 | 659.2 | 28.20 | 15.50 | 4.0 | 0 | 19 | ||||||||||||
| M0224 | 621.4 | 22.52 | 6.76 | 4.3 | 2 | 29 | ||||||||||||
| M0227 | 700.0 | 30.33 | 7.58 | 4.6 | 1 | 23 | ||||||||||||
| M0259 | 525.2 | 19.95 | 10.98 | 3.0 | 0 | 5 | ||||||||||||
| M0290 | 544.4 | 20.03 | 9.01 | 4.1 | 2 | 16 | ||||||||||||
| M0300 | 495.1 | 17.98 | 8.99 | 4.9 | 2 | 10 | ||||||||||||
| M0305 | 463.9 | 14.69 | 10.22 | 4.8 | 1 | 8 | ||||||||||||
| M0329 | 450.4 | 20.74 | 14.56 | 4.6 | 1 | 10 | ||||||||||||
| Mean gradients | ||||||||||||||||||
| WM | ||||||||||||||||||
|---|---|---|---|---|---|---|---|---|---|---|---|---|---|---|---|---|---|---|
| ID | ||||||||||||||||||
| kpc | 1e-1 | 1e-2 | 1e-1 | 1e-2 | 1e-1 | 1e-2 | 1e-2 | 1e-3 | 1e-1 | 1e-2 | 1e-1 | 1e-2 | ||||||
| dex/dex | dex/kpc | dex/dex | dex/kpc | dex/dex | dex/kpc | dex/dex | dex/kpc | dex/dex | dex/kpc | dex/dex | dex/kpc | |||||||
| M0163 | 904.7 | 36.58 | 18.51 | 4.8 | 1 | 24 | ||||||||||||
| M0209 | 681.3 | 19.67 | 18.07 | 2.6 | 1 | 6 | ||||||||||||
| M0215 | 662.1 | 26.92 | 21.54 | 3.4 | 0 | 11 | ||||||||||||
| M0224 | 640.3 | 24.56 | 19.16 | 3.1 | 1 | 10 | ||||||||||||
| M0227 | 695.4 | 30.90 | 12.67 | 4.1 | 2 | 8 | ||||||||||||
| M0259 | 555.2 | 17.80 | 16.02 | 3.1 | 1 | 2 | ||||||||||||
| M0290 | 546.7 | 20.65 | 16.52 | 4.6 | 1 | 7 | ||||||||||||
| M0300 | 504.4 | 17.01 | 7.31 | 3.5 | 2 | 7 | ||||||||||||
| M0305 | 465.6 | 20.37 | 13.85 | 4.0 | 1 | 3 | ||||||||||||
| M0329 | 462.0 | 19.98 | 16.98 | 3.6 | 0 | 7 | ||||||||||||
| Mean gradients | ||||||||||||||||||
To model the gas component we use the entropy conserving formulation of SPH (Gadget-2, Springel et al., 2005) with the extension of Oppenheimer & Davé (2006, 2008) including a prescription for metal enrichment and momentum-driven winds. This version includes ionisation and heating by a spatially uniform, redshift dependent background radiation according to Haardt & Madau (2001). Gas particles undergo radiative cooling down to K under the assumption of ionisation equilibrium; we account for metal-line cooling using the collisional ionisation equilibrium tables of Sutherland & Dopita (1993).
Following Springel & Hernquist (2003), stars are formed from dense gas clouds using a sub-resolution multi-phase model which describes condensation and evaporation in the interstellar medium (McKee & Ostriker, 1977). We have a density threshold for star formation of , which is calculated self-consistently in a way that the equation of state is continuous at the onset of star formation. Besides, we adopt a Chabrier (2003) IMF throughout this study implying a fraction of stars, which results in type II supernovae, of . The model is tuned via a single parameter, the star formation rate timescale, using simulations of isolated disk galaxies to reproduce the observed Schmidt-Kennicut relation. Note that in cosmological simulations the result may, however, deviate from the observed relation (see Hirschmann et al., 2012).
Following Oppenheimer & Davé (2008), we account for metal enrichment from supernovae type II (SNII), type Ia (SNIa) and asymptotic giant branch (AGB) stars and four elements (C, O, Si, Fe) are tracked individually. The SNII enrichment follows Springel & Hernquist (2003) using an instantaneous recycling approximation, but is modified by adopting metallicity dependent yields from the nucleosynthesis calculations by Limongi & Chieffi (2005). The SNIa rate is modelled following the two-component parametrisation from Scannapieco & Bildsten (2005), where one component is proportional to the stellar mass (slow, delayed component) and the other to the SFRs (rapid component). Besides the production of metals, each SNIa is assumed to deposit ergs of energy, and this energy is added thermally directly to the gas particle. AGB stars mainly provide feedback in the form of mass (energy can be neglected as most mass leaves the AGB stars with velocities far below km/s) and produce carbon and oxygen (while silicon and iron remains almost unprocessed). Nevertheless, AGB stars may have significant thermal impact (Conroy et al., 2014) which we do not include in our model.
The momentum-driven wind model is based on the wind model of Springel & Hernquist (2003): outflows are directly tied to the star formation rates using the relation , where is defined as the mass loading factor. Star forming gas particles get stochastically kicked vertically to the disc and are thus, launched in a wind with the probability . A selected wind particle is given the additional velocity of in the direction of , where and are the velocity and acceleration of a particle, respectively (Springel & Hernquist, 2003). Subsequently, the gas particles are decoupled from hydrodynamics for a short time in order to escape their dense, star-forming regions and eventually to leave their galaxies (see e.g. Dalla Vecchia & Schaye, 2008). These particles are only allowed to again interact hydrodynamically as soon as they either reach a SPH density less than 10 per cent of the SF density threshold or the time it takes to travel 30 kpc at the wind velocity .
The values of and define the wind model: while Springel & Hernquist (2003) used constant values for these parameters, Oppenheimer & Davé (2006) adopt a momentum-driven wind model and introduce a scaling with the velocity dispersion of the galaxies motivated by observations of galactic super-winds of Martin (2005); Rupke et al. (2005) and by analytical calculations of Murray et al. (2005); Zhang & Thompson (2012). The mass-loading factor (i.e. the fraction of star-forming particles, which get kicked) is calculated according to
| (1) |
where is the velocity dispersion which is calculated from the galaxy mass using an on-the-fly group finder. is a constant which is set to reproduce the overall evolution of the SFR density in Oppenheimer & Davé (2006) (here: ).
To disentangle the effect of galactic winds on the evolution of metallicity and colour gradients we study their influence separately by analysing two sets of simulations with two different models:
-
•
MNoW: Metal enrichment and metal cooling, but no galactic winds
-
•
WM: Metal enrichment, metal cooling and momentum-driven galactic winds
Note that all simulations include thermal supernova feedback as described in detail in Springel & Hernquist (2003). For more details on the simulation set-up, we refer the reader to Hirschmann et al. (2013). As in this study, the simulations including winds were shown to predict more realistic galaxies in several aspects (even if some drawbacks remain as e.g. too much late star formation as a consequence of missing AGN feedback), we a priori expect the metallicity and colour gradients of the WM galaxies to be closer to reality.
Note that tables 1 and 2 summarise different galaxy properties such as halo mass, total and in-situ formed stellar mass, effective radii, the number of stellar minor and major mergers and also the fitted metallicity and age gradients at (which will be discussed in the course of this study) of the 10 selected halos in the MNoW and the WM re-simulations, respectively.
2.2 Merger histories
We extract the merger trees for the dark matter component directly from the cosmological re-simulations as described in Hirschmann et al. (2010). For every snapshot at a given redshift, we first identify individual dark matter haloes using a FOF (Friends-of-Friends) algorithm with a linking length of (, Davis et al., 1985). In a second step we extract the subhalos of every FOF group using the Subfind algorithm (Springel et al., 2001). The algorithm to connect the dark matter halos between the snapshots at different redshifts is described in detail in Maulbetsch et al. (2007) and in Hirschmann et al. (2010). Note that the tree-algorithm is only applied to the dark matter particles – star particles are not separately traced back in time and they are assumed to follow the evolution of the dark matter. The stellar particles associated within of the virial radius are defined as the stellar mass of the central galaxy and these were considered to calculate the stellar metallicity of the central galaxy.
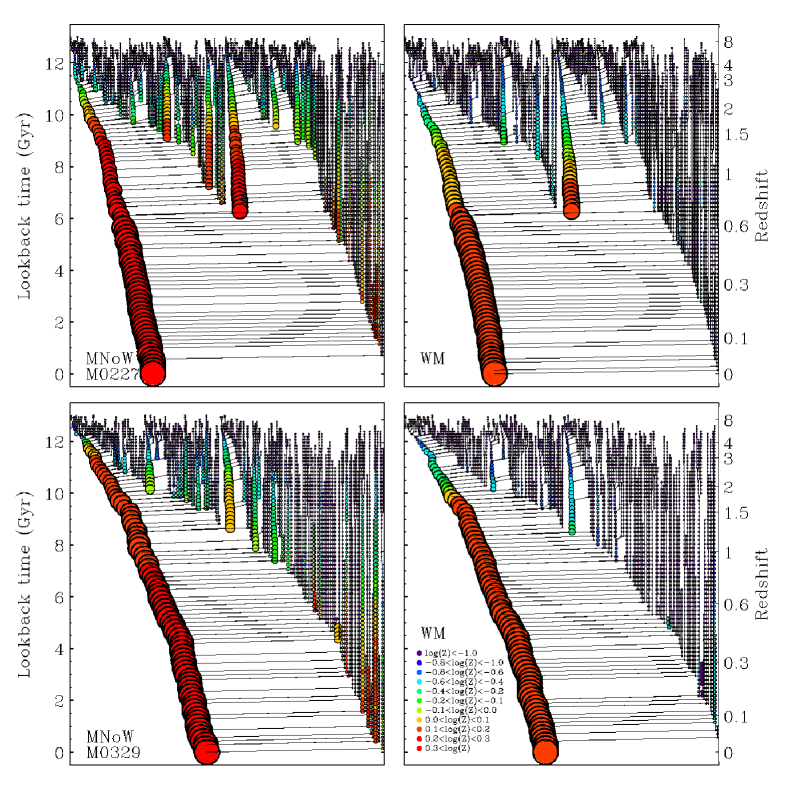
In Fig. 1, we visualise four merger trees of two different re-simulated halos with a virial masses of (M0227, top row) and of (M0329, bottom row) for the MNoW (left column) and the WM model (right column). The sizes of the black circles approximate the stellar mass within 1/10 of the dark matter virial radius and they scale with the square root of mass normalised to the final stellar mass. The stellar metallicity of these galaxies is colour-coded (from dark-blue, metal-poor to red, metal-rich, as indicated by the legend).
Fig. 1 nicely illustrates that for the two MNoW runs, both the central and satellite galaxies are enriched faster than in the corresponding WM runs. In addition, in the MNoW model, more merger events occur and the accreted satellite galaxies have typically a larger stellar mass and are more metal-rich than in the WM model. Independently of the model, however, the M0329 halo always has a rather quiet merger history, under-going only minor mergers, while the M0227 halo experiences two major mergers since , one at and one at . Note that not all galaxies of the halos indicated here merge with the central galaxy by .
As galaxy properties are often more tightly connected with the merger events of the stellar component, which typically occur with some time delay after the dark matter halo merger, we have also quantified stellar merger histories (for the central galaxy only) using the approach of Oser et al. (2012). We identify every satellite merging with the most massive progenitor of the central galaxy using FOF run over the stellar particles with a minimum number of 20 particles () and with a linking length 1.6 kpc/h (physical). The satellite galaxy is assumed to be merged with the central galaxy as soon as the FOF algorithm cannot separate both FOF-galaxies anymore (the satellite is part of the central FOF group). At , all galaxies are more massive than , i.e. we resolve mergers at least down to a mass-ratio of .
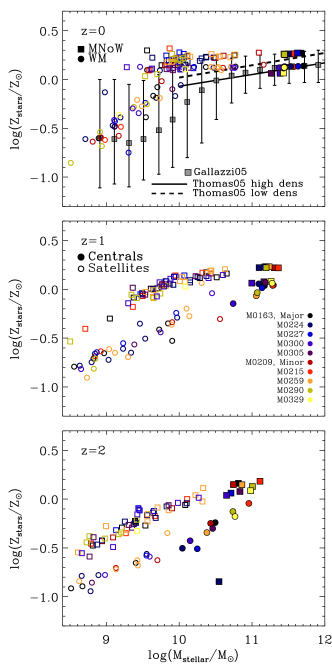
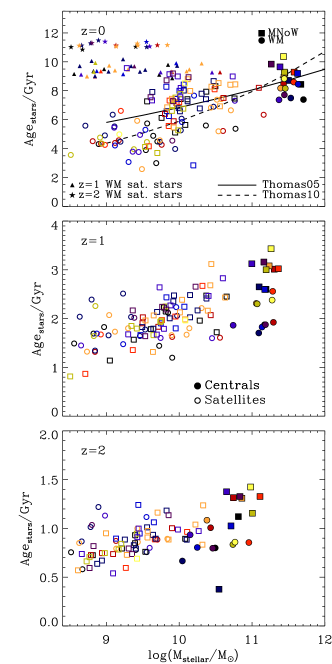
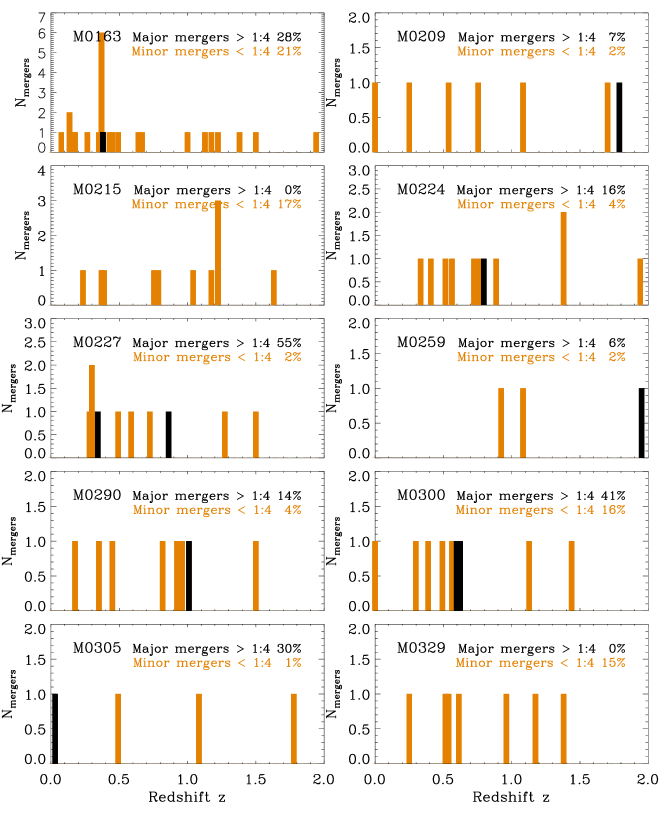
Fig. 2 shows the stellar galaxy merger histories since of all ten WM simulations represented by the number of major (black, mass-ratio 1:4) and minor mergers (orange, mass-ratio 1:4, but larger than 1:100) as a function of redshift (see also Naab, 2014). The respective mass fraction of the final stellar galaxy mass contributed by major (black) and minor (orange) mergers is given in each panel. Some galaxies have a significant contribution from major mergers (e.g. M0163, M0224, M0227, M0300 and M0305), while others have a more quiet merger history and encounter mainly or even only minor mergers (e.g. M0209, M0215, M0259, M0290, M0329).
The amount of stellar major and minor mergers for the ten halos in both runs is summarised in tables 1 and 2. It is evident that the number of major and particularly the one of minor mergers is significantly larger in the MNoW run than in the WM run, as without winds, the star formation rates peak at higher redshifts (, see Fig. 2 in Hirschmann et al., 2013) so that more (massive) galaxies can form at earlier times and can subsequently merge together. How these stellar merger histories are connected with the steepness of the metallicity, age and colour gradients will be discussed in section 7.
3 Redshift evolution of mass-metallicity and mass-age relations
Before investigating the radial metallicity and age distributions, we start with discussing the evolution of integrated galaxy properties, the stellar mass-metallicity and the stellar mass-age relation.
The right column of Fig. 3 shows the evolution of the stellar mass-metallicity relation since redshift (shown is , and from bottom to top) for the main galaxies of the model without winds (MNoW, filled squares) and the model including winds (WM, filled circles). The satellites in the respective halos are indicated by open circles. These are (most of) the systems which are going to merge with the central galaxies. Note that we have calculated the stellar mass and metallicity within of the halo virial radius, which typically captures its central galaxy. We have, however, not performed any aperture correction.
At (bottom left panel) both models result in a tight mass-metallicity relation below . Already at this redshift, the WM galaxies and satellites are offset by about a factor of two ( dex) to lower metallicities. Above this mass, the a mass-metallicity relation for MNoW seems to flatten out already at slightly super-solar metallicities (). If, at and below this redshift, satellites merge with their host galaxies, they bring in stars with lower metallicity than the main galaxies in both models.
Already by (middle left panel of Fig. 3) the situation has changed. The shape of the WM mass-metallicity relation has changed little, the main galaxies and a few satellites have increased their mass and metallicity. There is, however, a dramatic change in the MNoW mass-metallicity relation. Already at , most of the satellites have masses above and super-solar metallicities of , very similar to the main galaxies that have grown in mass to above . When these satellites merge with the central galaxies there will be no difference, at least with respect to the metal content.
Towards (upper left panel in Fig. 3), the trend continues and the MNoW mass-metallicity relation has completely flattened out and appears to be in conflict with observations (Thomas et al., 2005; Gallazzi et al., 2005). This is, however, a bit inconclusive as we run out of low mass satellites in MNoW. The WM main galaxies have slightly lower metallicities than the MNoW galaxies ( as opposed to ), but the metallicities of the satellites still decrease significantly for masses below , more consistent with the Gallazzi et al. (2005) observations.
Also in the wind model, the metallicities of low-mass satellites are systematically higher by 0.2-0.3 dex compared to the mean values of Gallazzi et al. (2005). The galactic wind model might still be not efficient enough in suppressing early star formation (and thus, in delaying metal enrichment) as it was for example indicated by the higher SFRs in low-mass systems compared to abundance matching predictions (see top right panel in Fig. 2 in Hirschmann et al., 2013 and Davé et al., 2013 for further discussion). However, the observational data of Gallazzi et al. (2005) is dominated by central galaxies, while in the simulations, we are considering satellite galaxies. Other observational studies revealed that low-mass satellite galaxies might have slightly larger stellar metallicities than central galaxies (by up to 0.2 dex larger as shown in Fig. 4 of Pasquali et al., 2010) which could account for the systematic offset between the wind model and the observations of Gallazzi et al. (2005). In this respect, our simulated satellite galaxies in the wind model may already provide a fairly realistic stellar metallicity content.
Turning to (mass-weighted) stellar ages, the right column of Fig. 3 shows the mass-age relation at (panels from bottom to top) for the main (filled symbols) and satellite (open symbols) galaxies of the MNoW (squares) and the WM model (circles). At , central WM galaxies are mostly younger than those in the MNoW model, while for satellites, the trend is just reversed. This has the consequence that in WM model, mass-age relation is nearly flat (or even slightly negative) with a large scatter in the stellar age at the low mass end. Instead, without winds, already at a positive correlation between mass and age has evolved. The reason for this significantly different behaviour is most likely twofold: first, in the WM model, massive galaxies at are highly star-forming (delayed star formation peaking at due to the winds, see top left panel of Fig. 2 in Hirschmann et al. (2013)). Second, the strong galactic winds still prevent and suppress star formation in less massive galaxies at that redshift so that they can become equally or even older than their central galaxies.
Towards , the trends seen for are still visible, even if the mass-relation has now steepened in the MNoW model, and flattened (from a slightly negative correlation) in the WM model.
By the epoch , however, the situation has changed: for the entire mass range, the MNoW galaxies are on average older than the WM galaxies. In the WM model, stellar mass and age are now positively correlated: less massive satellite galaxies are significantly younger than their central galaxies, as the former are still highly star-forming, particularly due to re-infall of previously ejected gas, while the latter have already consumed a lot of their gas via previous star formation. This trend is consistent with observations of close pairs in the Survey for High-z Absorption Red and Dead Sources (SHARDS, Ferreras et al., 2014), also finding that satellites are younger than the centrals at a given redshift up to . Compared to observations (Thomas et al., 2005, 2010), WM galaxies are a bit young (by roughly 1-2 Gyrs), which is most likely a consequence of the increased late in situ star formation in massive galaxies. Instead, a number of MNoW galaxies tend to be too old (by 1-2 Gyrs) as they have formed most of their stars too early (see SFR evolution in Fig.2 in Hirschmann et al., 2013). AGN feedback would likely reduce the late star formation in those galaxies (Choi et al., 2014)
At , the top right panel of Fig. 3 also visualises the “hypothetic” present-day ages of the and satellite galaxies (small filled triangles and stars) in the WM model which have until mostly merged with their central galaxies. This demonstrates that such previously accreted stellar systems are by about 1-3 Gyrs older compared to the stellar populations of present-day central galaxies and will, thus, affect their radial stellar age distributions at large radii (see section 5).
4 Redshift evolution of metallicity gradients
With the distinctively different evolution of the mass-metallicity relation discussed above, we also expect a different evolution of the radial stellar metallicity distribution of the central galaxies, at least with respect to the stars added by the merged satellite galaxies. To demonstrate this we have - for all central galaxies - identified stars that have formed within the galaxies (in-situ) and stars that have formed outside in other (satellite) galaxies that have been added to the system by merging (accreted).
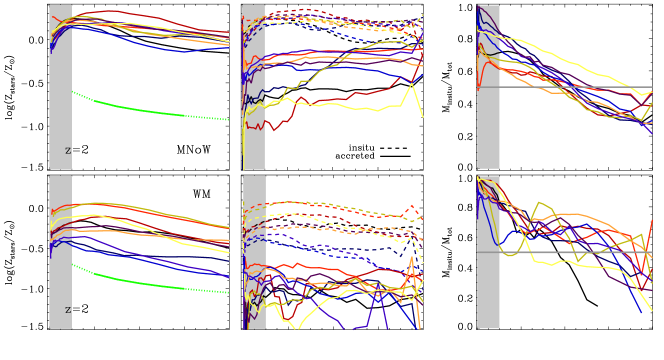
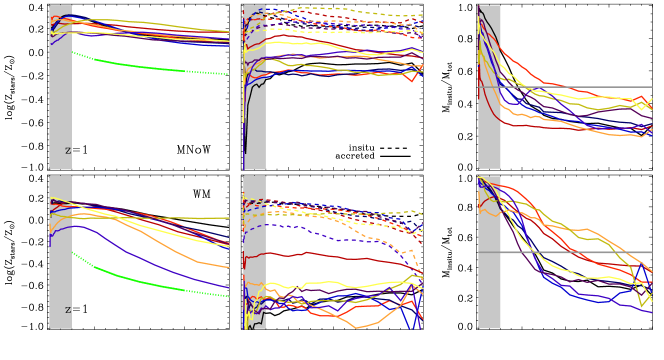
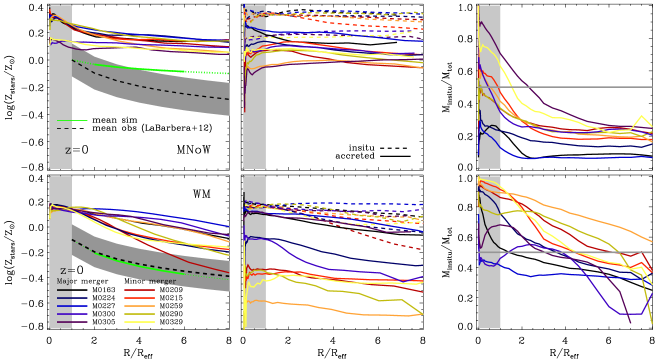
In Fig. 4, we show the total (mass-weighted) stellar metallicity gradients out to 8 for the main galaxies (left panels) at (panels from top to bottom) for the MNoW and the WM galaxies (as indicated in the legend). We have calculated the effective radii at the corresponding redshift step as half-mass radii using the stellar mass within 1/10 111Note that calculating the half-mass radii using the total stellar mass within the virial radius or the half-light radius hardly changes our result. which are summarized (for only) in tables 1 and 2. For the evolution of the effective radii, we refer the reader to Fig. 10 in Hirschmann et al. (2013). In this study it was also shown (their Fig. 9) that the present-day sizes of massive central galaxies can be smaller by a factor of 1.5 - 2 compared to observations. For a fair comparison to observations this has to be considered. This is discussed in more detail in section 8.3.
The grey shaded area marks in each panel of Fig. 4 the innermost region of a galaxy (), which should be handled with care as our simulation do not include any models for AGN feedback, which, however, is expected to strongly influence the innermost regions of a galaxy. Beyond , AGN feedback should hardly have any direct impact on the stellar populations and thus, the metallicity. It can, however, indirectly affect stars that have formed in the central regions and then migrate outwards (see also discussion in section 8.2). Therefore, in the following we will mainly focus on “outer” metallicity gradients.
All the slopes of the fitted metallicity gradients of the total stellar mass (within ) at the three redshifts are summarised in tables 1 (MNoW galaxies) and 2 (WM galaxies) in units of dex/kpc according to
| (2) |
and in units of dex/dex222It is important to note that fitting the slope with a logarithmic x-axis is completely independent of the exact units, as or according to
| (3) |
The mean gradients are illustrated in the left panels of Fig. 4 by the green solid lines (the green dotted lines just show the extension towards smaller and larger radii beyond the fitted regime).
At (first two rows), the gradients for the different models are very similar, and interestingly the inner gradients (inside 1-2 ) are positive in both cases. We suspect this is due to rapid infall of not or only weakly enriched ’primordial’ gas. The MNoW galaxies, due to the missing galactic winds, which are expelling metal rich gas, have already reached super-solar metallicities at small radii and the metallicities drop a bit below the solar metallicity at the larges radii. The WM galaxies have lower metallicities with a much larger spread but a similar shape.
Even by redshift , the inner metallicity gradients (inside 1 ) are (at least partly) still positive (see third and fourth left panels in Fig. 4). Interestingly, positive metallicity gradients in the gas phase at and were detected by recent observational studies of Cresci et al. (2010) and Queyrel et al. (2012), respectively, explaining them by gas dilution due to accretion of primordial gas at these high redshifts as predicted by cold flow models. As stellar metallicity follows the gas-phase metallicity, their high-z observations would be qualitatively consistent with our results.
The first two panels in the middle column of Fig. 4 illustrate the separation into metallicity gradients of in-situ and accreted stars at . We have very few accreted stars at these high redshifts (see Hirschmann et al., 2013) so that the total gradients are almost entirely dominated by in-situ stars. Nevertheless, we have a few accreted stars, which all have lower metallicities with a similar offset for both models as expected from the mass-metallicity relation (see Fig. 3, left bottom panel). Already at this redshift, we can see the clear trend that accreted stars become more important in the outer regions of the galaxies as the in-situ formed stellar fractions drop below 0.5 only at large radii (first two panels in the right column in Fig. 4). Still, for both models the galaxies are dominated by in-situ stars out to in the case of MNoW and in the case of WM.
By redshift the situation changes and the two models evolve differently (see third and fourth row in Fig. 4). The MNoW metallicity gradients have now become very shallow out to large radii at metallicities of at the centre and at large radii (third left panel). The slopes (summarised in table 1) reach a minimum value of dex/dex. The accreted stars have on average a dex lower metallicity than the in-situ stars (third middle panel) and now start dominating the stellar budget at radii larger than (third right panel). By comparison to the flat metallicity distribution of the in-situ stars it is evident that the modest global gradients originate from accreted stars.
For the WM model, by the galaxies have developed clear outer negative stellar metallicity gradients (fourth left panel of Fig. 4. The slopes (summarised in table 2) reach the maximum slope dex/dex, which is twice as large as for the MNoW galaxies. The separation into in-situ and accreted stars indicates that the negative slope partly originates from the in-situ stars, but the steepening of the gradients in the outer regions () is particularly supported by accreted stars which by now have - on average - a significantly lower metallicity (about one order of magnitude) than the in-situ stars and become important at radii larger than (fourth right panel of Fig. 4).
We show the same analysis at in the two bottom rows of Fig. 4. For the MNoW galaxies, the (most) central metallicity has now increased to and drops to at large radii, the slopes reach a minimum value of dex/dex (see table 1). This gradient is mainly driven by the accreted stars (the in-situ distributions are almost all nearly flat), which by now have reached solar metallicity on average (fifth middle panel of Fig. 4) and dominate most systems outside (fifth right panel of Fig. 4).
The WM galaxies (bottom panels of Fig. 4) have lower central metallicities () with much steeper outer gradients down to dex/dex with a mean of dex/dex (see table 2). The reason for the steeper gradients in the WM compared to the MNoW model is twofold: on the one hand, as discussed, the steeper gradients originate from the accretion of metal-poorer stellar populations. On the other hand, also the in-situ components show metallicity gradients contributing to the overall gradients. The latter is most likely due to infall of (particularly re-infall of previously ejected) metal-poor gas onto the galaxy which can be then turned into metal-poor stars as a consequence of an inside-out growth, the same process causing the metallicity gradients in disk galaxies. Late re-accretion of previously ejected gas occurs typically in the WM model due to the strong galactic winds, but not in the MNoW model, where the in-situ gradients are, therefore, relatively flat (see fifth middle panel of Fig. 4). In addition, the WM galaxies have much more extended gas distributions (and maybe associated gas distributions) than the MNoW models in better agreement with observations (e.g. Atlas3D, Serra, 2014).
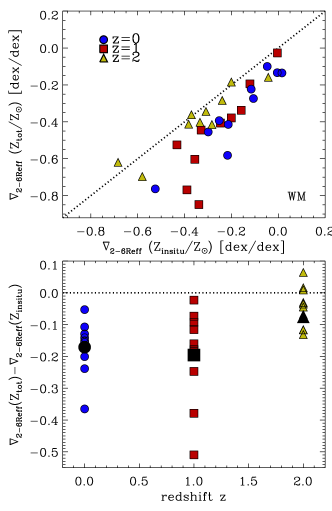
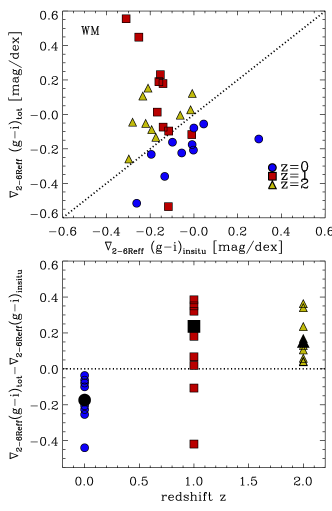
To quantify the contribution of accretion of metal-poor stars for a given “in-situ” gradient, the top panel of Fig. 5 shows the total gradients versus the in-situ gradients in the WM model at (different colours). While at , the total gradients are very similar to the in-situ ones, at and , the total gradient is significantly reduced compared to the in-situ gradient as a consequence of the accretion of metal-poor stars. The lower panel of Fig. 5 shows the difference between the two gradients versus redshift. On average, the in-situ gradients at and (having average values of and ) are reduced by dex (big open symbols) due to accretion of metal-poor stellar population. A detailed comparison with observations will be given in section 8.3.
5 Redshift evolution of stellar age gradients
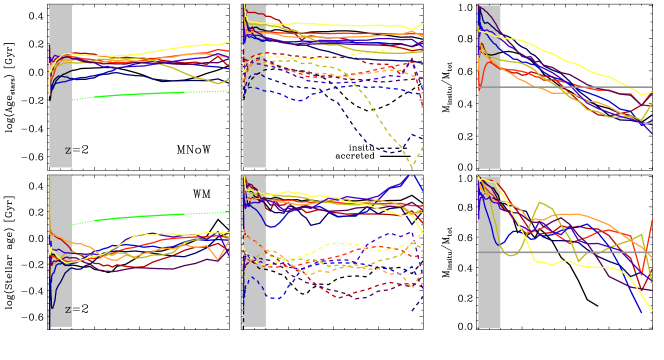
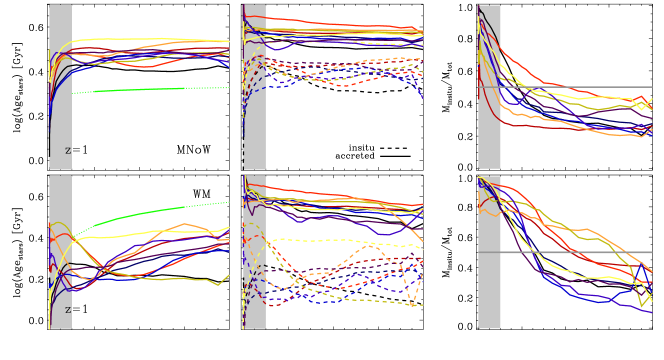
In Fig. 6, we show the same analysis as for the metallicity in Fig. 4, but now for the stellar ages – the second important property determining a stellar population.
Almost independent of the model and redshift, the central regions of the galaxies (illustrated by the grey shaded areas) have steep positive age gradients (left column in Fig. 6), i.e. the core of the galaxies () is (probably unrealistically) young, particularly at . This effect is most likely due to missing AGN feedback in our simulations which would be expected to suppress star formation in the centre of a galaxy stronger than extended SF, and thus, leading to older central stellar populations.
Turning to the outer age gradients (, left column), the WM galaxies are on average younger by dex than the MNoW galaxies due to delayed star formation in the wind model (and at lower redshifts, also to due to re-accretion of previously expelled gas).
At , the WM galaxies show slightly positive age gradients, while the ones of the MNoW galaxies are almost flat (green line indicates the average gradient). In both models, the ages of the accreted stellar population are typically older than that of the in situ formed stellar component (first and second middle panels in Fig. 6). The accreted stars have a similar age in both models, while the in-situ formed stars are much younger in the wind model leading to a significantly larger difference between in-situ and accreted stellar populations for the WM galaxies (0.5 dex, i.e. 1.4 Gyr) than for the MNoW galaxies (0.2 dex, i.e. 0.74 Gyr). This supports the (positively) steeper age gradients in the WM model, even if at that redshift, the stellar mass assembly in both models is clearly dominated by in-situ star formation (right first and second panels of Fig. 6). The younger in-situ formed stellar populations are a consequence of the delayed and enhanced star formation in the WM model due to late infall of previously ejected gas (see also the discussion of the inverted mass-age relation at in section 3).
Towards , the WM and MNoW galaxies are even more different: the age gradients in the MNoW model stay nearly flat, some have a slightly positive slope though (third left panel in Fig. 6). The accreted stars are on average only 1.5 Gyr older than the in-situ formed ones (third middle panel in Fig. 6). This supports the slightly positive but shallow age gradients, since at that redshift, at accretion of stars starts dominating over in-situ star formation (third right panel of Fig. 6).
Instead for the WM model, the age gradients become strongly positive with a high average value of 1.91 dex/dex (see green line in the fourth left panel in Fig. 6). This a consequence of both the (at least partly) steep positive in-situ age gradients and the late accretion of old stellar systems compared to the young in-situ stellar component (see fourth middle panel in Fig. 6). The latter is now more relevant than at as the outer parts of the galaxies are dominated by accretion of stars (see fourth right panel of Fig. 4).
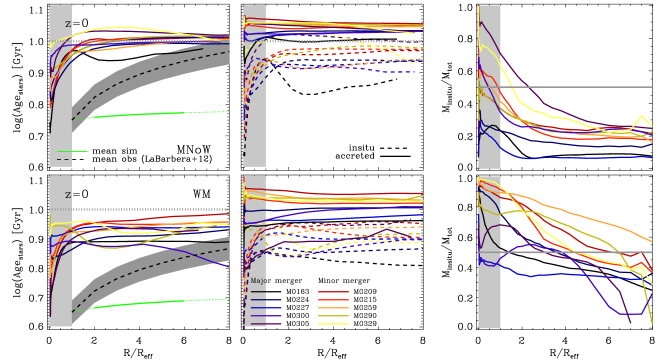
In contrast, at , at large radii (), the average age of the stellar populations is again only very slightly increasing for some galaxies, generally somewhat stronger for the WM (0.04 dex/dex) galaxies than for the MNoW galaxies (0.03 dex/dex, fifth and sixth left panels in Fig. 6). Nevertheless, as for , the shallow outer increase is partly driven by slightly positive in-situ age gradients, but also by the growing importance of the older accreted stars (right fifth and sixth panel of Fig. 6).
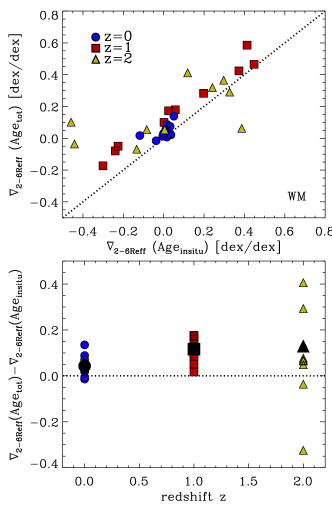
To quantify by how much the accretion of old stellar systems contributes to the steepening of the positive age gradients in the WM model, the top panel of Fig. 7 illustrates the fitted total gradients versus that of in-situ formed stars at (different symbols and colors) and the bottom panel explicitly shows the difference between those gradients versus redshift. At , there is a huge scatter for the in-situ gradients (reaching very positive slopes), while at , they are mainly flat. From Fig. 7 it is evident that the positive in-situ age gradients are indeed steepened due to accretion of older systems (by 0.08 dex at , by 0.12 dex at and by 0.04 dex at , black symbols in the bottom panel), but the effect is rather weak, particularly at . For the MNoW model, such an effect is even less pronounced (not explicitly shown). Overall, we can conclude that positive age gradients originate from the accretion of older stars at large radii.
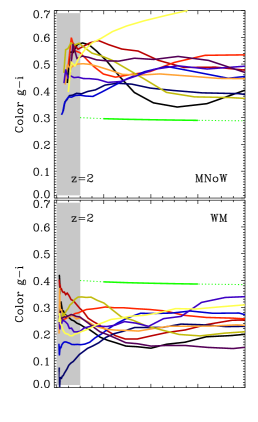
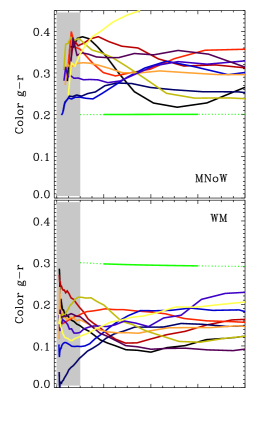
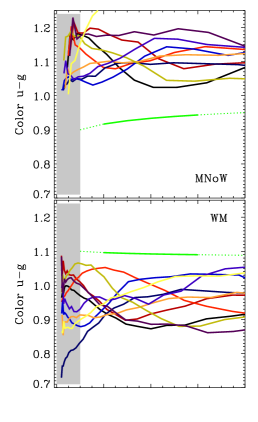
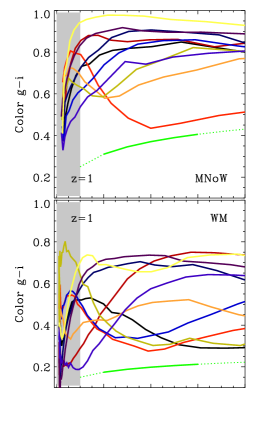
6 Redshift evolution of color gradients
An important set of observables for galaxies are their colours, which are observationally more easy to measure (from images) than age and metallicity (requiring spectroscopic data). Colours are (degenerately) dependent on the intrinsic metallicity and ages of their stellar populations. To facilitate a comparison of the simulated radial distributions of galaxy colours to present-day, observed (outer) color gradients and in particular, to provide predictions for future high-redshift surveys (with a good spatial resolution), we quantify in this section our simulated rest-frame (without extinction effects) colour gradients at and . Neglecting the effect of dust on color gradients is observationally motivated as early-type galaxies exhibit radial gradients of metal absorption features which cannot be attributed to dust (e.g. Gonzalez et al., 1993; Mehlert et al., 2000).
We use the metal- and age-dependent models for the spectral evolution of stellar populations of Bruzual & Charlot (2003), assuming a Chabrier IMF to compute some photometric properties (g-i, g-r and u-g colours) of our simulated galaxies. Note that massive ellipticals are very likely to have steeper than Chabrier IMFs. We treat every star particle as a single stellar population with a given mass, metallicity and age so that we can compute for each star particle the flux in a given band. Summing up over the fluxes in a given radial bin allows to compute the radial distribution of the magnitudes and thus, of the g-i, g-r and u-g colours.
| MNoW | ||||||||||||||||||
|---|---|---|---|---|---|---|---|---|---|---|---|---|---|---|---|---|---|---|
| ID | ||||||||||||||||||
| 1e-1 | 1e-3 | 1e-1 | 1e-2 | 1e-1 | 1e-2 | 1e-1 | 1e-3 | 1e-1 | 1e-3 | 1e-1 | 1e-2 | 1e-1 | 1e-3 | 1e-1 | 1e-2 | 1e-1 | 1e-2 | |
| mag | mag | mag | mag | mag | mag | mag | mag | mag | mag | mag | mag | mag | mag | mag | mag | mag | mag | |
| /dex | /kpc | /dex | /kpc | /dex | /kpc | /dex | /kpc | /dex | /kpc | /dex | /kpc | /dex | /kpc | /dex | /kpc | /dex | /kpc | |
| M0163 | ||||||||||||||||||
| M0209 | ||||||||||||||||||
| M0215 | ||||||||||||||||||
| M0224 | ||||||||||||||||||
| M0227 | ||||||||||||||||||
| M0259 | ||||||||||||||||||
| M0290 | ||||||||||||||||||
| M0300 | ||||||||||||||||||
| M0305 | ||||||||||||||||||
| M0329 | ||||||||||||||||||
| Mean | ||||||||||||||||||
| WM | ||||||||||||||||||
|---|---|---|---|---|---|---|---|---|---|---|---|---|---|---|---|---|---|---|
| ID | ||||||||||||||||||
| 1e-1 | 1e-3 | 1e-1 | 1e-2 | 1e-1 | 1e-3 | 1e-1 | 1e-3 | 1e-1 | 1e-3 | 1e-1 | 1e-3 | 1e-1 | 1e-3 | 1e-1 | 1e-2 | 1e-1 | 1e-2 | |
| mag | mag | mag | mag | mag | mag | mag | mag | mag | mag | mag | mag | mag | mag | mag | mag | mag | mag | |
| /dex | /kpc | /dex | /kpc | /dex | /kpc | /dex | /kpc | /dex | /kpc | /dex | /kpc | /dex | /kpc | /dex | /kpc | /dex | /kpc | |
| M0163 | ||||||||||||||||||
| M0209 | ||||||||||||||||||
| M0215 | ||||||||||||||||||
| M0224 | ||||||||||||||||||
| M0227 | ||||||||||||||||||
| M0259 | ||||||||||||||||||
| M0290 | ||||||||||||||||||
| M0300 | ||||||||||||||||||
| M0305 | ||||||||||||||||||
| M0329 | ||||||||||||||||||
| Mean | ||||||||||||||||||
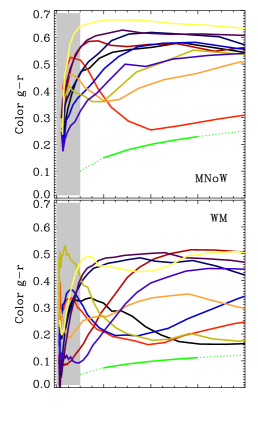
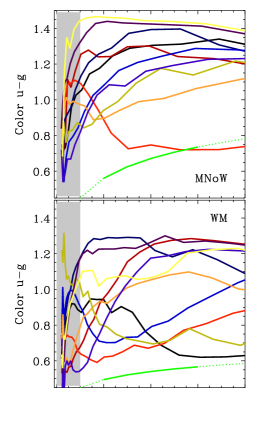
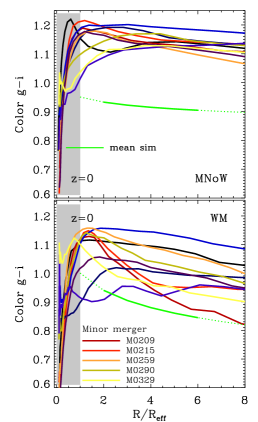
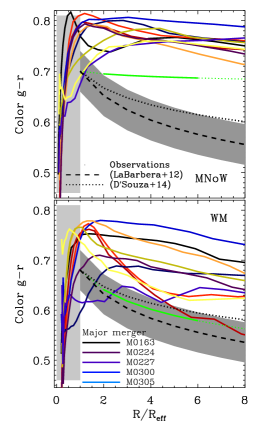
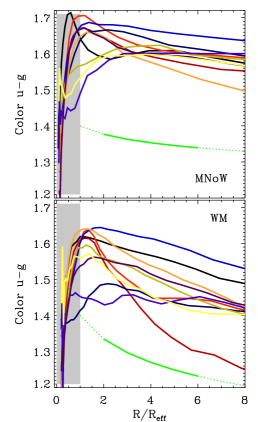
Fig. 8 shows the g-i (left panels), the g-r (middle panels) and the u-g (right panels) colour gradients (solid lines) for the MNoW and the WM galaxies (as indicated in the legend) at . For a given model and redshift, the overall behaviour for the gradients with different colours is very similar and the corresponding slopes (between ) are given in tables 3 and 4.
Irrespectively of redshift and colour, WM galaxies are generally slightly bluer than MNoW galaxies as a consequence of their younger stellar populations with lower metallicity. In addition, all galaxies of both models are at and significantly bluer at the centre, revealing steep positive colour gradients at (marked by the grey shaded area in Fig. 8). This is an obvious consequence of the positive stellar age gradients at these innermost radii (as seen in Fig. 6). Massive galaxies being so blue in their centres is an unrealistic artefact of our models most likely due to missing AGN feedback as already discussed before.
In observational literature (Ferreras et al., 2009; Suh et al., 2010), there is found an interesting correlation in the sense that early-type galaxies with blue cores (positive colour gradients) are mostly blue overall, and associated to recent SF. In contrast, the vast majority of massive early-type galaxies (which we have in our simulated sample) out to z 1 feature red overall colours and red cores (negative colour gradients). It will be interesting to see whether simulations with AGN feedback will help to produce such a correlation, which we postpone to forthcoming studies.
Turning to larger radii (which are not expected to be significantly influenced by AGN feedback), at , the shape of the g-i, g-r and u-g colour gradients ranges from strongly negative (outer parts are bluer) to strongly positive (outer parts are redder), irrespectively of the model (first two rows of Fig. 8) so that the average gradients (green lines) are nearly flat.
In general, whether colour gradients are positive or negative is driven by the interplay of the radial distribution of stellar metallicity and ages: negative metallicity gradients imply more negative colour gradients, while positive age gradients would result in more positive colour gradients. Depending on which effect is stronger, leads to either overall positive or negative colour gradients. At , M0227 and M0300 WM galaxies (dark blue lines in second left panel of Fig. 6), for example, have strongly positive age gradients outweighing the effect of their negative metallicity gradients and thus, leading to overall positive slopes for the colour distribution. Instead, M0209 (red line in second left panel of Fig. 6), for example, has both a negative age gradient and metallicity gradient clearly resulting in a strongly negative colour gradient (second row in Fig. 8).
The situation changes towards , where the two models start to behave differently. Almost all of the MNoW galaxies are now redder at the outskirts (positive average colour gradient, third row of Fig. 8). This is a consequence of the relatively shallow metallicity gradients which can apparently not overcome the slightly positive age gradients. Instead, the WM galaxies have again both steeply positive and steeply negative gradients (resulting in an overall only weakly positive mean slope, green lines in the fourth row of Fig. 8) depending on whether the positive age or the negative metallicity gradient predominates.
Finally at , the MNoW galaxies have only very shallow colour gradients, either slightly decreasing or increasing with an average slopes of mag/dex, mag/dex and mag/dex for the g-i, g-r and u-g colors (see table 3), respectively. The shallow colour gradients in the MNoW model stem from the relatively flat age and only slightly negative metallicity gradients. As discussed, the former originates from a relatively old in-situ stellar population (compared to the accreted stars), and the latter from the accretion of relatively metal-rich stellar systems in the MNoW model.
Instead with galactic winds, nearly all of the WM galaxies become continuously bluer with increasing radius and thus, reveal significantly steeper negative colour gradients than the MNoW galaxies (with mean slopes of mag/dex, mag/dex and mag/dex for the g-i, g-r and the u-g colours, see table 4). This behaviour is entirely driven by the steeper metallicity gradients of the WM galaxies washing out any effect of the slightly increasing age gradients. The result is also consistent with studies of massive spheroidal galaxies from a visually classified sample extracted from the Advanced Camera for Surveys/Hubble Space Telescope (ACS/HST) images (Ferreras et al., 2009), where a comparison with a model, assuming a gradient caused by age, predicts a large change of the colour gradient with redshift, at odds with the observations. Instead, for a model assuming that the color gradient is caused by metallicity, they find a good agreement with what is observed.
We want to emphasize that, as at and at , both the positive age gradients and the negative metallicity gradients are mainly driven by the accretion of old and metal-poor stellar systems (see sections 4 and 5), also the steepening of the colour gradients (either positive or negative) originate from accretion, particularly in the WM model.
To demonstrate how much of the total colour gradients is really caused by the accretion of stellar systems, the top panel of Fig. 9 shows - as an example for the g-i colors only (but the g-r and u-g colours behave in the same way) - the total colour gradients versus the in-situ ones at (indicated by different colours) for the WM model. The bottom panel illustrates the corresponding difference between the two gradients versus redshift.
At , the in-situ gradients are all negative, while the total gradients are both, negative and positive. This shows that accretion (of redder stellar populations due to their age) makes the g-i colour gradients on average more positive by +0.15 mag/dex. At , this effect is even amplified, the in-situ g-i colour gradients (again only negative) become more positive by the accretion by +0.24 mag/dex. This trend is, however, entirely reversed at , where the slopes of the in-situ distributions become more negative by mag/dex through accretion of bluer (as more metal-poor) stellar systems. This demonstrates that the average negative g-i colour gradient of 0.2 mag/dex is almost entirely driven by stellar accretion. We will further discuss in section 8.3 that for being consistent with current, present-day observations, the stellar accretion seems to play a crucial role.
7 Effect of the merger history on the gradients
We demonstrated in section 4, 5 and 6 that the stellar feedback model has a significant effect on stellar population gradients (e.g. a steepening at ), particularly at lower redshifts. Apart from the strong influence of the feedback model, however, recent observations also suggest a significant effect of the individual past merger history on the strength of the metallicity gradients: Kewley et al. (2010), for example, show that metallicity gradients in close pairs are significantly shallower than those in isolated galaxies suggesting a strong relationship between the slope of the gradients and the galaxy (major) mergers.
To visually relate the recent merger histories of present-day WM galaxies333We discuss that only for the WM model, but the effects are the qualitatively same in the MNoW model. with their metallicity, age and colour gradients, the black-blue lines in Figs. 4, 6 and 8 indicate galaxies which experienced at least one major galaxy merger since , while the red-yellow lines illustrate those having undergone only minor galaxy mergers (using the results shown in Fig. 2). This already shows “visually” that present-day galaxies having experienced a recent major merger have typically flatter gradients than those with a more quiet merger history.
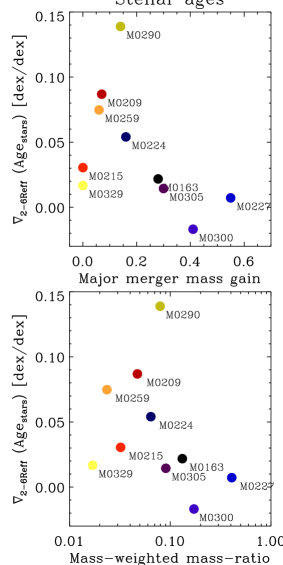
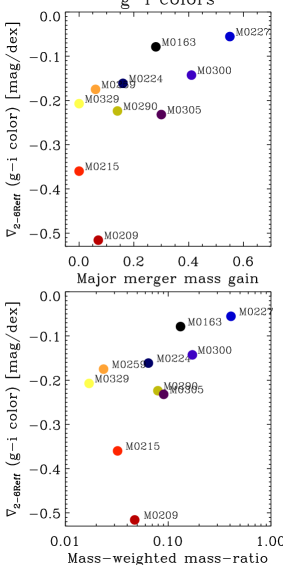
Fig. 10 quantifies the connection between the galaxy merger history and the steepness of the metallicity (left panels), age (middle panels) and g-i colour gradients (right panels): we show the fitted metallicity/age/g-i colour gradients at for WM galaxies (shown in table 2 and 4) versus the mass gain by major mergers (top panel) and versus the mass-weighted merger mass-ratio (bottom panel). The mass gain by major mergers considers the entire stellar mass which was brought into the main galaxy by major mergers since normalised to the present-day stellar mass. The mass-weighted mass-ratio (see Oser et al., 2012), a measure for the “strength” of a merger, is computed according to
| (4) |
where is the merger mass-ratio, the stellar mass of the infalling satellite and the total growth in stellar mass since .
As expected, the stellar age gradients (middle panels) tend to be negatively related with both quantities which are shown, as galaxies having undergone major mergers have a zero or even slightly negative age gradient, while those galaxies having experienced only minor mergers can have a broad range of slopes (from very shallow to more positive).
Instead, the fitted metallicity and g-i color gradients strongly correlate with the past merger history: for a major merger mass gain above 20 % or a mass-weighted mass-ratio above 0.1, the metallicity and colour gradients are flatter than dex/dex and mag/dex, respectively. Instead, for lower x-values, the metallicity and colour gradients are mostly more negative than dex/dex and mag/dex, respectively444Note, however, that for higher redshifts and , we do not find any clear correlation between the merger history and the slope of the metallicity, age and colour gradients (not explicitly shown), most likely because the mergers are typically more gas-rich inducing a lot of central star formation..
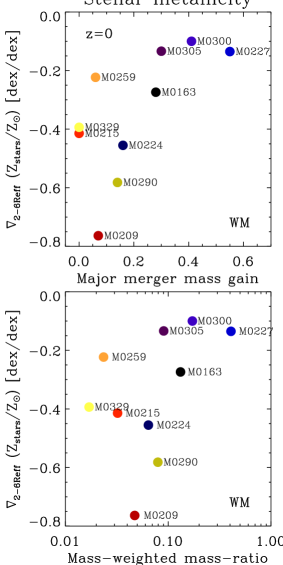
For the metallicity gradients, this is due to the fact that the accreted stars show a huge variety of metallicities from to (see bottom middle panel of Fig. 4) depending on the exact merger history: in case of a recent major merger, the accreted metallicity is significantly larger than without a major merger (as more massive galaxies have higher metallicity, see left column of Fig. 3). The higher metallicity of the accreted stars, together with the different mixing behaviour (violent relaxation) in case of major mergers, flattens the total metallicity gradients. Interestingly, accreted metallicity gradients can also have negative slopes, indicating the metal poor stars living in the outer regions of accreted satellites are stripped at larger radii (see e.g. Hilz et al., 2012; Hilz et al., 2013).
The above explanation is also valid for the relation between colour gradients and the individual merger history, as at , the negative colour gradients closely follow the metallicity gradients (outweighing the shallow positive age gradients).
The result that major mergers flatten metallicity gradients is consistent with earlier studies of e.g. Kobayashi (2004) who performed chemo-dynamical simulations of 124 elliptical galaxies in a cosmological context. For the evolution of the metallicity gradients they find a destruction of steep gradients by mergers to an extent dependent on the progenitor mass ratio. Also Rupke et al. (2010) show, using equal mass merger simulations, that the gradients flatten shortly after the first per-centre passage by radial inflow of low-metallicity gas from the outskirts of the two merging (disk) galaxies.
Fig. 10 also shows that - when considering colour and metallicity gradients, the “M0259” galaxy seems to be an “outlier” having a shallow gradient despite of the small contribution by major mergers. However, its merger history is extremely quiet with only one minor merger after (see Fig. 2) so that the metallicity is dominated by that of in-situ formed stars out to large radii (see bottom right panel of Fig. 4) leading to a shallow total metallicity and colour gradient. This also demonstrates that both the occurrence of major mergers and the absence of minor mergers can significantly flatten the metallicity gradients, while a couple of minor mergers typically help to steepen the gradients.
Overall, this result bears an important implication for observations, as it can help to re-construct the past assembly history for observed present-day metallicity and colour gradients: The relation between the steepness of the gradients and the individual merger history implies that observed massive galaxies having steep outer gradients most likely have not experienced any major merger event after , but instead have had numerous minor mergers.
8 Discussion
8.1 Origin of insitu formed stars at large radii
We have seen in section 4 that – at least for the wind model – insitu star formation can dominate the stellar populations in central galaxies out to 4-5 at (see the right panels in Figs. 5 and 7). At first sight, it is not clear whether those star particles formed already at such large radii or whether they instead formed in the central region, but were then migrated out to larger radii. Investigating the origin of insitu formed stars presently residing at large radii is particularly important for exploring the significance of missing AGN feedback on our analysis (see next subsection).
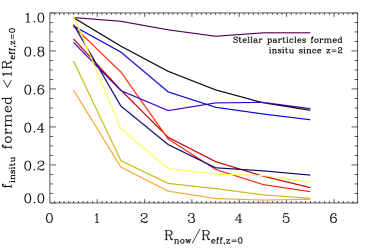
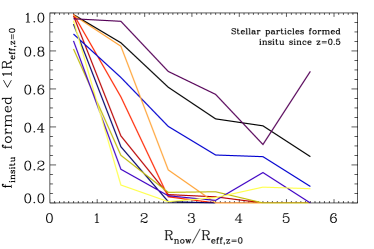
Fig. 11 shows the fraction of present-day in-situ stars that have formed inside the present-day (physical) effective radius () and have migrated outwards versus the present-day radial distance to the galaxy center. In the top panel, we consider insitu star formation since , while in the bottom panel only since .
The majority of the centrally formed stars at higher redshifts are still residing in the central part () at . In particular for galaxies not having experienced any recent major mergers (see yellow-red lines), the fraction of migrated stars is below 30% (since z=2) and 15% (since z=0.5). Therefore, the majority of in-situ stars at the investigated radii were also born at large radii.
The in-situ component of galaxies with one or more recent major mergers (since or since , see blue-lila lines) can , however, be dominated by migrated stars (up to 90% in the most extreme case). But for those galaxies the global stellar populations gradients are widely dominated by accretion of stars beyond weakening the overall effect of stellar migration.
8.2 Possible effects of AGN feedback on stellar population gradients
The study of Hirschmann et al. (2013) has already indicated that – compared to abundance matching models – in the simulations (in particular in the wind model) SFRs are over-estimated in central galaxies residing in massive halos () only after , which can be, therefore, expected to be mainly suppressed by AGN feedback. Also the study of Choi et al. (2014), investigating the impact of mechanical and radiative AGN feedback in cosmological zoom simulations, illustrates that the SFRs particularly decline after z=0.6 with respect to the simulations without (or inefficient) AGN feedback (see their Fig. 8). We may therefore speculate that additional feedback from black holes will preferentially affect the present-day stellar population gradients, but less those at higher redshifts .
In addition, as we have shown in the last subsection, stellar particles formed insitu within since , which are most likely affected by AGN feedback, are hardly migrated beyond at present-day, at least for those galaxies which have not experienced a recent major merger. The fraction of the corresponding migrated stars is lower than 30% or 15% when considering insitu star formation since or , respectively. We, therefore, conclude that AGN feedback will hardly affect the (steep) metallicity and color gradients of galaxies without any major mergers. This might be especially true for AGN feedback affecting the late insitu star formation after .
Instead, energy release from AGN may play a more important role for the stellar population gradients of galaxies having undergone major mergers. As their global stellar populations are mostly dominated by accreted stellar systems (beyond ), insitu formed stars (and thus, the migration of stars) play a less significant role for the outer population gradients. Moreover, as that gradients are widely flat, we would only expect a decrease of the global stellar metallicity content or color (making them less metal-rich and thus, bluer) but no significant change of slopes themselves. Overall, we may, therefore, conclude that additional AGN feedback should not significantly alter the outer stellar population gradients beyond . However, a further, more detailed quantification of how AGN feedback may affect insitu star formation and the corresponding stellar population distributions clearly goes beyond the scope of this study.
Furthermore, one may wonder whether additional AGN feedback would also affect the contribution from accreted systems to the global stellar population gradients. In Fig. 2 of Hirschmann et al. (2013) we have shown – as already stated above – that only central galaxies residing in halos with masses above seem to be mainly affected by the over-cooling problem after z=0.5. Satellite galaxies instead, residing in less massive halos are in reasonably good agreement with SFRs derived from abundance matching predictions, even if for the lowest mass satellites, SFRs might be too large due to still too inefficient galactic wind feedback in our simulations (see Davé et al., 2013 for further discussion). The latter point implies that a model having stronger galactic winds might lead to even stronger metallicity gradients (due to even more efficiently suppressed metal enrichment in lower mass satellite galaxies). Overall, we do not expect that AGN feedback will have a significant impact on suppressing star formation in satellite galaxies.
8.3 Comparison with observations
In general, comparing our simulated, present-day metallicity, age and colour gradients at large radii (beyond ) is difficult as most observational studies focus on inner gradients out to only which are easier and more precise to measure. In the following, we will mainly compare the observational results of Coccato et al. (2010); La Barbera et al. (2012); Greene et al. (2012, 2013); Pastorello et al. (2014); D’Souza et al. (2014) and Raskutti et al. (2014) for ellipticals to our simulations, even if most of these studies do not measure gradients significantly beyond (expect of La Barbera et al., 2012). Therefore, we want to emphasize that our simulations provide predictions of outer gradients for future, more elaborate observational surveys which will (hopefully) strengthen our (preliminary) conclusions below.
However, as mentioned before, due to our possibly by a factor of 1.5-2 too small galaxy sizes, the absolute range within which the slopes are fitted changes when adopting more realistic effective radii (the slopes remain unchanged, though). For example, artificially increasing our present-day effective radii by a factor of 2 would lead to a decrease of the fitted radial range of 1-4 (instead of 2-6 ). For a fair comparison with observations we will keep this in mind in the following discussion.
8.3.1 Colour gradients
Starting with the colour gradients, in the photometric study by La Barbera et al. (2012), they investigated colour gradients of early-type galaxies () even out to using the SDSS-based Spider survey. They measure average slopes for g-i colours of mag/dex and for g-r colours of mag/dex (see black dashed line and grey shaded areas in Fig. 8). Note that the g-r color gradients out to which might be more consistent to compare to our simulations hardly change ( mag/dex). The observed g-i colours, however, are still affected by a “red-halo”, i.e. wings in the PSF (point spread function) cause a spurious red colour excess at large radii, typically flattening the gradients. As discussed in their paper, the outer g-i gradients are, therefore, not as trustable as the g-r gradients. Compared to observed, reliable g-r colour gradients, MNoW galaxies have on average too flat gradients ( mag/dex), while those of the WM galaxies are reasonably steep ( mag/dex) – in good agreement with the observations.
The recent work of D’Souza et al. (2014) show g-r colour profiles out to 100 kpc for stacked ellipticals (to be more precise, high concentration galaxies) with masses between using roughly 45.500 galaxies from the SDSS survey. They find values between mag/dex with little mass trend, in perfect agreement with the g-r colour gradients predicted by our simulations (see black dotted lines in Fig. 8, where we have used the slope of mag/dex measured for stellar masses of ).
In addition, the on-going MegaCam survey of Atlas3D galaxies (Duc et al., 2014, MNRAS in press) will soon provide observational constraints on the outer colour gradients for a large sample of more than 200 early-type galaxies (Karabal et al., in prep). Preliminary results on a sub-sample of it (24 objects) indicate a mean g-r colour slope of mag/dex, much flatter than predicted by our WM model. These preliminary results are not corrected for artificial red halos contaminated by their galactic nuclei (wings in the PSF), typically flattening the gradients (even if the galaxies in the subsample have at first sight no visible contamination). Nevertheless, correctly accounting for this is expected to significantly steepen the gradients.
Overall, this indicates that strong stellar winds are crucial for producing massive galaxies with realistic (steep enough) colour gradients at large radii mainly driven by the accretion of older, bluer stellar systems (in-situ gradients are not sufficient).
8.3.2 Metallicity gradients
Turning to the metallicity gradients, in a recent spectroscopic study, Pastorello et al. (2014), using the SLUGGS survey, investigated metallicity gradients up to . Their two dozen early-type galaxies have masses in the range . For comparable stellar masses, their galaxies reveal slopes between dex/dex using stellar population models of Vazdekis et al. (2003).
In the study by La Barbera et al. (2012), where metallicities are derived from colors using different stellar population synthesis models, they find for massive galaxies with outer metallicity gradients () in the range of dex/dex depending on the stellar population model. For the same stellar population model we are using (Bruzual & Charlot, 2003), they find a mean metallicity gradient of dex/dex measured out to (illustrated by the black dashed lines and the grey shaded area in Fig. 4). Metallicity gradients measured only out to would result in a mean slope of dex/dex in even better agreement with our simulated result.
In addition, in a recent study of Montes et al. (2014) analysing the metallicity distribution of M87, they find at radii larger than a metallicity gradient of dex/dex more consistent with gradients of the WM galaxies. Coccato et al. (2010), however, investigating metallicity gradients of two Ellipticals in the Coma cluster, find a shallower gradient of dex/dex.
Overall, our WM galaxies are able to cover such a broad range of slopes ( dex/dex) much better than the MNoW galaxies whose slopes are clearly too flat (within the range of dex/dex). The average metallicity gradient of the WM galaxies ( dex/dex) is in excellent agreement with the one of La Barbera et al. (2012) and the comparable mass galaxies from Pastorello et al. (2014).
As expected a priori, this implies that a strong stellar feedback is a key mechanism to be consistent with observed steep metallicity gradients in massive galaxies in the local Universe. In addition, we demonstrated that in the WM model, the in-situ gradients are much flatter (by roughly 0.2 dex) than the total gradients and they would, therefore, be insufficient to reproduce the observational data. This convincingly highlights the crucial role of the stellar accretion of metal-poor systems in establishing realistically steep metallicity gradients.
8.3.3 Age gradients
We saw in section 5, that both models predict strong positive inner age gradients at in tension with recent observations of Greene et al. (2013); Raskutti et al. (2014) (who study the radial dependences of stellar populations of 33 massive, near-by elliptical galaxies) and also of González Delgado (2014), analysing CALIFA galaxies (finding roughly flat age gradientes), but in better qualitative agreement with La Barbera et al. (2012). As, however, the former observations are based on spectral templates, which typically result in a higher accuracy in the inner region than a derivation from colours (which instead allows to measure stellar populations out to larger radii), the inner drop in the simulations might be unrealisticly strong entirely driven by recently (in-situ) formed new, young stars (bottom, middle panels of Fig. 6). 555We also want to mention that the strong age gradients by La Barbera et al. (2012) are mostly found for group galaxies (i.e. mainly satellites, as group centrals are a minor fraction of the group galaxies), while field galaxies (i.e. centrals) have also only mildly positive or even inverted age gradients. Spectroscopic studies are based on smaller samples, and the definition of the environment is far less clear.
The tension with observations indicates some weaknesses of our models: in both runs, we do not account for any feedback from AGN which is, however, expected to particularly reduce the late star formation in the central parts of a galaxy and, therefore, to reduce or even alleviate the positive inner gradients. Moreover, the WM galaxies (where the in-situ formed stars tend to be even younger than in the MNoW galaxies), suffer from too much late re-accretion of previously expelled gas leading to (too) high star formation rates at low redshifts for massive galaxies (see e.g. Hirschmann et al., 2013; Oppenheimer et al., 2010).
Instead, the almost flat, but slightly positive outer age gradients are consistent with recent observations of Greene et al. (2013), Raskutti et al. (2014) and of González Delgado (2014) out to 3 , while La Barbera et al. (2012) predict steeper positive age gradients out to 8 up to 0.5 dex/dex in tension with our results (see black dashed lines in Fig. 6). However, we have to keep in mind that the latter observational results have also a large scatter in stellar age at such large radii due to their derivation from photometry (colours). Here, future, more detailed observational studies will be necessary to draw more reliable conclusions.
9 Summary
In this study, we investigate the origin of metallicity, age and color gradients in cosmological, zoom simulations of ten massive galaxies () at large radii () with a particular focus on the role of accretion of stars in major and minor mergers. We present the differential effect of strong stellar feedback driving galactic winds and the influence of the individual merger history (distinguishing between minor and major mergers) on the steepness of the population gradients.
The zoom simulations include radiative cooling, star formation, metal enrichment due to SNII, SNIa and AGB stars and depending on the simulation set, an empirically motivated model for momentum-driven galactic winds (Oppenheimer & Davé, 2006, 2008). While metallicity and stellar ages are a direct output of the simulation, we employed metal- and age-dependent models for the spectral evolution of stellar populations (Bruzual & Charlot, 2003) to also derive photometric galaxy properties as the g-i, g-r and u-g colours. Our main results can be summarised as follows:
-
•
Galactic winds significantly delay star formation and thus, metal enrichment of a galaxy, leading to a significantly different evolution of the mass-metallicity and mass-age relation compared to simulations without winds. At a given stellar mass galaxies simulated with winds have lower metallicities and the effect is stronger for low mass galaxies and at lower redshift. While in the model without winds the relation flattens towards (all galaxies and their satellites have super-solar metallicity), in the wind model, the lower mass (satellite) galaxies still have sub-solar metallicity resulting in a good match to the present-day observed mass-metallicity relation. These results are in agreement with previous cosmological simulations of large cosmological volumes and individual zooms using a similar simple purely empirical wind model (e.g. Oppenheimer & Davé, 2006, 2008; Hirschmann et al., 2013; Marinacci et al., 2013; Anglés-Alcázar et al., 2014).
As many of the (low metallicity in the wind model) satellites are accreted onto the central galaxies and the accreted stars typically become more dominant at large galacto-centric radii, this has important consequences for the outer population gradients.
-
•
The outer negative metallicity gradients (at radii ) of present-day massive galaxies are mainly determined by the accretion of stars (added from minor mergers) with lower metallicity at redshifts . Accreted low metallicity stars become more and more dominant at large radii and the metallicity gradients of in-situ formed stars in the wind model are enhanced by dex/dex by accretion of metal-poor systems.
Overall, the model with galactic winds predicts much steeper total metallicity gradients (on average dex/dex at and dex/dex at ) as the accreted stellar systems are significantly more metal-poor and despite of the fact that much less stellar mass in total is accreted compared to the no-wind model.
The steep gradients in the wind model tend to be more consistent with recent observations of massive early-type galaxies in the local Universe by La Barbera et al. (2012) and Pastorello et al. (2014). This clearly supports our a priori expectation that both the stellar accretion and strong galactic-scale winds - reducing the metallicity in the accreted systems - are the physical mechanisms setting the outer metallicity gradients.
-
•
The age gradients at large radii are flat or slightly positive as the accreted systems are in general older than the central galaxies independent of the model (see also Oser et al., 2010). The wind model, however, predicts on average more positive gradients than the model without winds, particularly at (mean slope of dex/dex as opposed to dex/dex).
At , also the age gradients in the wind model are rather flat (with a mean positive slope of dex/dex) which are consistent with recent observations of massive elliptical galaxies by Greene et al., 2013, but too shallow compared to the study of La Barbera et al., 2012 (where ages are derived from photometric properties).
-
•
Gradients in galaxy colour (g-i, g-r, u-g) are the result of the superposition of age and metallicity distributions. At higher redshifts , we find galaxies with both strongly positive and strongly negative colour gradients (g-i, g-r, u-g) depending on whether positive age or negative metallicity gradients have a stronger impact on the populations. At , negative metallicity gradients outweigh the relatively shallow positive age gradients leading to overall negative colour gradients in both models.
In the wind model, the colour gradients are significantly steeper than in the model without winds (reaching average slopes of , and mag/dex for g-i, g-r and u-g colours, respectively) more consistent with the broad range of observed gradients of e.g. La Barbera et al. (2012), but too flat compared to preliminary results from Karabal et al. for discussed reasons (in prep., Atlas3D survey). Overall, the colour gradients for the in-situ component only appear too shallow to be consistent with observations.
-
•
The strength of the gradients strongly depends on the individual merger history, where a recent major merger (since ) typically flattens the gradients (White & Rees, 1978; Kobayashi, 2004; Di Matteo et al., 2009; Rupke et al., 2010; Navarro-González et al., 2013), while minor mergers significantly increase the slopes to more negative values for colours and metallicities or to more positive values for ages (Villumsen, 1983; Hilz et al., 2012; Hilz et al., 2013)
Overall, we can conclude that stellar accretion (via minor mergers) of low mass satellites results in steep outer negative metallicity and colour gradients and slightly positive age gradients successfully matching the broad range of observed colour and metallicity profiles of local galaxies at large radii. Nevertheless, a drawback of our cosmological zoom simulations is the missing AGN feedback which is expected to suppress late central star formation in massive galaxies (currently overestimated leading to unrealistically young and blue cores of our galaxies). However, we want to emphasise that the stellar population distributions of galaxies investigated and discussed only at large radii are not expected to be significantly affected by such additional physical processes. Instead, they are supposed to primarily influence the central regions (at ), which were not the focus of this study.
In addition, our sample of massive galaxies consists of only ten galaxies so that the results cannot be interpreted in a statistical sense, we only highlight the effect of the accretion of the stellar populations of metal poor galaxies, which is a direct consequence of strong stellar feedback at all cosmic epochs in the simulations. We note that this effect will only be of importance for massive early-type galaxies in the range of , i.e. massive centrals in galaxy groups. The stellar populations of lower mass early-type galaxies are expected to be dominated by in-situ star formation with significantly lower fractions of accreted stars. Direct evidence for this is the high fraction of very flattened axi-symmetric systems with disk-like morphologies and kinematics (Rix et al., 1999; Cappellari, 2011b, a; Emsellem, 2011; Weijmans, 2014). Here the abundance is most likely set by processes similar to inside-out forming spiral galaxies. The expected decreasing importance of stellar accretion with decreasing stellar mass is supported by abundance matching estimates (Moster et al., 2013; Behroozi et al., 2013; Yang et al., 2013), semi-analytical models (Guo & White, 2008b) and direct simulations (Gabor & Davé, 2012; Lackner & Ostriker, 2010; Lackner et al., 2012b).
In forthcoming studies we plan to significantly increase our sample of re-simulated galaxies to obtain a statistically more relevant analysis for stellar population gradients and to include models for black hole growth and AGN feedback to explore their effects on metallicity, age and colour distributions in the central region of a galaxy. This will provide additional constraints on different models for AGN feedback which are still only poorly understood.
Acknowledgements
We thank Ignacio Ferreras, Jenny Greene, Francesco La Barbera, Pierluigi Monaco and Nicola Pastorello for fruitful discussions. In particular, we are very grateful to Francesco La Barbera for providing us with fits to observed color gradients.
MH acknowledges financial support from the European Research Council under the European Community’s Seventh Framework Programme (FP7/2007-2013)/ERC grant agreement n. 202781 and from the European Research Council via an Advanced Grant under grant agreement no. 321323 NEOGAL. TN acknowledges support from the DFG Cluster of Excellence ’Origin and Structure of the Universe’. DAF thanks the ARC for support via DP130100388.
References
- Anglés-Alcázar et al. (2014) Anglés-Alcázar D., Davé R., Özel F., Oppenheimer B. D., 2014, ApJ, 782, 84
- Annibali et al. (2007) Annibali F., Bressan A., Rampazzo R., Zeilinger W. W., Danese L., 2007, A&A, 463, 455
- Behroozi et al. (2013) Behroozi P. S., Wechsler R. H., Conroy C., 2013, ApJ, 770, 57
- Bell et al. (2006) Bell E. F., Naab T., McIntosh D. H., Somerville R. S., Caldwell J. A. R., Barden M., Wolf C., Rix H.-W., Beckwith S. V., Borch A., Häussler B., Heymans C., Jahnke K., Jogee S., Koposov S., Meisenheimer K., Peng C. Y., Sanchez S. F., Wisotzki L., 2006, ApJ, 640, 241
- Bezanson et al. (2009) Bezanson R., van Dokkum P. G., Tal T., Marchesini D., Kriek M., Franx M., Coppi P., 2009, ApJ, 697, 1290
- Boylan-Kolchin et al. (2005) Boylan-Kolchin M., Ma C.-P., Quataert E., 2005, MNRAS, 362, 184
- Boylan-Kolchin et al. (2006) Boylan-Kolchin M., Ma C.-P., Quataert E., 2006, MNRAS, 369, 1081
- Boylan-Kolchin et al. (2008) Boylan-Kolchin M., Ma C.-P., Quataert E., 2008, MNRAS, 383, 93
- Bruzual & Charlot (2003) Bruzual G., Charlot S., 2003, MNRAS, 344, 1000
- Buitrago et al. (2008) Buitrago F., Trujillo I., Conselice C. J., Bouwens R. J., Dickinson M., Yan H., 2008, ApJ, 687, L61
- Cappellari (2011a) Cappellari M. e. a., 2011a, MNRAS, 413, 813
- Cappellari (2011b) Cappellari M. e. a., 2011b, MNRAS, 416, 1680
- Carollo et al. (1993) Carollo C. M., Danziger I. J., Buson L., 1993, MNRAS, 265, 553
- Cenarro & Trujillo (2009) Cenarro A. J., Trujillo I., 2009, ApJ, 696, L43
- Chabrier (2003) Chabrier G., 2003, PASP, 115, 763
- Chiappini et al. (2001) Chiappini C., Matteucci F., Romano D., 2001, ApJ, 554, 1044
- Choi et al. (2014) Choi E., Ostriker J. P., Naab T., Oser L., Moster B. P., 2014, ArXiv e-prints
- Cimatti et al. (2008) Cimatti A., Cassata P., Pozzetti L., Kurk J., Mignoli M., Renzini A., Daddi E., Bolzonella M., Brusa M., Rodighiero G., Dickinson M., Franceschini A., Zamorani G., Berta S., Rosati P., Halliday C., 2008, A&A, 482, 21
- Coccato et al. (2010) Coccato L., Gerhard O., Arnaboldi M., 2010, MNRAS, 407, L26
- Cole et al. (2000) Cole S., Lacey C. G., Baugh C. M., Frenk C. S., 2000, MNRAS, 319, 168
- Conroy et al. (2014) Conroy C., van Dokkum P., Kravtsov A., 2014, ArXiv e-prints
- Cooper et al. (2013) Cooper A. P., D’Souza R., Kauffmann G., Wang J., Boylan-Kolchin M., Guo Q., Frenk C. S., White S. D. M., 2013, MNRAS, 434, 3348
- Cresci et al. (2010) Cresci G., Mannucci F., Maiolino R., Marconi A., Gnerucci A., Magrini L., 2010, Nature, 467, 811
- Daddi et al. (2005) Daddi E., Renzini A., Pirzkal N., Cimatti A., Malhotra S., Stiavelli M., Xu C., Pasquali A., Rhoads J. E., Brusa M., di Serego Alighieri S., Ferguson H. C., Koekemoer A. M., Moustakas L. A., Panagia N., Windhorst R. A., 2005, ApJ, 626, 680
- Dalla Vecchia & Schaye (2008) Dalla Vecchia C., Schaye J., 2008, MNRAS, 387, 1431
- Damjanov et al. (2009) Damjanov I., McCarthy P. J., Abraham R. G., Glazebrook K., Yan H., Mentuch E., LeBorgne D., Savaglio S., Crampton D., Murowinski R., Juneau S., Carlberg R. G., Jørgensen I., Roth K., Chen H.-W., Marzke R. O., 2009, ApJ, 695, 101
- Davé et al. (2013) Davé R., Katz N., Oppenheimer B. D., Kollmeier J. A., Weinberg D. H., 2013, MNRAS, 434, 2645
- Davies et al. (1993) Davies R. L., Sadler E. M., Peletier R. F., 1993, MNRAS, 262, 650
- Davis et al. (1985) Davis M., Efstathiou G., Frenk C. S., White S. D. M., 1985, ApJ, 292, 371
- De Lucia & Blaizot (2007) De Lucia G., Blaizot J., 2007, MNRAS, 375, 2
- De Lucia et al. (2006) De Lucia G., Springel V., White S. D. M., Croton D., Kauffmann G., 2006, MNRAS, 366, 499
- de Vaucouleurs (1961) de Vaucouleurs G., 1961, ApJS, 5, 233
- Di Matteo et al. (2009) Di Matteo P., Jog C. J., Lehnert M. D., Combes F., Semelin B., 2009, A&A, 501, L9
- Di Matteo et al. (2009) Di Matteo P., Pipino A., Lehnert M. D., Combes F., Semelin B., 2009, A&A, 499, 427
- D’Souza et al. (2014) D’Souza R., Kauffman G., Wang J., Vegetti S., 2014, MNRAS, 443, 1433
- Dubois et al. (2013) Dubois Y., Gavazzi R., Peirani S., Silk J., 2013, MNRAS, 433, 3297
- Eigenthaler & Zeilinger (2013) Eigenthaler P., Zeilinger W. W., 2013, A&A, 553, A99
- Emsellem (2011) Emsellem E. e. a., 2011, MNRAS, 414, 888
- Feldmann et al. (2011) Feldmann R., Carollo C. M., Mayer L., 2011, ApJ, 736, 88
- Feldmann et al. (2010) Feldmann R., Carollo C. M., Mayer L., Renzini A., Lake G., Quinn T., Stinson G. S., Yepes G., 2010, ApJ, 709, 218
- Ferreras et al. (2009) Ferreras I., Lisker T., Pasquali A., Kaviraj S., 2009, MNRAS, 395, 554
- Ferreras et al. (2014) Ferreras I., Trujillo I., Mármol-Queraltó E., Pérez-González P. G., Cava A., Barro G., Cenarro J., Hernán-Caballero A., Cardiel N., Rodríguez-Zaurín J., Cebrián M., 2014, MNRAS, 444, 906
- Foster et al. (2009) Foster C., Proctor R. N., Forbes D. A., Spolaor M., Hopkins P. F., Brodie J. P., 2009, MNRAS, 400, 2135
- Franx & Illingworth (1990) Franx M., Illingworth G., 1990, ApJ, 359, L41
- Franx et al. (2008) Franx M., van Dokkum P. G., Schreiber N. M. F., Wuyts S., Labbé I., Toft S., 2008, ApJ, 688, 770
- Fu et al. (2013) Fu J., Kauffmann G., Huang M.-l., Yates R. M., Moran S., Heckman T. M., Davé R., Guo Q., Henriques B. M. B., 2013, MNRAS, 434, 1531
- Gabor & Davé (2012) Gabor J. M., Davé R., 2012, MNRAS, 427, 1816
- Gallazzi et al. (2005) Gallazzi A., Charlot S., Brinchmann J., White S. D. M., Tremonti C. A., 2005, MNRAS, 362, 41
- Genel et al. (2008) Genel S., Genzel R., Bouché N., Sternberg A., Naab T., Schreiber N. M. F., Shapiro K. L., Tacconi L. J., Lutz D., Cresci G., Buschkamp P., Davies R. I., Hicks E. K. S., 2008, ApJ, 688, 789
- Gonzalez et al. (1993) Gonzalez J. J., Faber S. M., Worthey G., 1993, in American Astronomical Society Meeting Abstracts Vol. 25 of Bulletin of the American Astronomical Society, Age and Metallicity of Elliptical Galaxies. p. 1355
- González Delgado (2014) González Delgado R. M. e. a., 2014, A&A, 562, A47
- Greene et al. (2012) Greene J. E., Murphy J. D., Comerford J. M., Gebhardt K., Adams J. J., 2012, ApJ, 750, 32
- Greene et al. (2013) Greene J. E., Murphy J. D., Graves G. J., Gunn J. E., Raskutti S., Comerford J. M., Gebhardt K., 2013, ApJ, 776, 64
- Guo & White (2008a) Guo Q., White S. D. M., 2008a, MNRAS, 384, 2
- Guo & White (2008b) Guo Q., White S. D. M., 2008b, MNRAS, 384, 2
- Haardt & Madau (2001) Haardt F., Madau P., 2001, in Neumann D. M., Tran J. T. V., eds, Clusters of Galaxies and the High Redshift Universe Observed in X-rays Modelling the UV/X-ray cosmic background with CUBA
- Hilz et al. (2013) Hilz M., Naab T., Ostriker J. P., 2013, MNRAS, 429, 2924
- Hilz et al. (2012) Hilz M., Naab T., Ostriker J. P., Thomas J., Burkert A., Jesseit R., 2012, MNRAS, 425, 3119
- Hirschmann et al. (2010) Hirschmann M., Khochfar S., Burkert A., Naab T., Genel S., Somerville R. S., 2010, MNRAS, 407, 1016
- Hirschmann et al. (2013) Hirschmann M., Naab T., Davé R., Oppenheimer B. D., Ostriker J. P., Somerville R. S., Oser L., Genzel R., Tacconi L. J., Förster-Schreiber N. M., Burkert A., Genel S., 2013, MNRAS, 436, 2929
- Hirschmann et al. (2012) Hirschmann M., Naab T., Somerville R. S., Burkert A., Oser L., 2012, MNRAS, 419, 3200
- Hopkins et al. (2010) Hopkins P. F., Bundy K., Croton D., Hernquist L., Keres D., Khochfar S., Stewart K., Wetzel A., Younger J. D., 2010, ApJ, 715, 202
- Hopkins et al. (2009) Hopkins P. F., Bundy K., Murray N., Quataert E., Lauer T. R., Ma C.-P., 2009, MNRAS, 398, 898
- Jogee (2009) Jogee S. e. a., 2009, ApJ, 697, 1971
- Johansson et al. (2009) Johansson P. H., Naab T., Ostriker J. P., 2009, ApJ, 697, L38
- Johansson et al. (2012) Johansson P. H., Naab T., Ostriker J. P., 2012, ApJ, 754, 115
- Jones et al. (2013) Jones T., Ellis R. S., Richard J., Jullo E., 2013, ApJ, 765, 48
- Kauffmann (1996) Kauffmann G., 1996, MNRAS, 281, 487
- Kauffmann et al. (1996) Kauffmann G., Charlot S., White S. D. M., 1996, MNRAS, 283, L117
- Kawata & Gibson (2003) Kawata D., Gibson B. K., 2003, MNRAS, 346, 135
- Kewley et al. (2010) Kewley L. J., Rupke D., Zahid H. J., Geller M. J., Barton E. J., 2010, ApJ, 721, L48
- Khochfar & Silk (2006) Khochfar S., Silk J., 2006, ApJ, 648, L21
- Kobayashi (2004) Kobayashi C., 2004, MNRAS, 347, 740
- Kormendy et al. (2009) Kormendy J., Fisher D. B., Cornell M. E., Bender R., 2009, ApJS, 182, 216
- La Barbera & de Carvalho (2009) La Barbera F., de Carvalho R. R., 2009, ApJ, 699, L76
- La Barbera et al. (2005) La Barbera F., de Carvalho R. R., Gal R. R., Busarello G., Merluzzi P., Capaccioli M., Djorgovski S. G., 2005, ApJ, 626, L19
- La Barbera et al. (2012) La Barbera F., Ferreras I., de Carvalho R. R., Bruzual G., Charlot S., Pasquali A., Merlin E., 2012, MNRAS, 426, 2300
- Lackner et al. (2012a) Lackner C. N., Cen R., Ostriker J. P., Joung M. R., 2012a, MNRAS, 425, 641
- Lackner et al. (2012b) Lackner C. N., Cen R., Ostriker J. P., Joung M. R., 2012b, MNRAS, 425, 641
- Lackner & Ostriker (2010) Lackner C. N., Ostriker J. P., 2010, ApJ, 712, 88
- Laporte et al. (2013) Laporte C. F. P., White S. D. M., Naab T., Gao L., 2013, MNRAS, 435, 901
- Laporte et al. (2012) Laporte C. F. P., White S. D. M., Naab T., Ruszkowski M., Springel V., 2012, MNRAS, 424, 747
- Limongi & Chieffi (2005) Limongi M., Chieffi A., 2005, in Turatto M., Benetti S., Zampieri L., Shea W., eds, 1604-2004: Supernovae as Cosmological Lighthouses Vol. 342 of Astronomical Society of the Pacific Conference Series, Presupernova Evolution and Explosive Nucleosynthesis of Massive Stars at Various Metallicities from Z=0 to . p. 122
- Longhetti et al. (2007) Longhetti M., Saracco P., Severgnini P., Della Ceca R., Mannucci F., Bender R., Drory N., Feulner G., Hopp U., 2007, MNRAS, 374, 614
- Lotz (2008) Lotz J. M. e. a., 2008, ApJ, 672, 177
- MacArthur et al. (2004) MacArthur L. A., Courteau S., Bell E., Holtzman J. A., 2004, ApJS, 152, 175
- Makino & Hut (1997) Makino J., Hut P., 1997, ApJ, 481, 83
- Man et al. (2012) Man A. W. S., Toft S., Zirm A. W., Wuyts S., van der Wel A., 2012, ApJ, 744, 85
- Marinacci et al. (2013) Marinacci F., Pakmor R., Springel V., 2013, ArXiv e-prints
- Martin (2005) Martin C. L., 2005, ApJ, 621, 227
- Matteucci & Francois (1989) Matteucci F., Francois P., 1989, MNRAS, 239, 885
- Maulbetsch et al. (2007) Maulbetsch C., Avila-Reese V., Colín P., Gottlöber S., Khalatyan A., Steinmetz M., 2007, ApJ, 654, 53
- McClure & Racine (1969) McClure R. D., Racine R., 1969, AJ, 74, 1000
- McKee & Ostriker (1977) McKee C. F., Ostriker J. P., 1977, ApJ, 218, 148
- Mehlert et al. (2000) Mehlert D., Saglia R. P., Bender R., Wegner G., 2000, A&AS, 141, 449
- Mehlert et al. (2003) Mehlert D., Thomas D., Saglia R. P., Bender R., Wegner G., 2003, A&A, 407, 423
- Mihos et al. (2013) Mihos J. C., Harding P., Rudick C. S., Feldmeier J. J., 2013, ApJ, 764, L20
- Mollá & Díaz (2005) Mollá M., Díaz A. I., 2005, MNRAS, 358, 521
- Molla et al. (1997) Molla M., Ferrini F., Diaz A. I., 1997, ApJ, 475, 519
- Montes et al. (2014) Montes M., Trujillo I., Prieto M. A., Acosta-Pulido J. A., 2014, MNRAS, 439, 990
- Moster et al. (2013) Moster B. P., Naab T., White S. D. M., 2013, MNRAS, 428, 3121
- Moster et al. (2010) Moster B. P., Somerville R. S., Maulbetsch C., van den Bosch F. C., Macciò A. V., Naab T., Oser L., 2010, ApJ, 710, 903
- Murray et al. (2005) Murray N., Quataert E., Thompson T. A., 2005, ApJ, 618, 569
- Naab et al. (2009) Naab T., Johansson P. H., Ostriker J. P., 2009, ApJ, 699, L178
- Naab et al. (2007) Naab T., Johansson P. H., Ostriker J. P., Efstathiou G., 2007, ApJ, 658, 710
- Naab et al. (2006) Naab T., Khochfar S., Burkert A., 2006, ApJ, 636, L81
- Naab et al. (2013) Naab T., Oser L., Emsellem E., Cappellari M., Krajnovic D., McDermid R. M., Alatalo K., Bayet E., Blitz L., Bois M., 2013, ArXiv e-prints
- Naab & Ostriker (2006) Naab T., Ostriker J. P., 2006, MNRAS, 366, 899
- Naab (2014) Naab T. e. a., 2014, MNRAS, 444, 3357
- Navarro-González et al. (2013) Navarro-González J., Ricciardelli E., Quilis V., Vazdekis A., 2013, MNRAS, 436, 3507
- Newman et al. (2012) Newman A. B., Ellis R. S., Bundy K., Treu T., 2012, ApJ, 746, 162
- Nipoti et al. (2009) Nipoti C., Treu T., Bolton A. S., 2009, ApJ, 703, 1531
- Nipoti et al. (2012) Nipoti C., Treu T., Leauthaud A., Bundy K., Newman A. B., Auger M. W., 2012, MNRAS, 422, 1714
- Oogi & Habe (2013) Oogi T., Habe A., 2013, MNRAS, 428, 641
- Oppenheimer & Davé (2006) Oppenheimer B. D., Davé R., 2006, MNRAS, 373, 1265
- Oppenheimer & Davé (2008) Oppenheimer B. D., Davé R., 2008, MNRAS, 387, 577
- Oppenheimer et al. (2010) Oppenheimer B. D., Davé R., Kereš D., Fardal M., Katz N., Kollmeier J. A., Weinberg D. H., 2010, MNRAS, 406, 2325
- Oser et al. (2012) Oser L., Naab T., Ostriker J. P., Johansson P. H., 2012, ApJ, 744, 63
- Oser et al. (2010) Oser L., Ostriker J. P., Naab T., Johansson P. H., Burkert A., 2010, ApJ, 725, 2312
- Pasquali et al. (2010) Pasquali A., Gallazzi A., Fontanot F., van den Bosch F. C., De Lucia G., Mo H. J., Yang X., 2010, MNRAS, 407, 937
- Pastorello et al. (2014) Pastorello N., Forbes D. A., Foster C., Brodie J. P., Usher C., Romanowsky A. J., Strader J., Arnold J. A., 2014, ArXiv e-prints
- Patel et al. (2013) Patel S. G., van Dokkum P. G., Franx M., Quadri R. F., Muzzin A., Marchesini D., Williams R. J., Holden B. P., Stefanon M., 2013, ApJ, 766, 15
- Peletier et al. (1990) Peletier R., Davies R. L., Illingworth G., 1990, Structure and colour gradients in elliptical galaxies.. pp 267–269
- Pilkington et al. (2012) Pilkington K., Few C. G., Gibson B. K., Calura F., Michel-Dansac L., Thacker R. J., Mollá M., Matteucci F., Rahimi A., Kawata D., Kobayashi C., Brook C. B., Stinson G. S., Couchman H. M. P., Bailin J., Wadsley J., 2012, A&A, 540, A56
- Prantzos & Silk (1998) Prantzos N., Silk J., 1998, ApJ, 507, 229
- Queyrel et al. (2012) Queyrel J., Contini T., Kissler-Patig M., Epinat B., Amram P., Garilli B., Le Fèvre O., Moultaka J., Paioro L., Tasca L., Tresse L., Vergani D., López-Sanjuan C., Perez-Montero E., 2012, A&A, 539, A93
- Raskutti et al. (2014) Raskutti S., Greene J., Murphy J., 2014, ArXiv e-prints
- Rawle et al. (2010) Rawle T. D., Smith R. J., Lucey J. R., 2010, MNRAS, 401, 852
- Rix et al. (1999) Rix H.-W., Carollo C. M., Freeman K., 1999, ApJ, 513, L25
- Rupke et al. (2005) Rupke D. S., Veilleux S., Sanders D. B., 2005, ApJS, 160, 115
- Rupke et al. (2010) Rupke D. S. N., Kewley L. J., Barnes J. E., 2010, ApJ, 710, L156
- Sánchez-Blázquez et al. (2007) Sánchez-Blázquez P., Forbes D. A., Strader J., Brodie J., Proctor R., 2007, MNRAS, 377, 759
- Saracco et al. (2012) Saracco P., Gargiulo A., Longhetti M., 2012, MNRAS, 422, 3107
- Scannapieco & Bildsten (2005) Scannapieco E., Bildsten L., 2005, ApJ, 629, L85
- Serra (2014) Serra P. e. a., 2014, ArXiv e-prints
- Spergel et al. (2003) Spergel D. N., Verde L., Peiris H. V., Komatsu E., Nolta M. R., Bennett C. L., Halpern M., Hinshaw G., Jarosik N., Kogut A., Limon M., Meyer S. S., Page L., Tucker G. S., Weiland J. L., Wollack E., Wright E. L., 2003, ApJS, 148, 175
- Spitoni & Matteucci (2011) Spitoni E., Matteucci F., 2011, A&A, 531, A72
- Spolaor et al. (2010) Spolaor M., Kobayashi C., Forbes D. A., Couch W. J., Hau G. K. T., 2010, MNRAS, 408, 272
- Springel & Hernquist (2003) Springel V., Hernquist L., 2003, MNRAS, 339, 289
- Springel et al. (2005) Springel V., White S. D. M., Jenkins A., Frenk C. S., Yoshida N., Gao L., Navarro J., Thacker R., Croton D., Helly J., Peacock J. A., Cole S., Thomas P., Couchman H., Evrard A., Colberg J., Pearce F., 2005, Nature, 435, 629
- Springel et al. (2001) Springel V., Yoshida N., White S. D. M., 2001, New Astronomy, 6, 79
- Steinmetz & Mueller (1994) Steinmetz M., Mueller E., 1994, A&A, 281, L97
- Suh et al. (2010) Suh H., Jeong H., Oh K., Yi S. K., Ferreras I., Schawinski K., 2010, ApJS, 187, 374
- Sutherland & Dopita (1993) Sutherland R. S., Dopita M. A., 1993, ApJS, 88, 253
- Szomoru et al. (2012) Szomoru D., Franx M., van Dokkum P. G., 2012, ApJ, 749, 121
- Thomas et al. (2005) Thomas D., Maraston C., Bender R., Mendes de Oliveira C., 2005, ApJ, 621, 673
- Thomas et al. (2010) Thomas D., Maraston C., Schawinski K., Sarzi M., Silk J., 2010, MNRAS, 404, 1775
- Toft et al. (2007) Toft S., van Dokkum P., Franx M., Labbe I., Förster Schreiber N. M., Wuyts S., Webb T., Rudnick G., Zirm A., Kriek M., van der Werf P., Blakeslee J. P., Illingworth G., Rix H.-W., Papovich C., Moorwood A., 2007, ApJ, 671, 285
- Tortora et al. (2010) Tortora C., Napolitano N. R., Cardone V. F., Capaccioli M., Jetzer P., Molinaro R., 2010, MNRAS, 407, 144
- Tran et al. (2005) Tran K.-V. H., van Dokkum P., Franx M., Illingworth G. D., Kelson D. D., Schreiber N. M. F., 2005, ApJ, 627, L25
- Trujillo et al. (2006) Trujillo I., Förster Schreiber N. M., Rudnick G., Barden M., Franx M., Rix H.-W., Caldwell J. A. R., McIntosh D. H., Toft S., Häussler B., Zirm A., van Dokkum P. G., Labbé I., 2006, ApJ, 650, 18
- van de Sande et al. (2011) van de Sande J., Kriek M., Franx M., van Dokkum P. G., Bezanson R., Whitaker K. E., Brammer G., Labbé I., Groot P. J., Kaper L., 2011, ApJ, 736, L9
- van der Wel et al. (2005) van der Wel A., Franx M., van Dokkum P. G., Rix H.-W., Illingworth G. D., Rosati P., 2005, ApJ, 631, 145
- van der Wel et al. (2008) van der Wel A., Holden B. P., Zirm A. W., Franx M., Rettura A., Illingworth G. D., Ford H. C., 2008, ApJ, 688, 48
- van Dokkum (2005) van Dokkum P. G., 2005, AJ, 130, 2647
- van Dokkum et al. (2008) van Dokkum P. G., Franx M., Kriek M., Holden B., Illingworth G. D., Magee D., Bouwens R., Marchesini D., Quadri R., Rudnick G., Taylor E. N., Toft S., 2008, ApJ, 677, L5
- van Dokkum et al. (2010) van Dokkum P. G., Whitaker K. E., Brammer G., Franx M., Kriek M., Labbé I., Marchesini D., Quadri R., Bezanson R., Illingworth G. D., Muzzin A., Rudnick G., Tal T., Wake D., 2010, ApJ, 709, 1018
- van Zee et al. (1998) van Zee L., Salzer J. J., Haynes M. P., O’Donoghue A. A., Balonek T. J., 1998, AJ, 116, 2805
- Vazdekis et al. (2003) Vazdekis A., Cenarro A. J., Gorgas J., Cardiel N., Peletier R. F., 2003, MNRAS, 340, 1317
- Vila-Costas & Edmunds (1992) Vila-Costas M. B., Edmunds M. G., 1992, MNRAS, 259, 121
- Villumsen (1983) Villumsen J. V., 1983, MNRAS, 204, 219
- Weijmans et al. (2009) Weijmans A.-M., Cappellari M., Bacon R., de Zeeuw P. T., Emsellem E., Falcón-Barroso J., Kuntschner H., McDermid R. M., van den Bosch R. C. E., van de Ven G., 2009, MNRAS, 398, 561
- Weijmans (2014) Weijmans A.-M. e. a., 2014, MNRAS, 444, 3340
- White (1978) White S. D. M., 1978, MNRAS, 184, 185
- White (1979) White S. D. M., 1979, MNRAS, 189, 831
- White (1980) White S. D. M., 1980, MNRAS, 191, 1P
- White & Rees (1978) White S. D. M., Rees M. J., 1978, MNRAS, 183, 341
- Wu et al. (2005) Wu H., Shao Z., Mo H. J., Xia X., Deng Z., 2005, ApJ, 622, 244
- Wyse & Silk (1989) Wyse R. F. G., Silk J., 1989, ApJ, 339, 700
- Yang et al. (2013) Yang X., Mo H. J., van den Bosch F. C., Bonaca A., Li S., Lu Y., Lu Y., Lu Z., 2013, ArXiv e-prints
- Zaritsky et al. (1994) Zaritsky D., Kennicutt Jr. R. C., Huchra J. P., 1994, ApJ, 420, 87
- Zhang & Thompson (2012) Zhang D., Thompson T. A., 2012, MNRAS, 424, 1170