Slow relaxation behavior of cohesive powders
Abstract
We present findings from uniaxial (oedometric) compression tests on two cohesive industrially relevant granular materials (cocoa and limestone powder). Experimental results are presented for the compressibility, tested with two devices – the FT4 Powder Rheometer and the custom made lambdameter. We focus on the stress response and the slow relaxation behavior of the cohesive samples tested. After compression ends, at constant volume, the ongoing stress relaxation is found to follow a power law consistently for both cohesive powders and for the different testing equipments. A simple (incremental algebraic evolution) model is proposed for the stress relaxation in cohesive powders, which includes a response timescale along with a second, dimensionless relaxation parameter. The reported observations are useful for both the improvement of discrete element simulations and constitutive macroscopic models for cohesive granular materials.
keywords:
stress relaxation , cohesive powders , uniaxial compression , equipment comparsion , aspect ratio , relaxation theory1 Introduction and Background
Granular materials are omnipresent in nature and widely used in various industries ranging from food, pharmaceutical, agriculture and mining – among others. In many granular systems interesting phenomena like dilatancy, anisotropy, shear-band localization, history-dependence, jamming and yield have attracted significant scientific interest over the past decade Luding (2008); Imole et al. (2013b); Alonso-Marroquin and Herrmann (2004). The bulk behavior of these materials depends on the behavior of their constituents (particles) interacting through contact forces. To understand their deformation behavior, various laboratory element tests can be performed Schwedes (2003); MiDi (2004). Element tests are (ideally homogeneous) macroscopic tests in which one can control the stress and/or strain path. Such macroscopic experiments are important ingredients in developing and calibrating constitutive relations and they complement numerical investigations of the behavior of granular materials, e.g. with the discrete element method Luding (2008). Different element test experiments on packings of bulk solids have been realized experimentally in the biaxial box Morgeneyer et al. (2003); Röck et al. (2008); Morgeneyer and Schwedes (2003) while other deformations modes, namely uniaxial and volume conserving shear have also been reported Saadatfar et al. (2012); Yun and Evans (2011); Philippe et al. (2011). Additionally, element tests with more complex, non-commercial testers have been reported in literature Harder and Schwedes (1985); Janssen and Zetzener (2003); Head (1998); Bardet (1997), even though their applications are restricted for example to the testing of geophysically relevant materials at relatively higher consolidating stresses.
The testing and characterization of dry, non-sticky powders is well established. For example, rotating drum experiments to determine the dynamic angle of repose have been studied extensively as a means to characterize non-cohesive powders Ristow (1996); Baumann et al. (1996); Cantelaube and Bideau (1995), even though these tests are not well defined with respect to the powder stress and strain conditions. The main challenge comes when the powders are sticky, cohesive and less flowable like those relevant in the food industry. For these powders, dynamic tests are difficult to perform due to contact adhesion and clump formation. One possibility to overcome this challenge is to perform confined quasi-static tests at higher consolidation stresses.
One element test which can easily be realized (experimentally and numerically) is the uniaxial (or oedometric) compression (in a cylindrical or box geometry) involving deformation of a bulk sample in one direction, while the lateral boundaries of the system are fixed. This test is particularly suited for determining the poroelastic properties of granular materials Imole et al. (2013a, b, 2014); Bandi et al. (2013).While most uniaxial tests on dry bulk solids have been devoted to studying the relationship between pressure and density and the bulk long time consolidation behavior, the dynamics of the time-dependent phenomena has been less studied in experimental and practical applications Zetzener and Schwedes (2002). For example, in standard shear testers like the Jenike shear tester Kamath et al. (1994) and the Schulze ring shear tester Schulze (2003), during yield stress measurements, the focus is usually not on the relaxation behavior. Considerable stress-relaxation of bulk materials can even disturb yield stress measurements. Additionally, most cohesive contact models Luding (2008); Tomas (2000); Tykhoniuk et al. (2007); Walton (1995) used in discrete element simulation of granular materials do not account for the time dependent relaxation behavior, similar to those observed in viscoelastic materials such as polymers Gloeckle and Nonnenmacher (1991); Metzler (2003); Friedrich (1991), gels Winter and Chambon (1986); Chambon et al. (1986), in dielectric relaxation Jonscher (1999, 1977) and in the attenuation of seismic waves Kjartansson (1979). For the improvement of both discrete element contact models and constitutive macro models relating to cohesive powders, it is necessary to have an experimental and theoretical understanding of the stress response of cohesive materials under different loading conditions.
For viscoelastic materials, the relaxation has been reported to imply a memory effect and can be described using convolution integrals transformed to their fractional form and containing a relaxation modulus that describes the response of the system to stress Schiessel et al. (1995). For these materials, phenomenological models involving the combination of springs and dashpots, such as the Maxwell, Zener, anti-Zener, Kelvin-Voigt, and the Poynting-Thomson models have been developed (see Refs. Kruijer et al. (2006); Bagley and Torvik (1986); Atanackovic (2002); Mainardi (2010) and references therein). Even though stress relaxation has also been observed in granular media Zetzener and Schwedes (2002); Schulze (2003); Bandi et al. (2013), not much work has been done in providing a theoretical description of this phenomenon for granular materials.
In the present study, using two simple testers, we perform oedometric compression tests with the main goal of investigating the relaxation behavior of industrial powders at different stress levels under constant strain (volume). Another goal is to provide a quantitative comparison between the relaxation behavior as observed in two testers, namely the lambdameter Kwade et al. (1994b, c, a) and the FT4 Powder Rheometer Freeman (2007), in order to confirm that this behavior occurs irrespective of the device used. The lambdameter has the peculiar advantage that both vertical and horizontal stress can be obtained simultaneously – unlike the FT4 Powder Rheometer and other simpler oedometric test setups. Finally, we will propose a simple model for stress relaxation that captures the relaxation of cohesive powders at different compaction levels.
The work is structured as follows: In section 2, we provide a characterization of the material sample, and in section 3 the description of the experimental devices and the test protocols. In section 4, we present the theoretical model for stress relaxation. Section 5 is devoted to the discussion of experimental and theoretical results, while the conclusions and outlook are presented in section 6.
2 Sample Description and Material Characterization
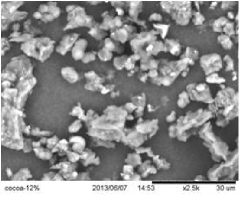
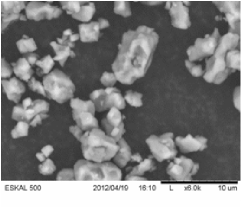
In this section, we provide a brief description of the experimental samples along with their material properties. In order to investigate the relaxation behavior, two cohesive reference samples were chosen, namely cocoa powder and Eskal 500 limestone. The choice is based on several selection factors, among which are the suitability for different industrial applications, ability to withstand repeated loading without changes in the property of the sample and long term availability/storage of the samples. The Eskal limestone has been used extensively as reference cohesive powder, and is made available in convenient amounts in a collaborative European project, c.f. www.pardem.eu Thakur et al. (2013). Scanning Electron Microscope (SEM) images obtained using a Hitachi TM 1000 Instrument (Hitachi Ltd, Japan) for both powders are displayed in Fig. 1.
The particle size distributions are measured using the Helos testing instrument (Sympatec GmbH, Germany). While limestone powder is dispersed with air pressure, we use the wet mode to disperse cocoa powder since it forms agglomerates. For the wet mode, cocoa powder is dispersed in dodecane, an oily liquid, in order to retain the fat layer while ultrasound (vibration) is applied to stress the dispersion and break off the agglomerates. The particle density is measured by helium pycnometry (Accupyc, Micromeritics, USA) while the water content is given as the ratio of the difference between the original and dried mass (after 24 hours in a oven at 100∘C) and the original sample mass. The bulk cohesion is the limiting value of shear stress for which the normal stress is equal to zero and is determined from shear experiments with a Schulze ring shear tester (RST-01.pc by Dietmar Schulze Schüttgutmesstechnik, Germany). A more specific description of the experimental samples is provided in the following section.
2.1 Cocoa Powder
One cohesive sample used in this work is cocoa powder with 12% fat content - which is a representative sample for the material used as basic ingredient in the production of chocolate and related beverages. The material properties including size distribution, particle density and water content are shown in Table 1 along with a scanning electron microscope visualization of its morphology in Fig. 1. We note that even though the powder is relatively hygroscopic, its humidity does not change significantly during the experiments. Additionally, the experiments are performed over a relatively short period under ambient conditions and samples are sealed in air-tight bags when not in use to minimize effects that could arise due to changes in the product humidity.
| Property | Unit | Cocoa (12%) | Eskal 500 limestone | |
| Size distribution | m | 2.14 | 1.34 | |
| m | 9.01 | 4.37 | ||
| m | 37.40 | 8.24 | ||
| Particle density | [kg/m3] | 1509 | 2710 | |
| Water content | 1.5% | 0.2% | ||
| Bulk cohesion (as function | 1.8 at 7.4 kPa | 1.3 at 4.6 kPa | ||
| of major principal stress) | 9.6 at 41.8 kPa | 3.3 at 12.7 kPa |
2.2 Eskal 500 Limestone
The other industrial powder sample used in this work is Eskal 500 limestone powder (KSL Staubtechnik, Germany). Eskal 500 limestone is a commercially available powder that has wide applications in architecture, road construction, blast furnaces, medicines and cosmetics. It is also considered a suitable reference material for calibration and standard testing Feise (1998); Kwade et al. (1994a); Zetzener and Schwedes (2002). One advantage of this material over other grades is its inability to absorb humidity from air. During long term storage under stress, Eskal 500 limestone shows no degradation as confirmed by repeatable results from experiments carried out under different conditions. The material properties and SEM morphology are shown in Table 1 and Fig. 1.
Comparing the physical features of the powders, cocoa powder is brownish while Eskal is whitish in color. Secondly, while cocoa powder contains some 12% fat, Eskal 500 limestone does not. This distinction is important for a comparison of their relaxation behavior.
3 Experimental Setup
In this section, we describe the lambdameter and FT4 Powder Rheometer along with the protocols used in performing the tests.
3.1 FT4 Powder Rheometer
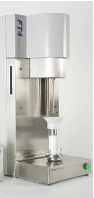
The first experimental equipment used in this work is the FT4 Powder Rheometer (Freeman technology Ltd. UK), illustrated in Fig. 2. Standard accessories for the compressibility test include the 50 mm diameter blade for conditioning, the vented piston for compression and the 50 mm height by 50 mm diameter borosilicate test vessel. One advantage of the commercial FT4 Powder Rheometer is the automated nature of the test procedure requiring minimal operator intervention.
The compression test sequence is as follows: The sample is placed in the test vessel after the tare weight of the vessel has been obtained. The weight of the powder is measured and the conditioning cycle is initiated. The conditioning procedure involves the gentle movement of the conditioning blade into the test sample to gently disturb the powder bed for a user pre-defined number of cycles. This action creates a uniform, lightly packed test sample that can be readily reproduced. In this study, we allow three pre-conditioning cycles before the uniaxial compression tests are carried out. Subsequently, the blade is replaced with a vented piston, which incorporates a stainless steel mesh to allow the entrained air in the powder to escape uniformly across the surface of the powder bed. The vessel assembly is split (or leveled) to provide precise volume measurement and the powder mass is recalculated after splitting. The compression test then begins with the distance travelled by the piston measured for each applied normal stress.
| Property | FT4 Rheometer | Lambdameter |
|---|---|---|
| Cell volume | 8.5 m3 | 1.39 m3 |
| Cell shape | cylindrical | cylindrical |
| Wall material | borosilicate glass | aluminium alloy |
| Diameter (D) | 0.05 m | 0.149 m |
| Height (H) | 0.02 m, 0.05 m | 0.08 m |
| Aspect ratio | ||
| Driving mode | motor control | motor control |
| Test control | built in test program on PC | Labview |
| Sample weighing | on-board | offline |
| Compression device | vented piston | top plate |
| Driving velocity | variable | variable |
| Maximum stress | 22 kPa | 69.96 kPa |
| Sample pre-conditioning | automatic | manual |
| Test duration | variable | variable |
| Stress measurement | vertical stress | horizontal and |
| (direction) | vertical stress |
3.2 The Lambdameter
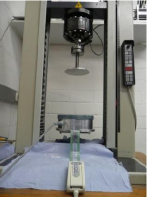
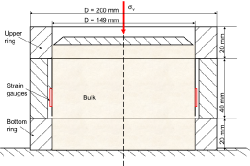
The custom made lambdameter represents a horizontal slice of a silo and is primarily used in obtaining the lateral stress ratio Kwade et al. (1994b, c, a) – one of the most important parameters in the calculation of stress distributions in silos for reliable design Schwedes (1968, 2003). The lambdameter used was designed at the Institute for Particle Technology (iPAT), Technische Universität Braunschweig, and is shown schematically in Fig. 2 and 2. The lambdameter measures the vertical (axial) and horizontal (radial) stress of a powder under compaction. The horizontal stress is measured through the installation of pressure cells along the periphery of the cylindrical mould. The measuring ring of the lambdameter is made from aluminium alloy with a very smooth surface and the dimensions are listed in Table 2. To allow for the automation of the compression test, similar to that of the FT4, the lambdameter setup is installed into a Zwick Z010 (Zwick/Roell, Zwick GmbH & Co. KG, Germany) uniaxial testing device as shown in Fig. 2.
The experimental procedure is as follows. The experimental sample is first sieved to prevent formation of agglomerates and a spoon is used to fill the sample evenly into the cylindrical mould until it is completely full. Using a smooth object, excess material is removed without allowing for a compaction of the sample in the mould. Next, the top plate lowers according to a prescribed velocity and the force-displacement measurement is initiated once a contact force is detected. The horizontal and vertical stresses along with the position of the top punch at a given time are recorded with a data logger on a computer connected to the experimental setup.
A detailed comparison between the main features of both testers is shown in Table 2. We only note that the FT4 is more automated and requires less human intervention compared to the lambdameter. On the other hand, in contrast to the FT4 Powder Rheometer, higher volumetric strains and axial stresses can be reached with the lambdameter. Additionally, the lambdameter also provides for the measurement of the horizontal (lateral) stress.
3.3 Test Protocols
In order to investigate the relaxation behavior of the different experimental samples under uniaxial loading, different staged test protocols are employed, see Table 3. The uniaxial loading is done in steps of 5 kPa with intermediate relaxation between each step. The maximum stress reached for experiments with the FT4 Powder Rheometer is 22 kPa while for the lambdameter, a higher maximum stress of 25 kPa is reached. We performed more extensive experiments with the lambdameter setup due to its versatility in terms of the maximum stress reached and the horizontal stress measurement. We compare in some cases the stress-relaxation behavior under uniaxial loading for both equipments. Using protocol 1 with Eskal 500 limestone as sample, three tests were performed to investigate the reproducibility of the FT4 and two tests for the lambdameter measurements. The results were found to be reproducible up to 3–5 percent in the FT4 while the reproducibility was 6 percent in the lambdameter.
| Protocols | Velocity | No. of | Vertical | Relaxation | FT4 | Lambda- |
| [mm/s] | steps | stress [kPa] | time [mins] | meter | ||
| Protocol 1 | 0.05 | 5 | 5 - 10 - 15 - 20 - 22/25 | 5 | x | x |
| Protocol 2 | 0.05 | 5 | 5 - 10 - 15 - 20 - 25 | 10 | x | |
| Protocol 3 | 0.05 | 5 | 5 - 10 - 15 - 20 - 25 | 20 | x | |
| Protocol 4 | 0.05 | 5 | 5 - 10 - 15 - 20 - 25 | 30 | x | |
| Protocol 5 | 0.01 | 5 | 5 - 10 - 15 - 20 - 22/25 | 10 | x | x |
| Protocol 6 | 0.3 | 5 | 5 - 10 - 15 - 20 - 25 | 10 | x | |
| Protocol 7 | 0.7 | 5 | 5 - 10 - 15 - 20 - 25 | 10 | x | |
| Protocol 8 | 1.0 | 5 | 5 - 10 - 15 - 20 - 25 | 10 | x | |
| Protocol 9 | 1.3 | 5 | 5 - 10 - 15 - 20 - 25 | 10 | x |
In general, we study the effects of strain rate, relaxation time duration and the stress at which the relaxation is initiated along the loading path. We measure the vertical stress as function of the volumetric strain i.e. vertical strain since we are in an oedometric setup.
4 Stress Relaxation Theory
Assuming a vertical stress , which acts on the top plate under uniaxial loading, the change of stress with time, i.e. the stress-rate should be higher for stronger applied stress due to a micro- or nano-scopic change of the contact structure. The model evolution relation is:
| (1) |
where is a dimensionless proportionality constant and is a typical response time. The time in the denominator on the right hand side accounts for the fact that the change of stress decays with time extremely slowly. In order to visualize the model, consider that for organic materials like coffee and cocoa, the initial grains contain liquid and solid ingredients. Due to strong stresses, the liquid is squeezed out of the solid matrix – locally at contacts that experience strong forces. The terminal state would be a state where all liquid content has been squeezed out, however, since pores exist on many scales, this can take extremely long, i.e. much longer than the experiments which were performed here. The stress-rate is also proportional to the stress itself, since at zero stress, there is no reason to assume further stress changes.
The constant determines the magnitude of the stress-rate and contains information about the microscopic constitution and composition of the material. Hard materials with low liquid content are described by large values, whereas soft materials with high liquid content correspond to small values.
Assuming that the stress is raised from zero to a value instantaneously the response of the system is then given by the solution of the above equation with initial stress and starting from time =0, so that:
| (2) |
which can be further simplified to:
| (3) |
Note that the model can also be formulated in terms of the force rate Verzijden (2005). In the next section, the simple model presented above will be compared to experimental data and the response time and the parameter will be analyzed.
5 Results and Discussion
In this section, as results of the current study, we will first compare the uniaxial compression and relaxation experiments carried out with the FT4 Powder Rheometer for different aspect ratios. To complement these results, we also discuss the dependence on sample material characteristics. Finally, we investigate the effects of strain-rate, loading steps and relaxation time on the decay of the stress at constant strain.
5.1 Dependence on Aspect Ratio
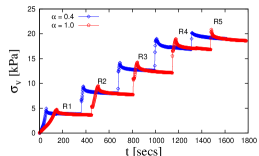
In order to investigate the role that different vessel aspect ratios play in the stress-strain evolution, using the FT4, we perform uniaxial compression tests on cocoa powder with a carriage speed of 0.05 mm/s (protocol 1 in Table 3). Two aspect ratios () are considered namely, 0.4 and 1.0. For these tests, the vessel diameter 0.05 m is fixed while the filling height of the vessel is changed from 0.05 m to 0.02 m to achieve the target aspect ratios. Additionally, five intermediate relaxation stages (R1–R5), in which the top piston/punch is held in position for 300 seconds at specific intervals of 5 kPa are included during the compression test.
In Fig. 3, we plot the vertical stress as function of time. During loading, the axial stress builds up with time until the first target stress of 5 kPa (at R1) is reached. We observe a slower increase of the axial stress with time for the higher aspect ratio even though the respective pistons were moved with the same speed. Consequently, the vertical compaction and thus strain at constant vertical stress is higher in the setup with 1.0 than in the setup with 0.4. This is possibly due to the difference in sample masses for both equipments, leading to different initial densities of the same sample, and consequently producing different response to compressive stress. Other possible reasons will be discussed below.
With the initiation of the first relaxation R1 at 5 kPa, we observe for both aspect ratios a time-dependent stress relaxation during the rest-time of 300 seconds. This observation has been reported in literature for other test setups and granular materials Schulze (2003); Zetzener and Schwedes (2002), confirming that the stress relaxation is not due to a drift in the measuring equipments but it is a material feature happening at their contacts. Other reasons for the relaxation of the powder under stress are the escape of air trapped inside the bulk pores during (fast) compression and a successive relocation of particles resulting in the “softening” of the vertical stresses.
The activation of axial compression after relaxation leads to a sharp increase in the axial stress until the next intermediate stress state is reached. This sudden jump is similar to that observed in stick/slip Schulze (2003); Shinbrot et al. (2012) experiments and friction between solid bodies Dieterich and Kilgore (1994) where a sudden increase in shear velocity results in a sharp increase in shear stress. The same features are reproduced for higher stress states.
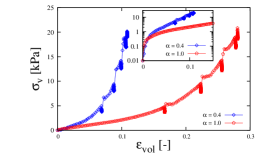
An objective comparison of the stress-strain evolution in both testing equipments is presented in Fig. 3, where the vertical stress is plotted against volumetric strain. The volumetric strain is defined here as where and are the actual and initial piston positions, respectively.
At the initial stage, the response to applied stress for both aspect ratios is almost identical. Shortly afterwards, the dependence on aspect ratio kicks in and the setup with the higher aspect ratio ( 1.0) produces a softer response to the applied stress in comparison to 0.4. During the relaxation phase, the decrease in stress occurs at constant strain as shown by the vertical drops along the deformation path for both aspect ratios.
The softer response observed for the higher aspect ratio can also be explained by the difference in sample height which, according to Janssen Janssen (1895), causes weaker stress far away from the piston for 1.0. It follows that the stress-strain evolution in the two different setups is influenced by the difference in aspect ratio, where increasing the sample height leads to slower and softer stress-strain response.
Relaxation Steps
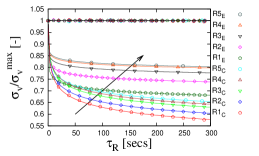
Next, we turn our attention to the relaxation stages and extract from Fig. 3 the data for the steps R1–R5 plotted in Fig. 4. For clarity, R1 is termed the first relaxation occurring at 5 kPa while R5 is the final relaxation at 21 kPa. The vertical stresses have been normalized by their initial values before relaxation while is the relaxation time which in this case is limited to 300 secs.
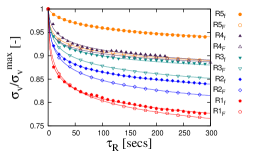
In general, we consistently observe stronger relaxation amplitudes for earlier, lower stress relaxations and considerably stronger relaxation in the test with the higher aspect ratio (open symbol). The stress relaxation law proposed in Eq. (3) describes well the relaxation for all aspect ratios at all stress states after the stress in each state has been normalized by its maximum value such that has a maximum value of 1. The maximum intermediate stress reached after 300 s and the other parameters are displayed in Table 4.
| Step | 1.0 | 0.4 | ||||
|---|---|---|---|---|---|---|
| R1 | 4.75 | 0.556 | 0.0444 | 4.75 | 0.2746 | 0.0453 |
| R2 | 9.5 | 1.0308 | 0.0341 | 9.51 | 0.8209 | 0.0321 |
| R3 | 14.25 | 1.0227 | 0.0212 | 14.26 | 0.5309 | 0.0201 |
| R4 | 19.01 | 0.3614 | 0.0178 | 19.01 | 1.6542 | 0.0180 |
| R5 | 20.9 | 0.5809 | 0.0187 | 20.93 | 12.4611 | 0.0189 |
| error [%] | – | 0–5 | 0–1 | – | 0–1 | 0–0.5 |
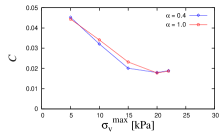
Comparing the parameters of the model, we observe that the response time fluctuates, especially for the lower aspect ratio, with no clear trend for increasing stress from R1–R5. On the other hand, the parameter displayed in Table 4 and plotted in Fig. 4 shows a consistently decreasing trend and the values are close for both aspect ratios. This suggests that is a material parameter that is not influenced by the aspect ratio of the experimental setup used, but by the stress and thus also by the history of the sample.
5.2 Dependence on Material Characteristics
As a second step, in order to compare the response of different cohesive powders, we introduce the second powder (Eskal 500) and repeat the same protocol as described in section 7. For the sake of brevity, the comparison is done using only the lambdameter setup.
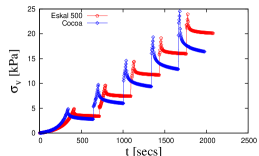
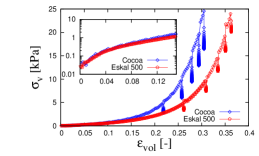
In Fig. 5, we show the time evolution of stress during compression for cocoa powder and Eskal 500 limestone. Both powders show qualitatively identical relaxation behavior under applied stress. Comparing the stress-strain response for both materials, as presented in Fig. 5, we observe a similar response for both materials within the small strain region ( 0.15). However, at larger strains the response diverges and limestone responds softer to strain, evidenced by the slower increase in vertical stress. Secondly, we confirm that the stress relaxation at R1–R5 occurs at constant strain as shown by the vertical drops along the deformation path. For the same intermediate stress, the onset of relaxation occurs at a higher strain in limestone as in cocoa. We explain this differences by the finer particle size of limestone resulting in much more contact points, higher van der Waals forces between the particles, and higher air entrapment.
In Fig. 6, we extract the relaxation phases of the experiments shown in Fig. 5 Eskal (E) and cocoa (C) and plot them against the relaxation time. We observe that at the same stress and using the same driving velocity, cocoa powder relaxes more and much faster than the Eskal limestone. For example, the relaxation under the lowest compressive stress (R1) shows a 33 percent decrease in stress for Eskal compared to a 43 percent decrease for cocoa. This is possibly arising from the fat content present in the cocoa powder.
| Step | ||||||
|---|---|---|---|---|---|---|
| R1 | 4.8964 | 0.28945 | 0.0792 | 5.0027 | 0.00082 | 0.0300 |
| R2 | 9.9684 | 0.2274 | 0.0702 | 10.0246 | 0.00046 | 0.0227 |
| R3 | 14.9130 | 0.2503 | 0.0652 | 15.0648 | 0.00032 | 0.0184 |
| R4 | 20.0375 | 0.2207 | 0.0612 | 20.0004 | 0.00021 | 0.0160 |
| R5 | 25.0718 | 0.1422 | 0.0556 | 25.0253 | 0.00032 | 0.0159 |
| error[%] | – | 0–3 | 0–0.4 | – | 3–7 | 0–1.3 |
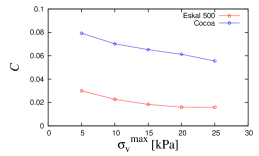
The fit parameters of Eq. (3) are shown in Table 5 for the five relaxation data depicted for each powder in Fig. 6, limestone and cocoa. The response time and dimensionless parameter for each powder generally show a decreasing trend with the maximum stress at which the relaxation is initiated. The decreasing trend of both parameters and is confirmed also for Eskal 500, however, the time-scale is orders of magnitude smaller while is of the same order only about a factor of two smaller, as summarized in table 5 and plotted in Fig. 6.
In summary, we conclude that even though both Eskal and cocoa powder show qualitatively similar relaxation at constant strain, their individual magnitudes and responses are quantitatively dissimilar at different intermediate stress.
5.3 Dependence on Relaxation Duration
In order to compare the changes in the vertical stress drop due to the relaxation duration, using the lambdameter, we perform several experiments in which the relaxation time is varied between 5 minutes and 30 minutes (protocols 1–4 in Table 3). Afterwards, for each achieved stress state, only the first five minutes of relaxation are chosen for comparison. This is because major changes in the stress state occur during this time interval. Furthermore, this allows us to consider the effect of previous history where the powders with larger , previously could relax longer.
In Fig. 7, we plot the relative stress reduction, as function of the maximum intermediate stresses for different previous relaxation times . The relaxation time at the lowest stress of 5 kPa has no effect on the stress reached, as evidenced by the collapse of the data at , since there is no effect yet of the loading history (different ); this rather confirms the repeatability of our measurements.
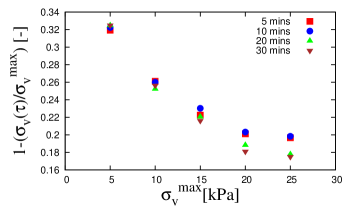
For subsequent relaxations at higher stresses (10, 15, 20 and 25 kPa), the difference due to the longer previous waiting times becomes visible. Consistently, at all stresses, an increase in relaxation time results in a lower relative stress reduction. The effects of previously experienced longer relaxation kick in at higher stresses, i.e., longer previous loading reduces the possible relaxation in the present state.
In summary, the effect of the relaxation duration becomes visible after the first intermediate stress, when history effects from preceding relaxation stages manifest. At 20 and 25 kPa, the difference between the 20 and 30 mins at the highest stress is small suggesting a saturation effect, however, this requires further studies that go beyond the scope of this paper.
5.4 Dependence on Loading Rate
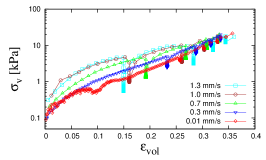
In order to investigate the effect of loading rates on the compression and stress relaxation evolution, we use the lambdameter and the limestone sample to vary the loading/compression rates. For these experiments, loading rates between 0.01 mm/s and 1.3 mm/s (protocols 5–9 in Table 3) were studied while the relaxation time was set to 10 minutes. In Fig. 8, the vertical stress is plotted as function of strain for different loading rates on a semi-logarithmic axis. To allow for clarity, we show only points at intervals of 20 Hz. For small strain ( 0.05), we observe a higher stress for increasing loading rate. The strains needed to reach the first stress level kPa increase with decreasing rate. However, all loading rates approach the same strain at the highest stress. This suggests that once the relaxation process is fully underway, and the air entrapped in the pores of the particles is released, they approach identical state regardless of the loading rate employed.
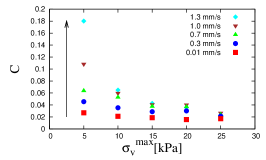
Next, using Eq. (3), we fit the different relaxation steps for the different loading rates and present the parameters in Table 6. The parameter fluctuates and is especially very small in magnitude. The values of the dimensionless parameter for different loading rates and different stress levels, listed in Table 6, are plotted in Fig. 8. For all loading rates, decreases with increasing stress – consistent with the findings discussed in sections 7 and 5.2. At a given stress level, is found to increase with increasing loading rate as indicated by the arrow. The increase in with increasing loading rate can be attributed to faster compression which allows for insufficient relaxation before the next compression stage is initiated. However, the relative increase in with increasing loading rate is found to decrease with increasing stress. At the highest stress (25 kPa), all values almost collapse on each other indicating an almost identical final relaxed state.
| Rate | Step | [kPa] | [ms] | |
|---|---|---|---|---|
| 0.01 mm/s | R1 | 4.9960 | 0.0187 | 0.0267 |
| R2 | 10.0173 | 0.0160 | 0.0209 | |
| R3 | 14.9447 | 0.0285 | 0.0187 | |
| R4 | 19.5277 | 0.0575 | 0.0155 | |
| R5 | 24.9835 | 0.0458 | 0.0170 | |
| 0.3 mm/s | R1 | 4.4068 | 0.0016 | 0.0455 |
| R2 | 10.001 | 0.00027 | 0.0352 | |
| R3 | 15.0434 | 0.00029 | 0.0287 | |
| R4 | 19.9958 | 0.0042 | 0.0300 | |
| R5 | 22.5748 | 0.00356 | 0.0213 | |
| 0.7 mm/s | R1 | 5.01431 | 0.00002 | 0.0636 |
| R2 | 9.97202 | 0.00041 | 0.0528 | |
| R3 | 15.0037 | 0.00043 | 0.0376 | |
| R4 | 20.0097 | 0.00163 | 0.0368 | |
| R5 | 24.5369 | 0.00013 | 0.0239 | |
| 1.0 mm/s | R1 | 5.01512 | 0.00093 | 0.1082 |
| R2 | 10.0058 | 0.000079 | 0.0596 | |
| R3 | 14.9226 | 0.00023 | 0.0407 | |
| R4 | 20.0208 | 0.0015 | 0.0402 | |
| R5 | 24.1282 | 0.00057 | 0.0263 | |
| 1.3 mm/s | R1 | 4.65097 | 0.0025 | 0.1801 |
| R2 | 10.10107 | 0.00083 | 0.0648 | |
| R3 | 15.02 | 0.00027 | 0.0425 | |
| R4 | 18.7748 | 0.0020 | 0.0359 | |
| R5 | 24.2288 | 0.00077 | 0.0225 |
In summary, we find that faster loading rates lead to insufficient time for relaxation with differences most visible at lower stress levels. The effect of loading rate diminishes at higher stress levels.
6 Conclusion and Outlook
We have performed oedometric experiments to study the slow relaxation of two cohesive powders under different consolidation stresses. One goal was to study the slow relaxation behavior in two experimental devices, namely the custom-built lambdameter and the commercially available FT4 Powder Rheometer. Additionally, a comparison of the relaxation behavior of two industrially relevant cohesive powders, namely cocoa powder with 12% fat content and Eskal 500 limestone powder, was carried out.
The relaxation behavior i.e., the decrease in stress occurring at constant volume, is qualitatively reproduced in the two testing equipments. On the dependence on aspect ratio, larger strain is required in the setup with higher aspect ratio ( 1.0) to reach the same intermediate stress in comparison to the setup with lower aspect ratio ( 0.4). The relaxation model, cf. Eq. (3), captures perfectly the decrease in stress during relaxation at different stress levels for both aspect ratios with the response time fluctuating and the dimensionless material parameter identical for both aspect ratios and systematically decreases from low to high stress levels.
For the two cohesive powders studied, it is interesting that both materials show an identical response to axial loading until 15 percent strain where the difference in the response begins to manifest. Eskal 500 limestone is found to produce a softer response to applied vertical stress in comparison to cocoa powder, which is probably due to the difference in particle size. At the same stress level, cocoa powder is found to relax more slowly but with a larger relative amplitude than Eskal. In terms of the parameters of the model, the response timescale for Eskal, , is several orders of magnitude smaller than that of cocoa. On the other hand, the dimensionless parameter shows a decreasing trend for both materials and is only about a factor two higher for cocoa than for limestone.
In terms of the relaxation duration, we find that longer previous relaxation leads to observable differences in relative stress reduction , reducing the present relaxation. Faster loading rates allow for insufficient time for relaxation with differences in the dimensionless parameter most visible for relaxation at low stresses. The effects of loading rate are attenuated as stress is increased.
Further studies will focus on the comparison between the two testing devices for identical aspect ratios and the solution of the model for finite compression rate. The effects of system walls of the experimental devices also needs to be given further attention. The validity of the proposed model for relaxation at constant stress (or strain creep) will be investigated. Finally, the incorporation of the features of the present findings into discrete element contact models for cohesive powders will be explored.
7 Appendix A: Testing Equipments - A Comparison
A comparison of testers is necessary for several reasons. Apart from the fact that several literatures have reported on comparative studies between different testers used in the characterization of cohesive powders Janssen and Zetzener (2003); Kamath et al. (1994); Thakur et al. (2013), most differences observed have been attributable to human errors, differences in the filling procedure and the measurement conditions. For our experiments, it is important to confirm that the relaxation feature can be reproduced in different testers and is not due to drift or bias in our testing equipments. The material used for this comparison is cocoa powder.
In order to compare the response of the two testing equipments to vertical (axial) stress, we perform uniaxial compression test on cocoa powder with a carriage speed of 0.05mm/s (protocol 1 in Table 3). Five intermediate relaxation stages (R1–R5)111Due to the difference in the final stress reached at R5 in the FT4 (22 kPa) and lambdameter (25 kPa), the final relaxation R5 for both equipments should be compared with caution., in which the top piston/punch is held in position for 300 seconds at specific intervals of 5 kPa during the compression tests are included. In Fig. 9 we plot the vertical stress as function of time. During loading, the axial stress builds up with time until the first target stress of 5 kPa (at R1) is reached. We observe a slower increase of the axial stress in the lambdameter in comparison to the FT4 Powder Rheometer even though the respective pistons were moved with the same speed. Consequently, the vertical compaction and thus strain at constant vertical stress is higher in the lambdameter than in the FT4 Powder Rheometer. This is possibly due to the difference in aspect ratio of the experimental moulds and filling procedures (e.g. conditioning of the sample by a rotating blade in case of the FT4 Powder Rheometer) resulting in different masses for both equipments, leading to different initial densities of the same sample, and consequently producing different response to compressive stress.
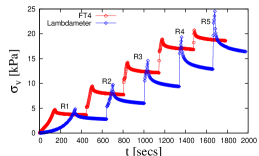
With the initiation of the first relaxation R1 at 5 kPa, we observe for both equipments a time-dependent stress relaxation during the rest-time of 300 seconds. Moreover, according to the equation of Janssen Janssen (1895), due to the larger diameter of the lambdameter, the stress away from the powder surface is larger, resulting in higher mean vertical stresses. This observation, along with other observations reported in literature for other granular materials Schulze (2003); Zetzener and Schwedes (2002), confirms that the stress relaxation is not due to a drift in the measuring equipments but it is a material feature as discussed in section 5.1. From 5 kPa, we observe an approximate 45 percent relative decrease in stress for the lambdameter compared to 22 percent in the FT4 Powder Rheometer. Due to the non-porous lid and the larger diameter of the lambdameter, at similar height, the escape of the air trapped and compressed in the powder takes more time. With the activation of axial compression after the relaxation, we observe a sharp increase in the axial stress until the next intermediate stress state is reached.
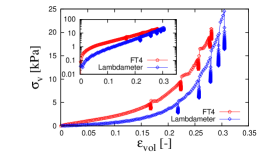
The evolution of stress and strain in both testing equipments is shown in Fig. 9, where the vertical stress is plotted against volumetric strain. We observe that the lambdameter initially produces a softer response to the applied stress, as evidenced by the slower increase in the vertical stress during loading. At higher intermediate strain, similar stress increase with strain is observed in the lambdameter as compared to the FT4 Powder Rheometer. The comparison of the response of both testing equipments for identical aspect ratio is a subject for future work and will be presented elsewhere.
Acknowledgement
Helpful discussions with N. Kumar and M. Wojtkowski are gratefully appreciated. This work is financially supported by the European Union funded Marie Curie Initial Training Network, FP7 (ITN-238577), see http://www.pardem.eu/ for more information.
References
- Alonso-Marroquin and Herrmann (2004) Alonso-Marroquin, F., Herrmann, H. J., 2004. Ratcheting of Granular Materials. Physical Review Letters 92, 054301.
- Atanackovic (2002) Atanackovic, T. M., 2002. A modified Zener model of a viscoelastic body. Vol. 14. Springer-Verlag, pp. 137–148.
- Bagley and Torvik (1986) Bagley, R. L., Torvik, P. J., 1986. On the fractional calculus model of viscoelastic behavior. Journal of Rheology 30 (1), 133–155.
- Bandi et al. (2013) Bandi, M. M., Rivera, M. K., Krzakala, F., Ecke, R. E., Apr. 2013. Fragility and hysteretic creep in frictional granular jamming. Physical Review E 87 (4): 042205.
- Bardet (1997) Bardet, J. P., 1997. Experimental Soil Mechanics. Prentice-Hall, Upper Saddle River, New Jersey.
- Baumann et al. (1996) Baumann, G., Scheffler, T., Jánosi, I. M., Wolf, D. E., 1996. Angle of repose in a two-dimensional rotating drum model. In: Wolf, D. E., Schreckenberg, M., Bachem, A. (Eds.), Traffic and Granular Flow. World Scientific, Singapore, pp. 347–351.
- Cantelaube and Bideau (1995) Cantelaube, F., Bideau, D., Apr. 1995. Radial Segregation in a 2d Drum: An Experimental Analysis. EPL (Europhysics Letters) 30 (3), 133–138.
- Chambon et al. (1986) Chambon, F., Petrovic, Z. S., MacKnight, W. J., Winter, H. H., 1986. Rheology of model polyurethanes at the gel point. Macromolecules 19 (8), 2146–2149.
- Dieterich and Kilgore (1994) Dieterich, J. H., Kilgore, B. D., 1994. Direct observation of frictional contacts: New insights for state-dependent properties. Pure and Applied Geophysics 143 (1-3), 283–302.
- Feise (1998) Feise, H. J., 1998. A review of induced anisotropy and steady-state flow in powders. Powder Technology 98 (3), 191–200.
- Freeman (2007) Freeman, R., 2007. Measuring the flow properties of consolidated, conditioned and aerated powders — A comparative study using a powder rheometer and a rotational shear cell. Powder Technology 174 (1-2), 25–33.
- Friedrich (1991) Friedrich, C., 1991. Relaxation and retardation functions of the Maxwell model with fractional derivatives. Rheologica Acta 30 (2), 151–158.
- Gloeckle and Nonnenmacher (1991) Gloeckle, W. G., Nonnenmacher, T. F., 1991. Fractional integral operators and Fox functions in the theory of viscoelasticity. Macromolecules 24 (24), 6426–6434.
- Harder and Schwedes (1985) Harder, J., Schwedes, J., 1985. The Development of a True Biaxial Shear Tester. Particle and Particle Systems Characterization 2 (1-4), 149–153.
- Head (1998) Head, K. H., 1998. Manual of soil laboratory testing: Effective stress tests. Manual of Soil Laboratory Testing. John Wiley & Sons, USA.
- Imole et al. (2013a) Imole, O. I., Kumar, N., Magnanimo, V., Luding, S., 2013a. Hydrostatic and Shear Behavior of Frictionless Granular Assemblies Under Different Deformation Conditions. KONA Powder and Particle Journal 30, 84–108.
- Imole et al. (2013b) Imole, O. I., Wojtkowski, M., Magnanimo, V., Luding, S., 2013b. Force correlations, anisotropy, and friction mobilization in granular assemblies under uniaxial deformation. In: Yu, A., Luding, S. (Eds.), Powders and Grains, AIP Conf. Proc. Vol. 1542. pp. 601–604.
- Imole et al. (2014) Imole, O. I., Wojtkowski, M. B., Magnanimo, V., Luding, S., 2014. Micro-Macro Correlations and Anisotropy in Granular Assemblies under Uniaxial Loading and Unloading. Phys. Rev. E. 89, 042210.
- Janssen (1895) Janssen, H. A., 1895. Versuche über Getreidedruck in Silozellen. Zeitschr. d. Vereines deutscher Ingenieure 39 (35), 1045–1049.
- Janssen and Zetzener (2003) Janssen, R. J. M., Zetzener, H., 2003. Measurements on cohesive powder with two biaxial shear testers. Chem. Engng. & Technol. 26 (2), 147–151.
- Jonscher (1977) Jonscher, A. K., 1977. The ‘universal’ dielectric response. Nature 267 (5613), 673–679.
- Jonscher (1999) Jonscher, A. K., 1999. Dielectric relaxation in solids. Journal of Physics D: Applied Physics 32 (14), 57–70.
- Kamath et al. (1994) Kamath, S., Puri, V. M., Manbeck, H. B., 1994. Flow property measurement using the Jenike cell for wheat flour at various moisture contents and consolidation times. Powder Technology 81 (3), 293–297.
- Kjartansson (1979) Kjartansson, E., Aug. 1979. Constant Q-wave propagation and attenuation. J. Geophys. Res. 84 (B9), 4737–4748.
- Kruijer et al. (2006) Kruijer, M. P., Warnet, L. L., Akkerman, R., Feb. 2006. Modelling of the viscoelastic behaviour of steel reinforced thermoplastic pipes. Composites Part A: Applied Science and Manufacturing 37 (2), 356–367.
- Kwade et al. (1994a) Kwade, A., Schulze, D., Schwedes, J., 1994a. Design of silos: Direct measurement of stress ratio [Auslegung von Silos. Unmittelbare Messung des Horizontallastverhaeltnisses]. Beton- und Stahlbetonbau 89 (3), 58–63.
- Kwade et al. (1994b) Kwade, A., Schulze, D., Schwedes, J., 1994b. Determination of the stress ratio in uniaxial compression tests - Part 1. Powder handling & Processing 6 (1), 61–65.
- Kwade et al. (1994c) Kwade, A., Schulze, D., Schwedes, J., 1994c. Determination of the stress ratio in uniaxial compression tests - Part 2. Powder handling & Processing 6 (2), 199–203.
- Luding (2008) Luding, S., 2008. Cohesive, frictional powders: contact models for tension. Granular Matter 10 (4), 235–246.
- Mainardi (2010) Mainardi, F., 2010. Fractional Calculus and Waves in Linear Viscoelasticity. Imperial College Press-World Scientific, London.
- Metzler (2003) Metzler, R., 2003. Fractional relaxation processes and fractional rheological models for the description of a class of viscoelastic materials. International Journal of Plasticity 19 (7), 941–959.
- MiDi (2004) MiDi, G. D. R., 2004. On dense granular flows. The European Physical Journal E: Soft Matter and Biological Physics 14 (4), 341–365.
- Morgeneyer et al. (2003) Morgeneyer, M., Brendel, L., Farkas, Z., Kadau, D., Wolf, D. E., Schwedes, J., 2003. Can one make a powder forget its history? Proceedings of the 4th international conference for conveying and handling of particulate solids, Budapest, 12–118.
- Morgeneyer and Schwedes (2003) Morgeneyer, M., Schwedes, J., 2003. Investigation of powder properties using alternating strain paths. Task Quarterly 7 (4), 571–578.
- Philippe et al. (2011) Philippe, P., Bonnet, F., Nicot, F., 2011. Settlement of a granular material: boundary versus volume loading. Granular Matter 13 (5), 585–598.
- Ristow (1996) Ristow, G. H., 1996. Dynamics of granular material in a rotating drum. Europhys. Lett. 34 (4), 263–268.
- Röck et al. (2008) Röck, M., Morgeneyer, M., Schwedes, J., Kadau, D., Brendel, L., Wolf, D. E., 2008. Steady state flow of cohesive and non-cohesive powders. Granular Matter 10 (4), 285–293.
- Saadatfar et al. (2012) Saadatfar, M., Sheppard, A. P., Senden, T. J., Kabla, A. J., 2012. Mapping forces in a 3D elastic assembly of grains. Journal of the Mechanics and Physics of Solids 60 (1), 55–66.
- Schiessel et al. (1995) Schiessel, H., Metzler, R., Blumen, A., Nonnenmacher, T. F., 1995. Generalized viscoelastic models: their fractional equations with solutions. Journal of Physics A: Mathematical and General 28 (23), 6567–6584.
- Schulze (2003) Schulze, D., 2003. Time- and Velocity-Dependent Properties of Powders Effecting Slip-Stick Oscillations. Chem. Eng. Technol. 26 (10), 1047–1051.
- Schwedes (1968) Schwedes, J., 1968. Fliessverhalten von Schuettguetern in Bunkern. Verlag Chemie,Weinheim.
- Schwedes (2003) Schwedes, J., 2003. Review on testers for measuring flow properties of bulk solids. Granular Matter 5 (1), 1–43.
- Shinbrot et al. (2012) Shinbrot, T., Kim, N. H., Thyagu, N. N., 2012. Electrostatic precursors to granular slip events. Proceedings of the National Academy of Sciences 109 (27), 10806–10810.
- Thakur et al. (2013) Thakur, S. C., Imole, O. I., Wojtkowski, M. B., Magnanimo, V., Montes, E. C., Ramaioli, M., Ahmadian, H., Ooi, J. Y., 2013. Characterization of cohesive powders for bulk handling and DEM modelling. In: Bischoff, M., Oñate, E., Owen, D. R. J., Ramm, E., Wriggers, P. (Eds.), III International Conference on Particle-based Methods - Fundamentals and Applications. ICNME, pp. 1–12.
- Tomas (2000) Tomas, J., 2000. Particle Adhesion Fundamentals and Bulk Powder Consolidation. KONA 18, 157–169.
- Tykhoniuk et al. (2007) Tykhoniuk, R., Tomas, J., Luding, S., Kappl, M., Heim, L., Butt, H. J., 2007. Ultrafine cohesive powders: From interparticle contacts to continuum behavior. Chem. Eng. Sci. 62 (11), 2843–2864.
- Verzijden (2005) Verzijden, P. G., 2005. The Flow Behavior of Coffee Powder. Masters thesis, TU Delft.
- Walton (1995) Walton, O. R., 1995. Force models for particle-dynamics simulations of granular materials. In: Guazzelli, E., Oger, L. (Eds.), Mobile Particulate Systems. Vol. 287. Kluwer Academic Publishers, Dordrecht, pp. 367–380.
- Winter and Chambon (1986) Winter, H. H., Chambon, F., 1986. Analysis of linear viscoelasticity of a crosslinking polymer at the gel point. Journal of rheology 30, 367–382.
- Yun and Evans (2011) Yun, T. S., Evans, T. M., 2011. Evolution of at-rest lateral stress for cemented sands: experimental and numerical investigation. Granular Matter 13 (5), 671–683.
- Zetzener and Schwedes (2002) Zetzener, H., Schwedes, J., 2002. Relaxation and Creep of Dry Bulk Solids. Part. Part. Syst. Charact. 19 (3), 144–148.