Interaction patterns in diabetes mellitus II network: An RMT relation
Sarika Jalan∗,1,2 Aparna Rai1, Amit Kumar Pawar2,
1 Centre for Bio-Science and Bio-Medical Engineering, Indian Institute of Technology Indore, M-Block, IET-DAVV Campus,
Khandwa Road, Indore, Madhya Pradesh, 452017, India
2 Complex Systems Lab, Discipline of Physics, Indian Institute of Technology Indore, M-Block, IET-DAVV Campus,
Khandwa Road, Indore, Madhya Pradesh, 452017, India
E-mail: sarikajalan9@gmail.com
Abstract
Diabetes mellitus type II affects around 8 percent of the total adult population in the world. It is the fifth leading cause of death in high income countries and an epidemic in developing countries. We analyze protein-protein interaction data of the pancreatic cells for normal and disease states. The analysis exhibits overall structural similarities in the normal and disease networks. The important differences are revealed through specific interaction patterns and eigenvector analyses. The top contributing nodes from localized eigenvectors as well as those being part of specific interaction patterns turn out to be significant for the occurrence of the disease. The analysis provides a direction for further development of novel drugs and therapies in curing the disease by targeting specific patterns instead of a single node.
Introduction
Diabetes mellitus type II (DM-II) is a metabolic disorder which is characterized by resistance to insulin and abnormalities in the hepatic cells in terms of glucose production [1]. It has been known to be a complex and multi factorial disease [2] as it affects various other organ systems in the body like cardiovascular system, kidneys, lungs, eyes etc [3, 4]. The WHO statistics reveals that DM-II has affected nearly 325 million people till 2013 out of which cases are undiagnosed and the disease show rising trend world-wide [7, 6, 5]. Diabetes is known to cause 5.1 million death in 2013 and statistical data reveals that every six seconds a person dies from diabetes further probing that it is the fifth leading cause of death in high income countries and an epidemic in developing countries [8, 9]. It is one of the most important non-communicable diseases of the 21st century accounted both in terms of mortality and morbidity [10]. Indecent lifestyle, increased urbanization and unhealthy behaviors are some of the major causes behind the disease [11]. Recent biological studies indicate that significant increase in population having obesity has in turn become a major reason for higher DM-II cases [12]. Some genome wide studies reveal genetic basis of DM-II by finding some important proteins which are heritable and cause DM-II further indicating that dysfunctioning of beta cells is another reason for the occurrence of the disease apart from insulin resistance [13]. This disease is likely to increase the burden of chronic diabetic complications worldwide in the near future [14, 15, 16]. It has been found that treatment of people with diabetes account for up to 15 of international health care budgets [17, 18]. According to a recent study, a person with this complex disease spends on an average more than in the treatment and its complications over entire lifetime and trillion dollars are spent on health and diseases worldwide [18]. An early detection may help in cure to the people with this disease. But the research pertaining to development of novel treatments and cure methods is very exhaustive [8]. Even after enormous investment in pharmacological research and clinical trials in the past decades, there has not been proportionate advancement in clinical results. All these demand for a new perspective in disease research, which we provide here using combined framework of random matrix theory and network theory. This framework predicts important structural patterns crucial for disease is very time efficient and cost effective.
Previously, a network analysis of PPI netwok of DM-II reveals potential drug targets on the basis of candidate genes involved in DM-II [19]. Few network studies done also reveal some important pathways associated with insulin signaling using high-throughput micro-array datasets [20, 21, 22]. DM-II investigated using systems biology approach highlights the occurrence of the disease. These studies are based on a handful of disease-associated proteins, while our investigation for the first time performs extensive analysis of the whole pancreatic cell proteins. We investigate DM-II at the proteomic level using network biology along with the random matrix theory (RMT). This mathematical theory has been formulated six decades ago in order to understand complex nucleons interactions [23]. Later on, the theory has shown its remarkable success in understanding various complex systems ranging from quantum chaos to galaxy [24, 25, 26, 27, 28]. In the current work, we construct the protein-protein interaction (PPI) network of DM-II by analyzing normal and disease states of pancreatic cells and investigate their structural properties, which is further compared with the properties of random networks. The analysis reveals specific structural patterns, as well as nodes contributing significantly to the most localized eigenvector being crucial for the occurrence of the disease.
Materials and Methods
Data assimilation and network construction
We study the PPI network of DM-II, where nodes are the proteins and edges denote the interactions between these proteins. After diligent and enormous efforts, we collect the protein interaction data from various literature and bioinformatic sources. To keep the authenticity of the data intact, we only take the proteins into account which are reviewed and cited. We consider two widely used bioinformatic databases namely Genbank from NCBI [29] and UNIPROT constituting data available from other resources like European Bioinformatic Institute, the Swiss Institute of Bioinformatics, and the Protein Information Resource [30]. To add more information, we take highly studied diabetes mellitus II cell lines whose protein expression data is known. Here, we use the protein expression data of EndoC H cells in the disease dataset [31]. Since there are a very few human cell lines available, we take the mouse and rat cell lines namely MIN and INS-1, proteins of which have already been proved to behave similarly in humans [32, 33]. After collecting the proteins for both the datasets, their interacting partners are downloaded from STRING database [34]. We take into account largest sub-networks from the normal as well as from the disease data and investigate their structural and spectral properties.
Structural measures
There are several structural measures used enormously in the last fifteen years in order to understand and characterize the properties of a network [35]. Here we define only those which are useful for our analysis. To start with, let us first define the interaction matrix or the adjacency matrix of the network as follows:
| (1) |
The most basic structural parameter of a network is the degree of a node (), which is defined as the number of neighbors the node has (). The degree distribution , revealing the fraction of vertices with degree , is known as the fingerprint of the network [35]. Another important parameter is the clustering coefficient (CC) of the node , which is defined as the ratio of the number of connections a particular node has and the possible number of connections that particular node can have. Clustering coefficient of a network can be written as
| (2) |
The average clustering coefficient of the network characterizes the overall tendency of nodes to form cluster or groups. Further, the betweenness centrality of a node is defined as the fraction of shortest paths between node pairs that pass through the said node of interest [36]. Another important parameter is the diameter of the network which measures the longest of the shortest paths between all the pair of nodes [35].
Spectral techniques
Eigenvalues of adjacency matrix (Eq. 1) denoted as is referred as network spectra. Further, we use the inverse participation ratio (IPR) to analyze localization properties of the eigenvectors. The IPR of th eigenvector with its th component being denoted by , can be defined as
| (3) |
which shows two limiting values : (i) a vector with identical components has , whereas (ii) a vector, with one component and the remainders being zero, has . Thus, the IPR quantifies the reciprocal of the number of eigenvector components that contribute significantly. An eigenvector whose components follow Porter-Thomas distribution yields = [37], and those which are deviating from this value provide system dependent information [38]. We further calculate the average value of IPR, in order to measure an overall localization of the network calculated as
| (4) |
| Network | |||||||||
| Normal-1 | 2083 | 11017 | 10 | 17 | 0.35 | 6.1 | 0.010 | 3.1 | 1.8 |
| Normal-2 | 1705 | 9888 | 11 | 12 | 0.33 | 6.2 | 0.008 | 3.5 | 1.8 |
| Disease-1 | 656 | 3628 | 11 | 10 | 0.36 | 6.0 | 0.015 | 3.6 | 1.06 |
| Disease-2 | 384 | 1882 | 10 | 9 | 0.46 | 7.8 | 0.032 | 7.2 | 4.9 |
The columns represent the total number of proteins (nodes) in the network collected using various databases (described in the Method section), number of connections in the sub-networks , the average degree , diameter (D), average clustering coefficient , the number of nodes having in the whole network (), average IPR , and number of degenerate eigenvalues in the whole network and for the sub-networks of both the normal and the disease state.
Results and Discussions
Structural properties
The normal dataset has 4613 nodes (proteins) and 26035 connections (interactions) among them, while the disease dataset comprises of 1100 nodes and 5578 connections exhibiting that the disease data consists of less number of proteins as well as connections than the normal one. One of the possible reasons behind this could be less availability of data for the disease state as already discussed under the data assimilation section. Another possible reason could be that in the disease state, many pathways are silenced or levels of protein expressions are altered leading to less number of proteins [39]. The normal and the disease datasets lead to many connected clusters or sub-networks, whose sizes are summarized in the first column of Table. 1. The next column in Table. 1 conveys that even with less number of nodes, the disease sub-networks possess almost same () as the normal ones. Further, the disease sub-networks show relatively lower diameter as compared to the normal one. Since small diameter facilitates a fast communication [40], up-regulation and down-regulation of pathways may be one of the reasons behind faster signaling leading to the disease state. Further, we calculate the average clustering coefficient of all the sub-networks along with the total number of nodes having equal to () as tabulated in Table. 1. The percentage of nodes having this property for the normal and all the disease sub-networks, except , are approximately same. For , the number of nodes having is slightly higher as compared to other sub-networks indicating the presence of more clique structures in this sub-network. Importance of cliques and relevance of this structure for the disease will become more clear in the section “preserved structure through clique formation” section.
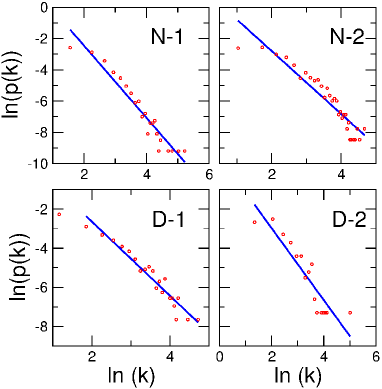
The degree distribution of both the normal and the disease sub-networks follow power law (Figure. 1) indicating that few nodes have very high degree. Earlier studies on structural analysis of DM-II network also emphasize on proteins having large number of interactions being functionally important [41]. Since the present investigation uses a much larger number of proteins and interactions as compared to any other work done on DM-II, our datasets reveal new proteins that comes out to be top in the degree distribution. The bigger dataset used in our investigation arises due to the following two reasons, first, we have made exhaustive literature search for almost all the authenticated databases to construct our dataset, and second, there is revelation of new proteins and interactions since 2008 [41] contributing to additional interactions to the proteins in our dataset.
In the first disease sub-network, UBB and UBA-52 are the highest degree nodes, while for the second sub-network, UBI-15, INS, ALB and BBS-12 come out to be significant. We find that, these nodes are involved in insulin production and are known to be regulated in the disease state leading to less production of insulin. The detailed functional description of high degree nodes is deferred to the supplementary material. Further, since the power law degree distribution is known to confer robustness to the underlying network against random external perturbations as well as to instill complexity in the corresponding system [35], the similar behavior exhibited by the disease and normal networks bring them into the same universality class of other complex biological systems [42]. What follows that, overall structural properties such as diameter, clustering coefficient, average degree and degree distribution of disease and normal sub-networks are similar indicating complex interactions and fast dissemination of information in the pancreatic cell which is in the line of other complex systems. The important differences between the disease and normal states are revealed when we analyze nodes forming complete sub-graphs as well as those appearing in spectral analysis under the RMT framework.
Preserved structures through clique formation
All the sub-networks have very high value of as depicted in Table. 1. This implicates the presence of high number of triangles or cliques of order three [40]. Cliques indicate preserved interactions in the networks and are believed to be conserved during evolution [43]. Further, these structures are also considered to be the building blocks of a network for making the underlying system more robust [44] and stable [45]. Therefore, we hope to bring out important information by analyzing these patterns in details. We focus on the nodes having and which are common in both the networks. It turns out that, there are 34 nodes appearing common in the normal and disease datasets. We perform extensive functional analysis of these nodes to study the differences in both the states as these proteins enjoy special structural feature in the networks.
Biological significance of proteins involved in preserved structures
The functional properties of these nodes reveal that out of 34 there are six proteins, namely ADAMTS9, G5A, PIK3C2A, VAPA, SPTBN2 and CTNNB2, which are responsible for regulating the levels of insulin in the blood leading to insulin resistance which is a primary symptom of the occurrence of type 2 diabetes in an individual [46]. Another set of proteins having namely NR2C2, AGER, CACNA1D and CD59 are involved in the abnormal secretion and absorption of glucose which is another reason for DM-II. Some proteins viz. PTPRN, TGM2, SCARB2, VAPA, CBX3 and SPTBN2 are involved both in the insulin resistance and aberrant glucose metabolism [47]. Further, TAGLN and VDAC2 are two proteins which are found up-regulated in obesity and as obesity is strongly associated with DM-II, these proteins stand important for occurrence of the disease. SLC16A1 is associated with regulation of lipid metabolism and is also a novel protein for diabetes mellitus II [48]. Proteins OTUB1, UCHL1, NQO1 and PSMC5 have significant roles in ubiquitin-proteosome system which is regulated in DM-II. Next, expressions of SLC3A2 and IGHA1 are altered which are associated with excess urination and thereby leading to the disease state as excessive urination is a major symptom of DM-II. Moreover, VDAC2 and HPRT1 play a major role in house-keeping functions of the cell by energy regulation. Other proteins C6, C8A, NME3, DDC, FBLN1 and EKB are not directly related with the onset of the disease and perform house-keeping functions. Elaboration on above analysis is given in supplementary material. What follows that, out of , proteins are directly responsible for the occurrence of Diabetes mellitus II. The nodes having equals to common in both the disease and normal have a significant role in the occurrence of the disease. We further compare these structural properties to various other model networks namely random, small world network and configuration networks to examine the deviation of the disease and normal networks from the random controls.
| Network | ||||
|---|---|---|---|---|
| Normal-1 | 0.005 | 0 | 0 | 0 |
| Normal-2 | 0.007 | 0 | 0 | 0 |
| Disease-1 | 0.017 | 0 | 0 | 0 |
| Disease-2 | 0.027 | 0 | 0 | 0 |
The parameters show all the results as ensemble average of 10 realizations of Erdős-Rényi network with same and as for real networks.
Comparison with various random control networks
Erdős-Rényi random model
Erdős-Rényi random network is the simplest model proposed about half a century back, to understand structural properties of real world systems [49]. We generate Erdős-Rényi network with the same number of nodes and average degree as the normal and the disease sub-networks. To create an Erdős-Rényi network, we connect nodes with a fixed probability , calculated as . Since nodes are connected randomly with the probability , without any special preference or additional constraints, this gives rise to the Poisson degree distribution. Properties of Erdős-Rényi random networks thus constructed, are summarized in Table. 2. Owing to the very much nature of construction of the Erdős-Rényi networks, we get very small clustering coefficient () which further diminishes the probability of having any node with . Additionally, there is no degeneracy found at or eigenvalues.
| Network | ||||
|---|---|---|---|---|
| Normal-1 | 0.36 | 0 | 0 | 0 |
| Normal-2 | 0.36 | 0 | 0 | 0 |
| Disease-1 | 0.32 | 0 | 0 | 0 |
| Disease-2 | 0.44 | 0 | 0 | 0 |
Various parameters enlisted for small-world networks corresponding to the normal and disease sub-networks taking ensemble average of 10 realizations .
Small-world network
Since all the disease networks have significantly high value of indicating hidden importance of network interactions contributing to this property, we attempt to model this and investigate using corresponding small world networks (Table. 3). The small world networks are generated using Watts-strogatz algorithm [40]. Starting from a regular lattice, connections are rewired with the probability . The rewiring probability is chosen in such a manner that it leads to the desired clustering coefficient matching with the corresponding real networks. It turns out that while for the model network contribution to the CC comes from almost all the nodes, for the real world networks only nodes contribute to the clustering coefficient of the network and rest of the nodes do not have any interacting neighbors. i.e. they form star like structure. Additionally, real networks have significant number of nodes having , the property which again is not found in the corresponding model network. As elaborated in the previous section “preserved structure through clique formation”, the nodes with have special role in the occurrence of the disease, making the deviation of properties of the nodes from the model networks more crucial.
| Network | ||||
|---|---|---|---|---|
| Normal-1 | 0.023 | 7 | 1.5 | 0 |
| Normal-2 | 0.027 | 4 | 1.7 | 0 |
| Disease-1 | 0.083 | 12 | 4.5 | 0 |
| Disease-2 | 0.123 | 7 | 2.1 | 0 |
Ensemble average of 10 realizations for parameters of configuration model corresponding to the normal and diabetes networks listed for various properties.
Configuration model
Erdős-Rényi random and small world networks being the simplest models for capturing various properties of real systems fail to model one of the very important aspects of many real-world networks. The degree distribution of Erdős-Rényi random networks follow Poisson distribution whereas most of the real world networks [35], including those investigated here, follow power law behavior. This power law behavior can be modeled using preferential attachment rule [50], but configuration model additionally preserves the exact degree sequence of a network [51] and hence we make comparison with this model which produces an exact random replication of the network considered here. The configuration model generates a random network with a given degree sequence of an array of size which have random connections among different elements. We generate 10 such realizations for a given degree sequence.
Properties of the configuration model corresponding to the normal and diabetes sub-networks are enlisted in Table. 4. The clustering coefficient, inverse participation ratio, of all the configuration model networks are all same as for the Erdős-Rényi random networks as expected from the configuration model algorithm, which randomly connects pair of nodes by following only one constraint that is preservation of the degree of all the nodes. For configuration model, there is an additional property which comes out to be different than other model networks that is about degenerate eigenvalues. This occurrence of degeneracy is not surprising [52] as power law degree distribution is known to add into occurrence of high degeneracy at [53]. Further, we note that all these model networks, while acting under one or the other constraint, are basically built up on random interactions, i.e., the pairs of nodes that should interact are chosen randomly out of many possible configurations. The feature which real-world systems are supposed to lack and in turn being captured in various spectral properties. For instance, none of the random controls are able to reproduce high degeneracy at . In addition, there is degeneracy at as well, which too is not captured by any of the model networks widely investigated in the network literature reflecting richer interaction patterns possessed by these real systems. In the next sections, we will delve into understanding the spectral features of the four sub-networks.
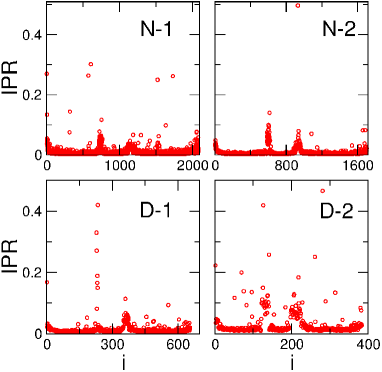
Localization behavior of spectra
The localization properties of eigenstates have been shown to provide clue to the important nodes of the network [54]. We calculate the eigenvector localization using IPR (Eq. 3), and based on the localization behavior, we can divide the individual spectrum into two different components. First component which follows RMT predictions of Porter-Thomas distribution of GOE statistics [55], and another one which deviates from this universality and indicates localization (Figure. 2). The very distinct interpretation of this behavior of universal and non-universal (deviation from universality) components is that the underlying system has random interactions leading to universal part of the spectra, as well as non-random, pattern specific interactions contributing to the part of the spectra deviating from the universality. Further, the average IPR calculated using Eq. 4 for the normal and disease sub-networks reveal that the sub-networks of normal are less localized than the sub-networks of disease networks (Table. 1) indicating that the normal sub-networks are more random than the disease sub-networks. The fact is that the disease state has less number of connections than that of the normal one suggests that there are some interactions which are hampered or silenced perhaps due to mutation leading to the disease state. This interpretation combined with the analysis that of the disease is higher than the normal, indicates that these hampered pathways may be corresponding to or should be treated as random pathways whose removal result in the diminished randomness in the disease state. This result can be considered very important as randomness has already been emphasized as an essential ingredient for the robustness of a system [54] and lack of sufficient randomness might lead to the disease state.
| TCN | k | CC | BC | |
| 234 | PSMD1, PSMD11, PSMB8 | 4, 4, 4 | 1, 1, 1 | 0, 0, 0 |
| 228 | PFKP, PFKL, PSMB8, H3.3B | 5, 5, 4, 8 | 0.9, 0.9, 1, 0.75 | 0, 0, 0, 0.002 |
| 229 | COL1A2, COL3A1, PSMB8, H3.F3B | 6, 6, 4, 8 | 0.5, 0.53, 1, 0.75 | 0.002, 0.002, 0, 0.002 |
| 232 | PSMB8, PSME1, PSMD11, H3F3B, H3.3B, PSMD1 | 4, 4, 4, 8, 8, 4 | 1, 1, 1, 0.75, 0.75, 1 | 0, 0, 0, 0.002, 0.002, 0 |
Top localized eigenvectors () for the disease dataset representing the index of the localized eigenvector followed by their TCN’s in the next column and network parameters namely degree, clustering coefficient and betweenness centrality.
| TCN | k | CC | BC | |
| 281 | AVPR2, MT-ND5, MT-ND4 | 2, 13, 13 | 1, 0.846, 0.846 | 0, 0, 0.003 |
| 126 | MT-ND1, MT-CO3, MT-ND6 | 12, 1, 12 | 0.985, 0.985, 0.984 | 0, 0, 0 |
| 141 | SEL1L, SELS, C1S, HLA-DQA1 | 1, 2, 9, 6 | 0, 0, 0.5, 0.46 | 0, 0.005, 0.004, 0 |
| 261 | YWHAE, CALM1, CALM3, CALM2 | 1, 6, 5, 5 | 0, 0.53, 0.80, 0.80 | 0, 0.009, 0.003, 0.003 |
Top most localized eigenvectors () for the disease dataset, their top contributing proteins and network parameters namely degree, clustering coefficient and betweenness centrality.
As discussed, eigenvector localization technique offers the platform to distinguish random and non-random part of the spectra. The part deviating from RMT can be explored further to get insight into the important interactions revealed through the top contributing nodes (TCNs). In order to do that, we investigate properties of TCNs of both the sub-networks and as described in Table. 5 and Table. 6 respectively. There comes out to be 31 TCN’s in the disease sub-networks out of which 24 are unique. We analyze the structural properties namely, degree, clustering coefficient and betweenness centrality of these TCN’s in both the sub-networks. The top contributing proteins lie in the low degree regime demonstrating that they do not take part into many pathways. Additionally, the betweenness centrality of all the TCNs is nearly zero, indicating a very poor connectivity of these nodes with the rest of the nodes in their individual sub-network. In coalition, these both rule out a trivial importance of the nodes in terms of their interactions or connectivity, and hence we shift our focus to the biological significance of these TCNs and interaction patterns they are forming in the network.
Functional importance and interaction pattern of top contributing nodes
These TCNs when looked for their functional properties are found to be significantly important in DM-II. Among all the TCNs, SEL1L, SELS, PFKL and PFKP are associated with the glucose stimulated insulin secretion. In disease state SEL1L and SELS proteins are found to be under-expressed [56] whereas PFKL and PFKP over-express [57]. In addition to the above proteins, C1S, YWHAE, CALM1, CALM2, CALM3 and MT-CO3 are responsible for obesity in turn regulating levels of insulin leading to insulin resistance in the body and thus contributing to the occurrence the disease [58, 59, 60]. The proteins PSMD1, PSMD11, PSME1 and PSMB8 form a complex in the proteosome accounting for ATP dependent protein degradation and in disease state are found to be down regulated or absent which is directly related to obesity and DM-II [61, 62]. Further, MT-ND5, MT-ND4, MT-ND1 and MT-ND6 collectively are the components in mitochondria involved in insulin signaling and resistance as well as alteration in the cell leading to DM-II [63]. Additionally, increased levels of AVPR2 leads to glucose induced water loss in the body, hence leading to the disease state [64]. Protein HLA-DQA1 plays a central role in immune system and over expression of this protein increases the susceptibility to DM-II [65]. Furthermore, there are some TCNs localized but are not directly involved with DM-II namely COL1A, COL3A1, H3.3B and H3F3B. These proteins are found to play an important role in complications related to heart, lung and kidneys in turn leading to the symptoms of DM-II like regulated levels of glucose absorption in blood and urinary complications [66, 67]. A detailed functional information of all these proteins are discussed in the supplementary material.
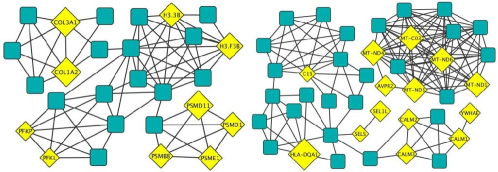
Next, we analyze the structural patterns of the TCNs in both the disease sub-networks. sub-network reveals the formation of cliques of order three for all the top contributing nodes (Figure. 3). This depicts that they are all involved in the same kind of pathways which is confirmed by studying the functional properties of these proteins briefly discussed above in this section. Further, the TCNs of sub-network too comprise of complete subgraphs (Figure. 3). The functional properties discussed above demonstrates that these TCNs form complexes as they perform same kind of functions e.g. proteosome complex (PSMD1, PSMD11, PSME1 and PSMB8), mitochondrial components (MT-NDs), collagen family (COL3A1 and COL1A) and histone complexes (H3.3B and H3F3B), details of which are explained in supplementary material. Thus, the interaction patterns of both the networks of disease dataset reveal that there are nodes pertaining to clique formations which indicate a robust and stable system as discussed in the section on “preserved structure through cliques”.
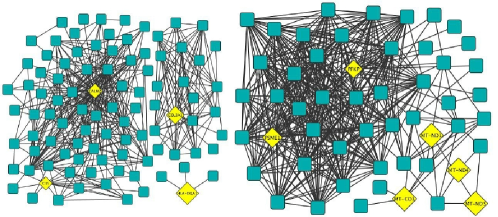
Thereafter, we compare the interaction patterns of TCNs in the disease state with their interaction patterns in the normal. Out of 24 TCNs in disease state, 10 are also found in the normal dataset. The interaction pattern of the disease TCNs in normal sub-networks possess clique like structures. The TCNs in normal dataset have comparatively high degree than in the disease state indicating more interactions. This may be due to silencing of various pathways (e.g. insulin signaling, glucose metabolism etc) from normal to the disease state as discussed earlier. The structural patterns indicate that even after less interactions in the disease state, the cliques of order three are not destroyed reflecting that the minimum criteria of maintaining the functionality of the networks are preserved. This may be due to addition of new proteins in the diseased state or interactions among themselves. In addition, the interacting patterns of these TCNs illustrate the phenomena of gene duplication i.e. a pair of node having exactly same interacting partners [68]. Here, out of the 10 TCNs common in both the states, two pairs of nodes namely C1S-CALM2 and PSME1-PFKP in the normal dataset possess the phenomena of gene duplication which is lost in the disease state (Figure. 4). Gene duplication has structural and functional significance as fluctuations or destruction in the interactions can either cause imbalance of genetic material or lead to the generation of new gene products resulting in diseases [69]. In TCNs, the proteins possessing gene duplication behavior affects the major pathways namely insulin resistance and pathways promoting obesity in turn resulting in DM-II. Thus, proteins revealed through the localization properties of spectra have interaction patterns which may be important as targeting sites for drug development of DM-II.
Conclusions
We analyze the pancreatic cells for the normal and disease states to get a deep overview of DM-II under the combined framework of network theory and random matrix theory. The structural properties namely average degree, diameter, clustering coefficient and degree distribution of both the networks follow almost similar predictions as for the other biological networks [42]. The average degree of all the normal and disease sub-networks is nearly same indicating that the disease state has some altered interactions and some new connections. The diameter of disease sub-networks is less than the normal which indicates that a reaction may get completed in few steps in turn increasing the rate of reaction and faster communication in processing a biological function. The degree distribution of all the normal and the disease sub-networks follow the power law behavior, the property which is known to make a system robust [42]. Interestingly, despite so many alterations in the interactions, disease networks still exhibit this property possessed by the normal networks indicating robustness and complex nature of interactions in the disease state. This could be one of the possible reasons of failure or poor response of drugs for DM-II [70].
The interesting observation comes out from the nodes having equal to indicating existence of clique structure in the network and since cliques are considered as preserved structures during the evolution making the system more robust and stable, we investigate biological functions of these nodes. It turns out that the nodes having equals to play an important role in the occurrence of the disease. They are involved in important pathways like insulin resistance, glucose metabolism and obesity which are directly related to type II diabetes.
Further, we compare properties of normal and disease sub-networks with those of various model networks to get a deeper understanding of various characteristic properties of networks under consideration. While corresponding model networks capture one or many structural properties of real world networks, the high degeneracy of eigenvalues found for the real networks are not observed for any of the model networks. Since, model networks are built using some algorithm, which connects pair of nodes using some probability distribution, deviation of this property of real world networks from that of model networks reflect that there are non-random interactions in the real world system which in turn leads to the formation of patterns, hence affecting the spectra of the network, leading to specific deviation of its properties from the corresponding random controls.
Furthermore, the spectral analysis of both the networks, by calculating the localization properties of eigenvector through IPR, reveals that the the disease sub-networks are less random than the normal one. Randomness in network connections or interactions has already been emphasized for the proper functioning of various complex systems [71, 72, 73, 74, 75]. The revelation that the disease network is less random than the normal one, detected through the RMT techniques, is an important step to complex systems research at the fundamental level. It indicates that sufficient randomness is an essential ingredient for proper functioning of the system leading to a normal state, lack of which causes the disease. The TCNs of the most localized eigenvectors lie in the low degree regime and have almost zero betweenness centrality, exhibiting no trivial structural importance. But they form important structural patterns as out of TCNs, have been found to form cliques with other proteins. Since, clique structures have been emphasized to be important for robustness of the underlying system [44], the proteins forming cliques here indicate that as random perturbations in the network leaves the system stable. This may also lead to ineffective drugs and treatments to the patients as also predicted from the power law behavior discussed earlier in this section. The functional examination of these TCNs demonstrates that out of , proteins have biological significance in the occurrence of the disease by involving in crucial pathways related to DM-II such as insulin signaling and resistance. These structural and functional implications reflect that the localization property reveals important nodes of the network.
We investigate interactions of TCN in normal dataset as well. It is found that 10 TCNs from the disease dataset are common in the normal dataset. The connections among common TCNs form the same conserved structure i.e. clique. In addition, there are two pairs of TCNs in the normal dataset which follow the phenomena of gene duplication which is lost in the disease network. It is already known that the alterations or destructions in the interactions having gene duplication leads to disease state [69]. On one hand, the revelation that the number of interactions of TCNs in normal dataset is more than that those observed in the disease indicates silencing of pathways in the disease state. On the other hand, comparison of structural patterns of TCNs in the normal and disease states reveals that even after removal of various connections probing to gene duplication either by forming new connections with new proteins or within themselves in the disease condition, the underlying system subsists. Thus, these patterns may play an important role in depicting novel drug targets taking them as site of action. It would be noteworthy to mention here that though the disease-implicating proteins revealed through our analysis belong to certain parts of the interaction network, they are detected through spectral analysis of the whole matrix and takes into account all interactions providing a holistic approach.
To conclude, we provide a platform to detect important proteins revealed through structural patterns in DM-II using network approach and random matrix theory. The analysis suggests that instead of targeting individual proteins, a group of proteins forming particular interaction patterns should be taken into consideration for drug development. This approach, though based on sophisticated mathematical techniques, is time-efficient and cost-effective and paves a way to look into the diseases from a different perspective by taking the whole system into consideration. For the first time RMT is applied to analyze the DM-II and our work demonstrates that it can be modeled using appropriate ensemble of RMT. Being the first step, the approach holds the potential to provide a new dimension to disease research. RMT is a very well developed branch of physics and continues to witness emerging techniques and concepts [76, 77]. Appreciating the applicability of this technique in uncovering crucial information about DM-II, other well developed tools of RMT can be used to gain more insight into the complexity of DM-II and decipher important entities and their structural patterns significant in other diseases. Moreover, our work on one hand presents a new tool to identify proteins responsible for occurrence of the disease and predicts interaction patterns for drug targets, while on the other hand provides insight into complexity of the disease at the rudimentary level. The analysis exemplifying the structural and functional significance of these proteins indicates that rather than individual units, the whole interaction pattern can be treated as a target for drug development providing a new direction to treatment of the disease. This approach can also be extended in composition of novel drugs, conceptualization of single drug therapy for multiple diseases [78, 79] and devising personalized therapy [80] being especially beneficial for low-income countries.
Acknowledgments
SJ is grateful to Department of Science and Technology, Government of India and Council of Scientific and Industrial Research, India project grants SR/FTP/PS-067/2011 and 25(0205)/12/EMR-II for financial support. AR is thankful to the Complex Systems Lab members Camellia Sarkar and Sanjiv K Dwivedi for helping with the plots and useful discussions.
Author contributions
SJ conceived and supervised the project. AR collected the data and AKP searched functional properties. SJ and AR analyzed the data and wrote the manuscript.
Competing financial interests
The authors declare no competing financial interests.
References
- [1] Fujimoto WY (2000) The importance of insulin resistance in the pathogenesis of type 2 diabetes mellitus. Am J Med 108: 9-14.
- [2] McIntyre EA, Walker M (2002) Genetics of type 2 diabetes and insulin resistance: knowledge from human studies. Clin Endocrinol 57: 303-11.
- [3] Tusie LMT (2005) Genes and type 2 diabetes mellitus. Arch Med Res 36: 210-22.
- [4] Kasuga M (2006) Insulin resistance and pancreatic beta cell failure. J Clin Invest 116: 1756-60.
- [5] King H, Aubert RE, Herman WH (1998) Global burden of diabetes, 1995-2025: prevalence, numerical estimates, and projections. Diabetes Care 21: 1414-31.
- [6] Danaei G, Finucane MM, Lu Y, Singh GM, Cowan MJ, et al. (2011) National, regional, and global trends in fasting plasma glucose and diabetes prevalence since 1980: systematic analysis of health examination surveys and epidemiological studies with 370 country-years and 2·7 million participants. Lancet 378: 31-40.
- [7] World Health Organization (2011) Diabetes fact sheet. Available: http://www.who.int/mediacentre/factsheets/fs312/en/. Accessed 30 June 2014.
- [8] International Diabetes Federation (2013) IDF Diabetes Atlas, 6th edn Brussels. Belgium: International Diabetes Federation. Available: http://www.idf.org/diabetesatlas. Accessed 25 June 2014.
- [9] Zimmet P., Alberti K. G., and Shaw J. (2001) Global and societal implications of the diabetes epidemic. Nature 414: 782–787.
- [10] Sepúlveda J andnMurray C (2014) The state of global health in 2014. Science 345: 1275-1278.
- [11] Lin EJ, Katon W, Von Korff M, Rutter C, Simon GE et al. (2004) Relationship of depression and diabetes self-care, adherence, and preventive care. Diabetes Care 27: 2154-60.
- [12] Dean L, McEntyre J (2004) The genetic landscape of diabetes, Washington: National library of medicine.
- [13] Herder C, Roden M (2010) Genetics of type 2 diabetes: pathophysiologic and clinical relevance. Eur J Clin Invest 41: 679-92.
- [14] Rosenbloom AL, Joe JR, Young RS, Winter WE (1999) Emerging epidemic of type 2 diabetes in youth. Diabetes Care 22: 345-54.
- [15] Dabelea D, Hanson RL, Bennett PH, Roumain J, Knowler WC, et al. (1998) Increasing prevalence of Type II diabetes in American Indian children. Diabetologia 41: 904-10.
- [16] Kitagawa T, Owada M, Urakami T, Yamauchi K (1998) Increased incidence of non-insulin dependent diabetes mellitus among Japanese schoolchildren correlates with an increased intake of animal protein and fat. Clin Pediatr (Phila) 37: 111-5.
- [17] American Diabetes Association (1998) Economic Consequences of Diabetes Mellitus in the U.S. in 1997. Diabetes Care 21: 296-309.
- [18] International Diabetes Federation (1996) World Health Organization. The Economics of Diabetes and Diabetes Care. Brussels: International Diabetes Federation, 1996. Accessed: 12 July 2014.
- [19] Randhawa V, Sharma P, Bhushan S and Bagler G (2013) Identification of Key Nodes of Type 2 Diabetes Mellitus Protein Interactome and Study of their Interactions with Phloridzin. OMICS 17: 302-317.
- [20] Liu M, Liberzon A, Kong SW, Lai WR, Park PJ, et al. (2007) Network-based analysis of affected biological processes in type 2 diabetes models. PLoS Genet 3: e96.
- [21] Rasche A, Hasani H AL and Herwig R (2008) Meta-analysis approach identifies candidate genes and associated molecular networks for type-2 diabetes mellitus. BMC Genom 9: 310.
- [22] Voight BF, Scott LJ, Steinthorsdottir V, Morris AP, Dina C, et al. (2010) Twelve type 2 diabetes susceptibility loci identified through large-scale association analysis. Nat. Genet. 42: 579–589.
- [23] Wigner EP (1955) Characteristic Vectors of Bordered Matrices With Infinite Dimensions. Annals of Mathematics 62: 548-564.
- [24] Papenbrock T, Weidenmuller H A (2007) Colloquium: Random matrices and chaos in nuclear spectra. Rev Mod Phys 79: 997.
- [25] Fossion R, Vargas GT, Vieyra JCL (2013) Random-matrix spectra as a time series. Phys Rev E 88: 060902.
- [26] Gibson SM, Ficklin SP, Isaacson S, Luo F, Feltus FA, et al. (2013) Massive-Scale Gene Co-Expression Network Construction and Robustness Testing Using Random Matrix Theory. PLoS ONE 8(2): e55871.
- [27] Jalan S, Sarkar C, Madhusudanan A, Dwivedi SK (2014) Uncovering Randomness and Success in Society. PloS one 9(2): e88249.
- [28] Agrawal A, Sarkar C, Dwivedi SK, Dhasmana N, Jalan S (2014) Quantifying randomness in protein–protein interaction networks of different species: A random matrix approach. Physica A 404: 359-367.
- [29] Benson DA, Cavanaugh M, Clark K, Lipman DJ, Ostell J, et al. (2013) GenBank. Nucleic Acids Res.41(Database issue):D36-42. Available: http://www.ncbi.nlm.nih.gov/genbank/. Accessed 05 May 2014.
- [30] Bairoch A, Apweiler R, Wu CH, Barker WC, Boeckmann B (2005) The Universal Protein Resource (UniProt). Nucleic Acids Res 33: D154–D159. Available: http://www.uniprot.org/ . Accessed 29 May 2014.
- [31] Weir GC, Weir SB (2011) Finally! A human pancreatic β cell line. J Clin Invest 121: 3395-7.
- [32] Skelin M., Rupnik M. and Cenci A. (2010) Pancreatic Beta Cell Lines and their applications in diabetes mellitus research. Altex 27: 105-113.
- [33] Waanders LF, Chwalek K, Monetti M, Kumar C, Lammert E, et al. (2009) Quantitative proteomic analysis of single pancreatic islets. PNAS 106: 18902-7.
- [34] Szklarczyk D, Franceschini A, Kuhn M, Simonovic M, Roth A, et al. (2011) The STRING database in 2011: functional interaction networks of proteins, globally integrated and scored. Nucleic Acids Res 39: D561-8. Available: http://string-db.org/. Accessed 11 June 2014.
- [35] Albert R, Barabasi AL (2002) Statistical mechanics of complex networks . Rev Mod Phys 74: 47.
- [36] Newman MEJ (2003) The Structure and Function of Complex Networks. SIAM Review 45: 167-256.
- [37] Haake F, Zyczkowski K (1990) Random-matrix theory and eigenmodes of dynamical systems. Phys Rev A 42: 1013-1016.
- [38] Jalan S, Ung CY, Bhojwani J, Li B, Zhang L, et al. (2012) Spectral analysis of gene coexpression network of Zebrafish. EPL 99: 410004.
- [39] Barabasi, A-L., Gulbahce, N. Loscalzo, J. (2011) Network medicine: a network-based approach to human disease. Nat. Rev. Genet. 12: 56-68.
- [40] Watts DJ, Strogatz SH (1998) Collective dynamics of ‘small-world’ networks. Nature 393: 440-2.
- [41] Lu H, Yang Y, Allister EM, Wijesekara N, Wheeler MB (2008) The identification of potential factors associated with the development of type 2 diabetes: a quantitative proteomics approach. Mol Cell Proteomics 7:1434-51.
- [42] Barabasi AL, Oltvai ZN (2004) Network biology: understanding the cell’s functional organization. Nat Rev Genet 5: 101-13.
- [43] Lotem EY, Sattath S, Kashtan N, Itzkovitz S, Milo R (2004) Network motifs in integrated cellular networks of transcription-regulation and protein-protein interaction. PNAS 101: 5934-9.
- [44] Alon U (2006) An introduction to Systems Biology: Design principles of Biological Circuits. London: Chapman and Hall/CRC.
- [45] Dwivedi SK and Jalan S (2014) Emergence of clustering: Role of inhibition. Phys Rev E 90:032803.
- [46] Martin BC, Warram JH, Krolewski AS, Bergman RN, Soeldner JS, et al. (1992) Role of glucose and insulin resistance in development of type 2 diabetes mellitus: results of a 25-year follow-up study. Lancet 340: 925-9.
- [47] Garvey WT, Huecksteadt TP, Matthaei S, Olefsky JM (1988) Role of glucose transporters in the cellular insulin resistance of type II non-insulin-dependent diabetes mellitus. J Clin Invest 81: 1528-36.
- [48] Fagot CA, Balkau B, Simon D, Warnet JM, Claude JR, et al. (1998) High free fatty acid concentration: an independent risk factor for hypertension in the Paris Prospective Study. Int J Epidemiol 27:808-13.
- [49] Erdos P, Renyi A (1959) Some further statistical properties of the digits in Cantor’s series. Acta Math Hungar 10: 21-29.
- [50] Barabási AL and Albert R (1999) Emergence of Scaling in Random Networks. Science 286: 509-512.
- [51] Newman ME, Strogatz SH, Watts DJ (2001) Random graphs with arbitrary degree distributions and their applications. PRE 64: 026118.
- [52] Farkas IJ, Derenyi I, Barabasi AL, Vicsek T (2001) Spectra of ”real-world” graphs: beyond the semicircle law. Phys Rev E 64: 026704.
- [53] Banerjee A, Jost J (2007) Laplacian spectrum and protein-protein interaction networks. arXiv: 0705 .3373v1.
- [54] Jalan S, Bandyopadhyay JN (2009) Randomness of random networks: A random matrix analysis. EPL 87: 48010.
- [55] Zyczkowski K (1991) Quantum Chaos. Cerderia HA, Ramaswami R, Gutzwiller MC, Casati G , editors. Quantum mechanical eigenvector statistics of chaotic systems. Singapore: World Scientific. pp. 153-168.
- [56] Francisco AB, Singh R, Sha H, Yan X, Qi L. et al. (2011). Haploid Insufficiency of Suppressor Enhancer Lin12 1-like (SEL1L) Protein Predisposes Mice to High Fat Diet-induced Hyperglycemia. J Biol Chem. 286(25): 22275-22282.
- [57] Elson A, Levanon D, Weiss Y, Groner Y (1994). Overexpression of liver-type phosphofructokinase (PFKL) in transgenic-PFKL mice: implication for gene dosage in trisomy 21. Biochem J. 299 ( Pt 2): 409-15.
- [58] Zhang J, Wright W, Bernlohr DA, Cushman SW, Chen X (2007). Alterations of the classic pathway of complement in adipose tissue of obesity and insulin resistance. Am J Physiol Endocrinol Metab. 292(5): E1433–E1440.
- [59] Adeyemo A, Gerry N, Chen G, Herbert A, Doumatey A, et al. (2009). A Genome-Wide Association Study of Hypertension and Blood Pressure in African Americans. PLoS Genet. 5(7): e1000564.
- [60] Ozcan L, Cristina de Souza J, Harari AA, Backs J, Olson EN, et al. (2013). Activation of calcium/calmodulin-dependent protein kinase II in obesity mediates suppression of hepatic insulin signaling. Cell Metab. 18(6): m803-15.
- [61] Gomes AV (2013). Genetics of Proteasome Diseases. Scientifica (Cairo). 637629.
- [62] Sakamoto K, Sato Y, Shinka T, Sei M, Nomura I, et al. (2009). Proteasome subunits mRNA expressions correlate with male BMI; implications for a role in obesity. Obesity (Silver Spring). 17(5): 1044-9.
- [63] Pravenec M, Hyakukoku M, Houstek J, Zidek V, Landa V, et al. (2007). Direct linkage of mitochondrial genome variation to risk factors for type 2 diabetes in conplastic strains. Genome Res. 17(9): 1319-26.
- [64] Riphagen IJ, Boertien WE, Alkhalaf A, Kleefstra N, Gansevoort RT, et al. (2013). Copeptin, A Surrogate Marker For Arginine Vasopressin, Is Associated With Cardiovascular And All-Cause Mortality In Patients With Type 2 Diabetes (Zodiac-31). Diabetes Care. 36(10): 3201-7.
- [65] Ma ZJ, Sun P, Guo G, Zhang R, Chen LM (2013). Association of the HLA-DQA1 and HLA-DQB1 Alleles in Type 2 Diabetes Mellitus and Diabetic Nephropathy in the Han Ethnicity of China. Journal of Diabetes Research. 5: 452537.
- [66] van Lunteren E, Moyer M (2013). Gene expression of sternohyoid and diaphragm muscles in type 2 diabetic rats. BMC Endocr Disord. 13(1):43.
- [67] Gaikwad AB, Sayyed SG, Lichtnekert J, Tikoo K, Anders HJ (2010). Renal Failure Increases Cardiac Histone H3 Acetylation, Dimethylation, and Phosphorylation and the Induction of Cardiomyopathy-Related Genes in Type 2 Diabetes. Am J Pathol. 176(3): 1079-83.
- [68] Bergthorsson U, Andersson DI, Roth JR (2007) Ohno’s dilemma: evolution of new genes under continuous selection. PNAS 104: 17004-9.
- [69] Lupski JR (1998) Genomic disorders: structural features of the genome can lead to DNA rearrangements and humandisease traits. Trends Genet 14: 417-422.
- [70] Kitano H (2007) A robustness-based approach to systems-oriented drug design. Nat Rev Drug Discov 6: 202-10.
- [71] strogatz SH (2001) Exploring complex networks. Nature 410: 268-276.
- [72] Cohen JD and Tong F (2001) The Face of Controversy. Science 293: 2405-2407.
- [73] Treves A (2005) Frontal latching networks: a possible neural basis for infinite recursion. Cognitive Neuropsychology 22, 276-291.
- [74] Ohtsuki H, Hauert C, Lieberman E and Nowak MA (2006) A simple rule for the evolution of cooperation on graphs and social networks. Nature 441: 502-505.
- [75] Sinha S (2005) Complexity vs. stability in small-world networks. Physica A: Statistical Mechanics and its Applications 346: 147–153.
- [76] Weidenmuller H A and Mitchell GE (2009) Random matrices and chaos in nuclear physics: nuclear structure. Rev Mod Phys 81: 539-589.
- [77] Guhr T, Muller A and Weidenmuller H A (1998) Random matrix theory in quantum physics: common concepts. Phys rep 299: 189-426.
- [78] Goh KI, Cusick ME, Valle D, Childs B, Vidal M (2007) The human disease network. PNAS 104: 8685-90.
- [79] Yildirim MA, Goh KI, Cusick ME, Barabási AL, Vidal M (2007) Drug-target network. Nat Biotechnol 25: 1119-26.
- [80] Woodcock J (2007) The Prospects for “Personalized Medicine” in Drug Development and Drug Therapy. Clin pharma Therap 81:164-169.
Supporting Information Legends
Supporting information file for the article “Interaction patterns in diabetes mellitus II network: An RMT relation”
-
Figure S1. Degree-CC Correlation. The degree-CC correlation for the normal (N-1 and N-2) and disease (D-1 and D-2) networks showing negetive correlation and following power law.
-
Figure S2. Nodes having CC-1. Degree distribution for the normal (N-1 and N-2) and disease (D-1 and D-2) datasets for nodes having CC=1.
-
Table S1. Biological functions. Functional description of proteins having CC=1.
-
The supplementary file also accompanies functional properties of other common proteins having CC=1, the top degree node in disease and normal state followed by top contributing nodes of disease networks achieved through the localization properties in detail.
Supporting Information
Relation between diabetes mellitus type II and obesity
Degree clustering correlation
Furthermore, the degree and CC of all the sub-networks of the normal as well as disease are negatively correlated (Figure.1) as found for other biological systems. [4]. he degree and CC of the normal and the disease networks are negatively correlated (Figure.1), as found in the case of other biological systems. This negative correlation indicates that the low degree nodes tend to form modules which are connected through the high degree nodes for proper functioning of a system [5].
![[Uncaptioned image]](/html/1410.2071/assets/x5.png)
![[Uncaptioned image]](/html/1410.2071/assets/x6.png)
Degree distribution of nodes having CC=1
Out of 72 proteins, the least degree a protein can have is two as all these proteins have indicating that they are part of atleast a lowest order clique of size three. There are 42 proteins have degree two. What follows that the lower degree proteins lying towards periphery should correspond to end product. Since all these nodes having have zero to close to zero betweenness centrality confirm that this indeed is the case of the these nodes and suggest that they are not involved in many pathways. Although there are many proteins which correspond to end products lying on the periphery of the network having degree one (Fig. 2), we concentrate here on those proteins which in addition to have less degree has property of having .
![[Uncaptioned image]](/html/1410.2071/assets/x7.png)
Functional properties of common proteins having CC=1
CTNNB1(Catenin(cadherin-associated protein), beta 1, 88kDa)- It is a part of WNT signaling pathway which plays important role in several processes like adipogenesis, fat production, strong activator of mitochondrial biogenesis, also leads to increased production of reactive oxygen species(ROS). This ROS-induced damage is significant because it can cause the development of acute hepatic insulin resistance, or injury induced insulin resistance. In diseased cells single nucleotide polymorphisms in β-cat/TCF lowers β-catenin levels which leads to the alteration or mutation of WNT signaling pathway make cells more susceptible to the development of T2D [6, 7, 8, 9, 10, 11].
Summary- This protein is involved in WNT signaling pathway, which has important role in increased production of reactive oxygen species(ROS) which leads to insulin resistance (main cause of T2D).
TGM2(Transglutaminase 2)- It is a multi-functional enzyme which catalyzes transamidation reactions or acts as a G-protein(guanosine nucleotide-binding protein) in intracellular signaling in normal cells. In disease cells lacking TGM2 makes them glucose intolerant and show impairment of insulin secretion, suggesting an important physiological role for TG2 in the pancreatic β cell [12].
Summary- This acts as a G-protein in intracellular signaling in normal cells. Mutation in this leads to abnormal insulin secretion and glucose intolerance.
SCARB2(Scavenger Receptor Class B, Member 2/ Lysosome membrane protein 2)- It is a class B scavenger receptor normally functions as membrane protein whose expression is prevalent in vascular lesions. Raised levels of glucose, insulin resistance, low HDL cholesterol, increased levels of free fatty acid (FFA) all result in increased expression of CD36, thereby contributing to T2D. Adipocytokines such as tumor necrosis factor-alpha (TNF-α), C-reactive protein (CRP), adiponectin, leptin, resistin along with peroxisome proliferator activated receptor-γ (PPAR-γ) are important mediators in glucose homeostasis in association with CD36 and can be used as markers for T2D and atherosclerosis. Several of these gene variants have shown association with lipid metabolism, T2DM and related complications [13].
Summary- It is a class B scavenger receptor, its increased expression leads to Raised levels of glucose, low HDL cholesterol, increased levels of free fatty acid (FFA), and insulin resistance.
TAGLN(Transgelin)– Expression level of this protein is up-regulated during obesity and leading T2D. A functional role of this protein is unclear. Two transcript variants encoding the same protein have been found for this gene [14, 15].
Summary- Expression level of this protein is up-regulated during obesity and leading T2D.
SPTBN2(Spectrin, Beta, Non-Erythrocytic 2 )- It is a component of Cell membrane-cytoskeleton and is composed of two alpha and two beta spectrin subunits. Also regulates the glutamate signaling pathway and insulin signaling. In diseased cells due to increased protein glycosylation it is responsible for membrane abnormalities and develop insulin resistance causing T2D
[16, 17].
Summary- This protein regulates the glutamate signaling pathway and insulin signaling. In diseased cells due to increased protein glycosylation it is responsible for membrane abnormalities and development of insulin resistance causing T2D.
VAPA(Vesicle-associated membrane protein-associated protein A)- It is present in the plasma membrane and intracellular vesicles. It is associated with the cytoskeleton, vesicle trafficking, membrane fusion, protein complex assembly and cell motility, and also acts as receptor in Calcium signaling toolkit in normal cells. In diseased cells its expression got decreased with -1.35 folds which directly affects cell adhesion and vascular complications in T2D. any alteration in Ca2+ signaling adversely effects on cell survival and insulin secretion leading T2D [18, 19].
Summary- This protein playes important role in insulin secretion as receptor in Calcium signaling toolkit, and alteration in expression affects insulin secretion.
PTPRN(Receptor-type tyrosine-protein phosphatase-like N)- It is involved in Ca2+ -regulated pathway as receptor in INS-1 cells which relates with glucose-induced exocytosis of insulin secretory granule (ISGs) in their biogenesis. Also regulate glucose stimulated β-cell proliferation. Destruction and dysfunction of the insulin-producing beta cells in the pancreas directly leads to T2D. And Deletion of PTPRN resulted in mild glucose intolerance and decreased glucose-responsive insulin secretion
[20, 21, 22, 23, 24].
Summary- In ca2+ regulated pathway and glucose stimuilated B-cell proliferation, dysfunctioning or deletion makes cells glucose intolerance and decreased glucose-responsive insulin secretion and leads to T2D.
PYCR1(Pyrroline-5-Carboxylate Reductase 1)- It catalyzes the NAD(P)H-dependent conversion of pyrroline-5-carboxylate to proline in normal cells. its upregulation in high glucose conditions leads to the development of various diabetic complications including cardiovascular diseases, dibetic nephropathy, and retinopathy through upregulating cytokines such as TNF-a, IL-1B, IL-6, and MCP-1 in monocytes, by the IFN-a pathway which leads to T2D
[25, 26, 27, 28, 29, 30, 31, 32, 33, 34, 35].
Summary- This protein catalyzes conversation of proline in normal cells, and upregulation in diseased cells leads to alteration of IFN-a pathway and ultimately to T2D.
OTUB1(Ubiquitin thioesterase OTUB1/otubain-1)- It interacts with another protien ubiquitin protease and an E3 ubiquitin ligase that inhibits cytokine gene transcription in the immune system. It participates in specific Ubiquitin- Proteasome pathway /complex, which has a major role in targeting cellular proteins for ATP dependent degradation by the 26S. Any alteration or change in this pathway makes cell more susceptible to T2D [36, 37, 38].
Summary- This protein interacts with ubiquitin protease and thus participate in Ubiquitin- Proteasome pathway, which playes major role in targeting cellular proteins for ATP dependent degradation by the 26S makes cell more susceptible to T2D.
SLC3A2(4F2 cell-surface antigen heavy chain)- In normal cells mainly functions for renal handling of citrat, oxidative metabolism, codes for 4F2 heavy chain (activator of dibasic and neutral amino acid transporters) and also involved in the transport of the bulky branched-chain amino acids which are very important in regulation of blood pressure and urine excretion and water re-absorption. 4F2hc can interact with GLUT1; such interaction promotes the stabilization of GLUT1 and contribute to the regulation of glucose metabolism. In diseased cells its expression gets upregulated and responsible for excessive urine excretion and alteration in SKG1 signaling pathway leading T2D [39, 40, 41, 42, 43, 45, 46, 44].
Summary- This protein mainly functions for renal handling, its increased expression leads to excessive urine excretion.
VDAC2(Voltage-dependent anion-selective channel protein 2 )- It is a Part of voltage dependent anion channel (VDAC) which playes important role in cellular energy regulation, mitochondrial cell apoptpsis in normal cells. And due to its functional importance it is directly associated with T2D and helps us in understanding of pathological conditions such as obesity and T2D
[47, 48, 49, 50, 51].
Summary- This protein is a part of voltage dependent anion channel (VDAC) which playes major role in cellular energy regulation, mitochondrial cell apoptpsis, and any alteration in functioning if this channel leads to obesity and T2D.
UCHL1(Ubiquitin Carboxyl-Terminal Esterase L1 (Ubiquitin Thiolesterase))- It is a thiol protease that hydrolyzes a peptide bond at the C-terminal glycine of ubiquitin, specifically expressed in the neurons and in cells of the diffuse neuroendocrine system in normal cells. It is an important component of the ubiquitin-proteasome system. It increases the available pool of ubiquitin to be tagged onto proteins destined to be degraded by the proteasome. In diseased cells Loss of Uchl1 increases the susceptibility of pancreatic beta-cells to programmed cell death, indicating that this protein plays a protective role in neuroendocrine cells and illustrating a link between T2D and neurodegenerative diseases. This gene is specifically expressed in the neurons and in cells of the diffuse neuroendocrine system. Mutation in this gene leads to T2D [52, 53, 54].
Summary- This protein is a Component of the ubiquitin-proteasome system, In diseased cells it increases the susceptibility of pancreatic beta-cells to programmed cell death, mutations in this gene leads to T2D.
| Protein | Function |
|---|---|
| ADAMTS9 | pancreatic beta cell dysfunction and decrease in insulin sensitivity. |
| NR2C2 | down-regulation leading to hypoglycaemia which is directly related to TYD |
| C6 | gluconeogenesisleads to deficiency in insulin sensitivity |
| G5A | involved in glycolysis pathway useful for glucose production |
| IGHA1 | immunoglobulin related to the functioning of pancreatic cells |
| C8A | gluconeogenis and in disease state leads to decrease insulin sensitivity |
| PIK3C2A | present in mitochondria and leads helps in energy transfer |
| AGER | involved in glycolytic pathway and in disease state it is down-regulated which leads to less insulin uptake in the body |
| NQO1 | is downregulated in obesity and as obesity is directly related to TYD it is directly involved. |
| FBLN1 | It is a marker for arterial extracellular matrix alterations in type 2 diabetes |
| CACNA1D | is downregulated in the disease state which is associated with calcium transport in the cell. |
| EKB | is a drug molecule associated with the growth factors of a cell and are associated with various cancers |
| SLC16A1 | alters lipid metabolism, most notably causing an increase in intracellular triacylglycerol levels. It has been targeted as a novel candidate protein for type 2 diabetes with a possible role in triacylglycerol metabolism. |
| CD59 | CD59 impairs complement regulation on erythrocytes leading to poor glycaemic control in diseased sate. |
HPRT1 ( hypoxanthine phosphoribosyltransferase 1)- Nucleotide salvage enzymes adenylosuccinate synthetase and adenylosuccinate lyase were elevated above normal in the diabetic heart, whereas hypoxanthine-guanine phosphoribosyl transferase was not altered [55].
Summary- Housekeeping function.
NME3 (nucleoside diphosphate kinase 3)- Major role in the synthesis of nucleoside triphosphates other than ATP. The ATP gamma phosphate is transferred to the NDP beta phosphate via a ping-pong mechanism, using a phosphorylated active-site intermediate. Probably has a role in normal hematopoiesis by inhibition of granulocyte differentiation and induction of apoptosisn [56].
Summary- It is not directly involved in diabetes mellitus II.
CbX3 (carbenoxolone 3) - It is shown to improve insulin sensitivity when dosed to healthy human. When it is dosed to lean type 2 diabeteic patient, improved insulin sensitivity, reduced glucose production and glycogenolysis were reported [57].
Summary- Involvement in insulin sensitivity, reduced glucose production and glycogenolysis.
Ddc (dopa decarboxylase)-It does not have a direct role in occuring DM-II. It is found to Catalyze the decarboxylation of L-3,4-dihydroxyphenylalanine (DOPA) to dopamine, L-5-hydroxytryptophan to serotonin and L-tryptophan to tryptamine [58].
Summary-It is not directly involved.
SERPINA3(Alpha 1-antichymotrypsin)- In normal cells Alpha 1-antichymotrypsin inhibits the activity of enzymes as proteases, cathepsin G that is found in neutrophils, and chymases. Also serum SERPINA3 levels were higher in T2D which leads to increase in permeability of retinal microvascular endothelial cells, which are involved in the pathogenesis of T2D and/or diabetic retinopathy. Also associated with acute renal allograft rejection [59, 60, 61, 62].
Summary- This inhibits the activity of enzyme like proteases in neutrophils, and upregulation of its expression level leads to increase in permeability of retinal microvascular leading T2D. And it is also associated with acute renal allograft rejection.
PSMC5(Proteasome (Prosome, Macropain) 26S Subunit, ATPase, 5)- In normal cells it is part of Ubiquitin- Proteasome complex which has a major role in targeting cellular proteins for ATP dependent degradation by the 26S. In diseased cells functioning of this complex is either less or absent in which primly leads to T2D [37, 38, 63].
Summary- This protein playes a major role in Ubiquitin- Proteasome complex which is involved in targeting cellular proteins for ATP dependent degradation by the 26S, downregulation of its expression leads to T2D.
ANPEP (alanine aminopeptidase):- In normal cells it is involved in the metabolism of regulatory peptides in renal tubular epithelial cells, and in diabetes is assumed as a primary biomarker due to its increased presence in urine due to Renal tubular dysfunction which leads to T2D or vice versa [64].
Summary- This protein acts as a biomarker due to increased concentration in urine due to renal/kidney dysfunction leading T2D.
PDE3B(Phosphodiesterase 3)- In normal cells it works in insulin secretion, insulin signaling pathway and fat metabolism. In diseased cells reduced expression of PDE3B in adipose tissue acts as primary event in the development of insulin resistance [65].
Summary- This protein playes important role in insulin resistance and insulin signaling pathway, reduced expression leads to T2D.
Functional properties of proteins denoted as top degree node in disease
UBB(Ubiquitin B)- It is our 1st top degree node in disease cell line D1 which scored degree of 112 among high degree nodes and bears 444 as its node index. This protein is one of the most conserved proteins known. In normal cell line it scores a degree 40 and bears 1458 as its index no.
In normal cells it is part of Ubiquitin- Proteasome complex which has a major role in targeting cellular proteins for ATP dependent degradation by the 26S. In diseased cells functioning of this complex is either less or absent in which directly leads to T2D
[37, 38].
INS (Insulin)-It is our 1st top degree node in disease cell line D2 which scored degree of 148 among high degree nodes and bears 60 as its node index. In normal cells it scores a degree 118 and bears 111 as its index no and also bears a position of 1st top degree node in normal cell line N3.
In normal cells Insulin functions in the normalization of the elevated blood glucose level. But in T2D cells are resistant of insulin and production of insulin gets decreased which directly leads to T2D [66].
Functional properties of proteins denoted as top degree node in normal
UBC(Ubiquitin C)- It is our 1st top degree node in normal cell line N1 which scored degree of 182 among high degree nodes and bears 1459 as its node index. This protein is one of the most conserved proteins known. In disease cell line it is absent.
In normal cells it is a part of Ubiquitin- Proteasome complex which has a major role in targeting cellular proteins for ATP dependent degradation by the 26S. In diseased cells functioning of this complex is either less or absent in which primly leads to T2D [37, 38].
ALB(Albumin)- It is our 2nd node in normal cell line N1 which scored degree of 148 among high degree nodes and bears 414 as its node index. In disease cell lines it has 146 and 79 degree in D1 and D2 respectively. It is as globular, negatively charged, water-soluble protein that is synthesized in the liver. In normal cells functions include maintaining osmotic pressure and transporting a variety of circulating molecules.
In diabetes it functions for the same but its production level get slightly elevated in T2D
[67, 68, 69].
CD4(cluster of differentiation 4)- It is our 3rd node in normal cell line N1 which scored degree of 121 among high degree nodes and bears 1883 as its node index. In disease cell line it is less functional or absent.
In normal cells it functions as a co-receptor that assists the T cell receptor (TCR) in communicating with an antigen-presenting cell. CD4 also interacts directly with MHC class II molecules on the surface of the antigen-presenting cell using its extracellular domain [70].
AKT1(alpha serine/threonine-protein kinas)- It is our 4th node in normal cell line N1 which scored degree of 108 among high degree nodes and bears 1440 as its node index. In disease cell line it has 309 as its index no.
This protein is named as RAC-alpha serine/threonine-protein kinase a sub unit of serine/threonine kinase AKT that plays a key in regulating cell survival, insulin signaling in normal cells. But alteration in its activation pathway directly leads to insulin resistance and leads to T2D [71, 72, 73].
UBA52(Ubiquitin A-52 Residue Ribosomal Protein Fusion Product 1)- It is our 1st top degree node in Normal cell line N2 which scored degree of 106 among high degree nodes and bears 604 as its node index. This protein is one of the most conserved proteins known. In disease cell line it scores a degree 86 and bears 282 as its index no.
In normal cells it is part of Ubiquitin- Proteasome complex which has a major role in targeting cellular proteins for ATP dependent degradation by the 26S. In diseased cells functioning of this complex is either less or absent in which primly leads to T2D. Sometimes Selective expression of UbA52 in the renal tubules suggests that the ubiquitin-proteasome proteolytic system is indeed operative in this compartment of the kidney and might play an important role in diabetic nephropathy. Its release in urine can potentially work as a diagnostic marker [37, 38, 74, 75].
TP53 or P53(Tumor protein p53)- It is our 2nd node in normal cell line N2 which scored degree of 105 among high degree nodes and bears 710 as its node index. In disease cell line it is absent.
In normal cell it encodes the tumor suppressor protein p53, which is known to be involved in cell-cycle control, apoptosis and maintenance of genetic stability, thereby protecting the organism from cellular damage. P53 is expressed in all tissues, but at very low levels under normal conditions [76, 77].
IL6(Interleukin-6)- It is our 2nd and last top degree node in Normal cell line N3 which scored degree of 111 among high degree nodes and bears 528 as its node index. In disease cell line it scores a degree 2 and bears 276 as its index no.
In normal cells it acts as a cytokine and not only involved in inflammation and infection responses but also in the regulation of metabolic, regenerative, signaling, and neural processes. Specific co-relation between T2D and IL-6 is not specified but increased serum levels of interleukin 6 (IL-6) are associated with increased risk of T2D and insulin resistance [78, 79, 80, 81].
Functional properties of disease proteins denoted as top contributing node (D1)
PFKL and PFKP(Phosphofructokinase, Liver and platelet)- In normal cells these are subunits of enzyme called PFK which has key activity in glycolytic pathway and insulin secretion. PFKL and PFKP are isoforms designated as M, P and L for muscle-, platelet-, and liver-type isoforms, respectively. Over expression of PFKL and increased activity of PFK is associated with altered insulin secretion and increased glycolysis rate [82, 83, 84, 85].
Summary- These protein participates in glycolytic pathway and insulin secretion, Their Over expression of leads to alteration in insulin secretion and glycolysis rate.
COL1A2 and COL3A1(Collagen alpha-2(I) chain and Collagen alpha-1(III) chain)- In normal cells encodes one of the chains for type I collagen, the fibrillar collagen found in most connective tissues, But in diseased cells due to decreased expressions leads to several heart and lungs related complications
[86, 87].
Summary- These proteins encodes chains for type I collagen in normal cells, But decreased expression levels leads to several heart and lungs related complications.
H3.3B AND H3F3B(Histone H3) - In normal cells functions in transcription regulation, DNA repair, DNA replication and chromosomal stability. In diseased cells due to some modifications and alteder expression levels leads to several heart and renal complications [88].
Summary- These proteins participates in transcription regulation, DNA repair, DNA replication and chromosomal stability. Altered expression levels leads to several heart and renal complications.
PSMD1, PSMD11, PSME1, PSMB8(26S proteasome non-ATPase regulatory subunit 1, 26S proteasome non-ATPase regulatory subunit 11, Proteasome activator complex subunit 1, Proteasome subunit beta type-8)- These all proteins are subunits of proteasome complex which participates in ubiquitin-proteasome pathway, which works in targeting cellular proteins for ATP dependent protein degradation by 26s. In diseased cells functioning of this complex is either less or absent which leads to obesity and T2D [89, 63, 2, 3, 37].
Summary- These proteins are involved in targeting cellular proteins for ATP dependent protein degradation by 26s. But less or absent expression levels leads to obesity and then T2D.
Functional properties of disease proteins denoted as top contributing node (D2)
AVPR2(Arginine vasopressin2)- It is a subunit of Arginine vasopressin (AVP) complex or anti-diuretic hormone, it act as receptor v2 which is responsible for stimulating water retention. Increased expression levels leads to cardio vascular complications, mortality and also limits glucose-induced water loss in T2D [90, 91, 92].
Summary- This protein act as receptor v2, which is responsible for stimulating water retention. Increased expression levels leads to cardio vascular complications, mortality and also limits glucose-induced water loss in T2D.
MT-ND5, MT-ND4, MT-ND1, MT-ND6- These are subunits of respiratory complex 1 (NADH: ubiquinone oxidoreductase) encoded by mitochondria. They participates in oxidative phosphorylation, ion exchange, cell signaling, insulin signaling and insulin resistance. Any alteration in mitochondrial genome leads to T2D
[93, 94, 95, 96, 97, 98, 99].
Summary- These proteins are involved in insulin signaling and insulin resistance. Alteration in any of these proteins genome leads to T2D.
MT-CO3(Mitochondrially Encoded Cytochrome C Oxidase III)- This protein functions as an enzyme complex which playes vital roles in body weight regulation, in diseased cells due to decreased expression levels leads to mitochondrial dysfunction, obesity, insulin resistance, and T2D
[100, 101, 102, 103, 104].
Summary- This protein functions as an enzyme complex which playes vital roles in body weight regulation, in diseased cells due to decreased expression levels leads to mitochondrial dysfunction, obesity, insulin resistance, and T2D.
SEL1L(Suppressor Of Lin-12-Like) and SELS/VIMP (Selenoprotein S/VCP-Interacting Membrane Protein)- They are ER(endoplasmic reticulum) membrane protein, which functions for retrotranslocation of misfolded proteins from the endoplasmic reticulum in normal cells, but in diseased cells a deficiency of SEL1L and SELS causes systemic ER stress leading retarded glucose-stimulated insulin secretion leading T2D
[105, 106].
Summary- These proteins functions in retrotranslocation of misfolded proteins, Their deficiency leads systemic ER stress leading retarded glucose-stimulated insulin secretion leading T2D.
CALM1, CALM2, CALM3(Calmodulin 1,2,3)- These are members of the EF-hand calcium-binding protein family (calmodulin) which plays vital role in Calcium/Calmodulin-Dependent Protein Kinase II pathway responsible in insulin signaling. Their decreased expression levels leads to insulin resistance and obesity causing T2D [107].
Summary- These proteins functions in Calcium/Calmodulin-Dependent Protein Kinase II pathway. Their decreased expression levels leads to insulin resistance and obesity causing T2D.
HLA-DQA1(Major Histocompatibility Complex, Class II, DQ Alpha 1)- It plays a central role in the immune system by presenting peptides derived from extracellular proteins. Class II molecules are expressed in antigen-presenting cells (APC: B lymphocytes, dendritic cells, macrophages). In diseased cells its increased expressions subsequently increases susceptibility for T2D [108, 109].
Summary- This protein plays important role in immune system, and in diseased cells its increased expressions subsequently increases susceptibility for T2D.
C1S(Complement Component 1, S Subcomponent)- It is a serine protease that combines with C1q and C1r to form C1. It plays an important role in the initiation of inflammatory process, in diseased cells Upregulation of C1s expression in adipose cells leads obesity and insulin resistant in T2D [110].
Summary- This protein is responsible for initiation of inflammatory process, upregulation in its expression leads to obesity and insulin resistant.
YWHAE(tyrosine 3-monooxygenase/tryptophan 5-monooxygenase activation protein, epsilon)- In normal cells it functions in signal transduction by binding to phosphoserine-containing proteins in insulin signaling and sensitivity, alteration in its expression levels leads to obesity and T2D [111].
Summary- This protein functions in signal transduction and alteration in expression levels causes defect in insulin secretion and sensitivity and obesity.
References
- [1] Fagot AC., Balkau B., Simon D., Warnet jmM, Claude JR et al. (1998). High free fatty acid concentration: an independent risk factor for hypertension in the Paris Prospective Study. Int J Epidemiol. 27: 808-813.
- [2] Mitropoulos KA, Miller GJ, Watts GF, Durrington PN (1992). Lipolysis of triglyceride-rich lipoproteins activates coagulant factor XII: a study in familial lipoprotein-lipase deficiency. Atherosclerosis. 95(2-3): 119-125.
- [3] Frayn KN, Williams CM, Arner P (1996). Are increasedplasma non-esterifiedfatty acid concentrations a risk marker for coronary heart disease and other chronic diseases. Clin Sci (Lond). 90(4):243-53.
- [4] Friedel CC, Zimmer R (2007) Influence of degree correlations on network structure and stability in protein-protein interaction networks. BMC Bioinformatics 8:297.
- [5] Barabasi AL, Oltvai ZN (2004) Network biology: understanding the cell’s functional organization. Nat Rev Genet 5: 101-13.
- [6] Zhai L, SW Ballinger, JL Messina (2011). Role of reactive oxygen species in injury-induced insulin resistance. Mol Endocrinol. 25(3):492-502.
- [7] Gaudio A, Privitera F, Battaglia K, Torrisi V, Sidoti MH, et al. (2012). Sclerostin Levels Associated with Inhibition of the Wnt /-Catenin Signaling and Reduced Bone Turnover in Type 2 Diabetes Mellitus. J Clin Endocrinol Metab. 97(10); 3744–3750.
- [8] Logan CY, Nusse R (2004). The Wnt signaling pathway in development and disease. Annu Rev Cell Dev Biol. 20:781-810.
- [9] Welters HJ, Kulkarni RN (2008). Wnt signaling: relevance to beta-cell biology and diabetes. Trends Endocrinol Metab. 19(10): 349–355.
- [10] Yoon JC, Ng A, Kim BH, Bianco A, Xavier RJ, et al. (2010). Wnt signaling regulates mitochondrial physiology and insulin sensitivity. Genes Dev. 24(14): 1507-18.
- [11] Grant SF, Thorleifsson G, Reynisdottir I, Benediktsson R, Manolescu A, et al. (2006). Variant of transcription factor 7-like 2 (TCF7L2) gene confers risk of type 2 diabetes. Nat Genet. 38(3):320-3.
- [12] Porzio O, Massa O, Cunsolo V, Colombo C, Malaponti M, et al. (2007). Missense mutations in the TGM2 gene encoding transglutaminase 2 are found in patients with early-onset type 2 diabetes. Hum Mutat. 28(11):1150.
- [13] Gautam S., Banerjee M (2011). The macrophage Ox-LDL receptor, CD36 and its association with type II diabetes mellitus. Mol. Genet. Metab. 102(4), 389–398.
- [14] Lee YH, Nair S, Rousseau E, Allison DB, Page GP, et al. (2005). Microarray profiling of isolated abdominal subcutaneous adipocytes from obese vs non-obese Pima Indians: increased expression of inflammation-related genes. Diabetologia. 48(9): 1776–1783
- [15] TAGLN transgelin. http://www.ncbi.nlm.nih.gov/gene. DOA:20/07/2014.
- [16] Burks DJ, Pons S, Towery H, Smith-Hall J, Myers MG Jr, et al. (1997). Heterologous Pleckstrin Homology Domains Do Not Couple IRS-1 to the Insulin Receptor. J. Biol. Chem. 272(44):27716-27721.
- [17] Schwartz RS, Madsen JW, Rybicki AC, Nagel RL (1991). Oxidation of Spectrin and Deformability Defects in Diabetic Erythrocytes. Diabetes. 40(6):701-708.
- [18] Kaviarasan S, Muniandy S, Qvist R, Ismail IS (2009). Gene Expression Profile in Leucocytes of Type 2 Diabetic Subjects. Biomedical Research. 20 (3): 158-165.
- [19] Shukla A, Priyadarshi S, Qamar I (2012). Involvement of Calcium and Vitamin C in Type 2 Diabetes. IOSR Journal of Pharmacy. 2, Issue 1:009-020.
- [20] Kampf C, Andersson AC1, Strömberg S, Bäckvall H, Uhlen M, et al. (2004). Antibody-based tissue profiling as a tool for clinical proteomics. J Histochem Cytochem. 54(12):1413-23.
- [21] Warford A, Howat W, McCafferty J (2004). Expression profiling by high-throughput immunohistochemistry. J Immunol Methods. 290:81–92.
- [22] Torii S, Saito N, Kawano A, Hou N, Ueki K, et al. (2009). Gene silencing of phogrin unveils its essential role in glucose-responsive pancreatic beta-cell growth. Diabetes. 58(3): 682–692.
- [23] Lindskog C, Korsgren O, Pontén F, Eriksson JW, Johansson L, et al. (2012). Novel pancreatic beta cell-specific proteins: Antibody-based proteomics for identification of new biomarker candidates. J Proteomics. 75(9):2611-20.
- [24] Saeki K, Zhu M, Kubosaki A, Xie J, Lan MS, et al. (2002). Targeted disruption of the protein tyrosine phosphatase-like molecule IA-2 results in alterations in glucose tolerance tests and insulin secretion. Diabetes. 51(6):1842–50.
- [25] Brownlee M (2001). Biochemistry and molecular cell biology of diabetic complications. Nature. 414(6865):813-20.
- [26] Brownlee M. (2005). The pathobiology of diabetic complications: a unifying mechanism. Diabetes. 54(6):1615-25.
- [27] Giaccari A, Sorice G, Muscogiuri G. (2009). Glucose toxicity: the leading actor in the pathogenesis and clinical history of type 2 diabetes – mechanisms and potentials for treatment. Nutr Metab Cardiovasc Dis. 19(5): 365–377.
- [28] Sheetz MJ, King GL (2002). Molecular understanding of hyperglycemia’s adverse effects for diabetic complications. JAMA. 288(20): 2579–2588.
- [29] Dasu MR, Devaraj S, Jialal I. (2007). High glucose induces IL-1beta expression in human monocytes: mechanistic insights. Am J Physiol Endocrinol Metab. 293(1): E337–E346.
- [30] Devaraj S, Venugopal SK, Singh U, Jialal I. (2005). Hyperglycemia induces monocytic release of interleukin-6 via induction of protein kinase c-alpha and -beta. Diabetes. 54(1): 85–91.
- [31] Guha M, Bai W, Nadler JL, Natarajan R. (2000). Molecular mechanisms of tumor necrosis factor alpha gene expression in monocytic cells via hyperglycemia-induced oxidant stress-dependent and -independent pathways. J Biol Chem. 275(23): 17728–17739.
- [32] Jain SK, Rains JL, Croad JL. (2007). High glucose and ketosis (acetoacetate) increases, and chromium niacinate decreases, IL-6, IL-8, and MCP-1 secretion and oxidative stress in U937 monocytes. Antioxid Redox Signal. 9(10): 1581–1590.
- [33] Miao F, Gonzalo IG, Lanting L, Natarajan R. (2004). In vivo chromatin remodeling events leading to inflammatory gene transcription under diabetic conditions. J Biol Chem. 279(17): 18091–18097.
- [34] Shanmugam N, Gaw Gonzalo IT, Natarajan R. (2004). Molecular mechanisms of high glucose-induced cyclooxygenase-2 expression in monocytes. Diabetes. 53(3): 795–802.
- [35] Shanmugam N, Reddy MA, Guha M, Natarajan R. (2003). High glucoseinduced expression of proinflammatory cytokine and chemokine genes in monocytic cells. Diabetes. 52(5): 1256–1264.
- [36] OTUB1 OTU domain, ubiquitin aldehyde binding 1. http://www.ncbi.nlm.nih.gov/gene. DOA 22/07/2014.
- [37] Costes S1, Huang CJ, Gurlo T, Daval M, Matveyenko AV, et al. (2011). β-Cell Dysfunctional ERAD/Ubiquitin/Proteasome System in Type 2 Diabetes Mediated by Islet Amyloid Polypeptide–Induced UCH-L1 Deficiency. Diabetes. 60(1):227-38.
- [38] Rubinsztein DC (2006). The roles of intracellular protein-degradation pathways in neurodegeneration. Nature. 443(7113):780-6.
- [39] Pajor AM, Sun N (1999). Protein kinase C-mediated regulation of the renal Na(+)/dicarboxylate cotransporter, NaDC-1. Biochim Biophys Acta. 1420(1-2): 223–230.
- [40] Ho HT, Ko BC, Cheung AK, Lam AK, Tam S, et al. (2007). Generation and characterization of sodium-dicarboxylate cotransporter-deficient mice. Kidney Int. 72(1):63-71.
- [41] Bergeron MJ, Burzle M, Kovacs G, Simonin A, Hediger MA (2011). Synthesis,maturation, and trafficking of human Na+-dicarboxylate cotransporter NaDC1 requires the chaperone activity of cyclophilin B. J Biol Chem. 286(13): 11242–11253.
- [42] Mastroberardino L, Spindler B, Pfeiffer R, Skelly PJ, Loffing J, Shoemaker CB, et al. (1998). Amino-acid transport by heterodimers of 4F2hc/CD98 and members of a permease family. Nature. 395(6699):288–291.
- [43] Meinild AK, Loo DD, Pajor AM, Zeuthen T, Wright EM (2000). Water transport by the renal Na(+)-dicarboxylate cotransporter. Am J Physiol Renal Physiol. 278(5): F777–783.
- [44] Ohno H, Nakatsu Y, Sakoda H, Kushiyama A, Ono H et al. (2011). 4F2hc stabilizes GLUT1 protein and increases glucose transport activity. Am J Physiol Cell Physiol. 300(5):C1047–C1054.
- [45] Willmes DM, Birkenfeld AL (2013). The Role of INDY in Metabolic Regulation. Comput Struct Biotechnol J. 6:e201303020.
- [46] Zhu L, Yu Q, Lin J, Zhang Q, Yang Q (2014). Cloning and functional analysis of goat glucose transporter 4. Mol Biol Rep. 41(2):757-68.
- [47] Turko IV, Murad F (2003). Quantitative Protein Profiling in Heart Mitochondria from Diabetic Rats. J Biol Chem. 278(37):35844-9.
- [48] Mostyn A, Pearce S, Stephenson T, Symonds ME (2004). Hormonal and nutritional regulation of adipose tissue mitochondrial development and function in the newborn. Exp Clin Endocrinol Diabetes. 112(1):2-9.
- [49] McCabe ER (1994). Microcompartmentation of energy metabolism at the outer mitochondrial membrane: role in diabetes mellitus and other diseases. J Bioenerg Biomembr. 26(3):317-325.
- [50] Shoshan-Barmatz V, Israelson A, Brdiczka D, Sheu SS (2006). The voltage dependent anion channel (VDAC): function in intracellular signalling, cell life and cell death. Curr Pharm Des. 12(18):2249-2270.
- [51] Lemasters JJ, Holmuhamedov E (2006). Voltage-dependent anion channel (VDAC) as mitochondrial governator - thinking outside the box. Biochim Biophys Acta. 1762(2):181-190.
- [52] Osaka H, Wang YL, Takada K, Takizawa S, Setsuie R et al. (2003). Ubiquitin carboxy-terminal hydrolase L1 binds to and stabilizes monoubiquitin in neuron. Hum Mol Genet. 12 (16): 1945–58.
- [53] UCHL1 ubiquitin carboxyl-terminal esterase L1 (ubiquitin thiolesterase). http://www.ncbi.nlm.nih.gov/gene. DOA:28/07/2014.
- [54] Chu KY, Li H, Wada K, Johnson JD (2012). Ubiquitin C-terminal hydrolase L1 is required for pancreatic beta cell survival and function in lipotoxic conditions. Diabetologia. 55 (1): 128–40.
- [55] Jenkins, R.L., McDaniel, H.G., Digerness, S., Parrish, S.W., Ong, R.L. (1988) Adenine nucleotide metabolism in hearts of diabetic rats. Comparison to diaphragm, liver, and kidney. Diabetes 37(5):629-36.
- [56] Venturelli D., Martinez R., Melotti P., Casella I., Peschle C. et al. (1995). Overexpression of DR-nm23, a protein encoded by a member of the nm23 gene family, inhibits granulocyte differentiation and induces apoptosis in 32Dc13 myeloid cells. Proc. Natl. Acad. Sci. U.S.A. 92(16) :7435-7439.
- [57] Jones R.M., Thurston D.E., Rotella D., Guccione S., Martinez A. (2012) New Therapeutic Strategies for Type 2 Diabetes: Small Molecule Approaches. Royal Society of Chemistry, Science:112-113.
- [58] Ichinose H, Kurosawa Y, Titani K, Fujita K and Nagatsu T. (1989) Isolation and characterization of a cDNA clone encoding human aromatic L-amino acid decarboxylase. Biochem Biophys Res Commun. 164(3):1024-30.
- [59] Kalsheker NA (1996). Alpha 1-antichymotrypsin. Int. J. Biochem. Int J Biochem Cell Biol. 28(9):961-4.
- [60] Klein R, Klein BEK, Moss SE, Cruickshanks KJ (1995). The Wisconsin epidemiologic study of diabetic retinopathy. Opthalmology. 102(1):7–16.
- [61] Goligorsky MS, Addabbo F, O’Riordan E (2007). Diagnostic potential of urine proteome: a broken mirror of renal diseases. J Am SocNephrol. 18(8): 2233-2239.
- [62] Wellcome Trust Case Control Consortium (2007). Genome-wide association study of 14,000 cases of seven common diseases and 3,000 shared controls. Nature. 447(7145):661-78.
- [63] Sakamoto K, Sato Y, Shinka T, Sei M, Nomura I et al. (2009). Proteasome subunits mRNA expressions correlate with male BMI; implications for a role in obesity. Obesity (Silver Spring). 17(5):1044-9.
- [64] Nikolov G, Boncheva M, Gruev T, Sefedin B, Taneva OS et al. (2013). Urinary Biomarkers In The Early Diagnosis Of Renal Damage In Diabetes Mellitus Patients. Scripta Scientifica Medica. 45:58-64.
- [65] Tang Y, Osawa H, Onuma H, Nishimiya T, Ochi M et al. (1990). Improvement in Insulin Resistance and theRestoration of Reduced Phosphodiesterase 3B GeneExpression by Pioglitazone in Adipose Tissue of Obese Diabetic KKAy Mice. DIABETES. 48(9):1830-5.
- [66] Chiu HK, Tsai EC, Juneja R, Stoever J, Brooks-Worrell B, et al. (2007). Equivalent insulin resistance in latent autoimmune diabetes in adults (LADA) and type 2 diabetic patients. Diabetes Res Clin Pract. 77(2):237-44.
- [67] Kelman L, Saunders SJ, Frith L, Wicht S, Corrigal A (1972). Effects of dietary protein restriction on albumin synthesis, albumin catabolism, and the plasma aminogram. Am J Clin Nutr. 25(11):1174-8.
- [68] Rothschild MA, Oratz M, Schreiber SS (1988). Serum albumin Hepatology. 8(2):385-401.
- [69] Mogensen CE, Christensen CK (1984). Predicting diabetic nephropathy in insulin dependent diabetic patients. N Engl J Med. 311(2):89–93.
- [70] Brady RL, Dodson EJ, Dodson GG, Lange G, Davis SJ et al. (1993). Crystal structure of domains 3 and 4 of rat CD4: relation to the NH2-terminal domains. Science. 260 (5110): 979–83.
- [71] Zdychová J, Komers R (2005). Emerging Role of Akt Kinase/Protein Kinase B Signaling in Pathophysiology of Diabetes and Its Complications. Physiol Res. 54(1):1-16.
- [72] Kim YB, Nikoulina SE, Ciaraldi TP, Henry RR, Kahn BB (1999). Normal insulin-dependent activation of Akt/protein kinase B, with diminished activation of phosphoinositide 3-kinase, in muscle in type 2 diabetes. J Clin Invest. 104(6):733–741.
- [73] Wang B, Raedschelders K, Shravah J, Hui Y, Safaei HG et al. (2011). Differences in myocardial PTEN expression and Akt signaling in type 2 diabetic and non-diabetic patients undergoing coronary bypass surgery. Clin Endocrinol (Oxf). 74(6):705-13.
- [74] Dihazi H, Müller GA, Lindner S, Meyer M, Asif AR et al. (2007). “Characterization of Diabetic Nephropathy by Urinary Proteomic Analysis: Identification of a Processed Ubiquitin Form as a Differentially Excreted Protein in Diabetic Nephropathy Patients”. Clin Chem. 53(9):1636-45.
- [75] Penescu M , Sisu I, Purcarea VL, Sisu E (2009). The Applications Of Mass Spectrometry For Identifying Modern Biochemical Markers Of Nephropathies. Farmacia. 57:667-680,6.
- [76] Ventura A, Kirsch DG, McLaughlin ME, Tuveson DA, Grimm J et al. (2007). Restoration of p53 function leads to tumour regression in vivo. Nature. 445(7128):661-5.
- [77] Burgdorf KS1, Grarup N, Justesen JM, Harder MN, Witte DR et al. (2011). Studies of the Association of Arg72Pro of Tumor Suppressor Protein p53 with Type 2 Diabetes in a Combined Analysis of 55,521 Europeans. PLoS One. 6(1):e15813.
- [78] Jürgen Scheller J, Chalaris A, Schmidt-Arras D, Rose-John S (2011). The pro- and anti-inflammatory properties of the cytokine interleukin-6. Biochim Biophys Acta. 1813(5):878-88.
- [79] Bastard JP, Jardel C, Bruckert E, Blondy P, Capeau J et al. (2000). Elevated levels ofinterleukin 6 are reduced in serum and subcutaneous adipose tissue of obese women after weight loss. J ClinEndocrinol Metab. 85(9):3338-42.
- [80] Kern PA, Ranganathan S, Li CL, Wood L, Ranganathan G (2001). Adipose tissue tumor necrosis factor and interleukin-6 expression in human obesity and insulin resistance. Am J Physiol Endocrinol Metab. 280(5):E745-51.
- [81] Fernandez-Real JM, Vayreda M, Richart C, Gutierrez C, Broch M et al. (2001). Circulating interleukin 6 levels, blood pressure, and insulin sensitivity in apparently healthy men and women. J Clin Endocrinol Metab. 86(3):1154-9.
- [82] Sweet IR, Matschinsky FM (1995). Mathematical model of 3-cell glucose metabolism and insulin release I. Glucosekinase as glucosensor hypothesis. Am J Physiol. 268(4 Pt 1):E775-88.
- [83] Dunaway GA, Kasten TP (1987). Nature of the subunits of the 6-phosphofructol kinase isoenzymes from rat tissues. Biochem J. 242(3):667-671.
- [84] Elson A, Bernstein Y, Degani H, Levanon D, Ben-Hur H et al. (1992). Gene dosage and Down’s syndrome: metabolic and enzymatic changes in PC12 cells overexpressing transfected human liver-type phosphofructokinase. Somat CellMol Genet. 18(2):143-161.
- [85] Elson A, Levanon D, Weiss Y, Groner Y (1994). Overexpression of liver-type phosphofructokinase (PFKL) in transgenic-PFKL mice: implication for gene dosage in trisomy 21. Biochem J. 299 ( Pt 2):409-15.
- [86] van Lunteren E, Moyer M (2013). Gene expression of sternohyoid and diaphragm muscles in type 2 diabetic rats. BMC Endocr Disord. 13(1):43.
- [87] van Lunteren E, Moyer M (2007). Oxidoreductase, morphogenesis, extracellular matrix and calcium ion binding gene expression in streptozotocin induced diabetic rat heart. Am J Physiol Endocrinol Metab. 293(3):E759-68.
- [88] Gaikwad AB, Sayyed SG, Lichtnekert J, Tikoo K, Anders HJ (2010). Renal Failure Increases Cardiac Histone H3 Acetylation, Dimethylation, and Phosphorylation and the Induction of Cardiomyopathy-Related Genes in Type 2 Diabetes. Am J Pathol. 176(3):1079-83.
- [89] Gomes AV (2013). Genetics of Proteasome Diseases. Scientifica (Cairo). 637629.
- [90] Riphagen IJ, Boertien WE, Alkhalaf A, Kleefstra N, Gansevoort RT et al. (2013). Copeptin, A Surrogate Marker For Arginine Vasopressin, Is Associated With Cardiovascular And All-Cause Mortality In Patients With Type 2 Diabetes (Zodiac-31). Diabetes Care. 36(10):3201-7.
- [91] Morgenthaler Ng (2010). “Copeptin: A Biomarker Of Cardiovascular And Renal Function”. Congest Heart Fail. 16 Suppl 1:S37-44.
- [92] Bankir L, Fernandes S, Bardoux P, Bouby N, Bichet Dg (2005). Vasopressin-V2 Receptor Stimulation Reduces Sodium Excretion In Healthy Humans. J Am Soc Nephrol. 16(7):1920–1928.
- [93] Pravenec M, Hyakukoku M, Houstek J, Zidek V, Landa V et al. (2007). Direct linkage of mitochondrial genome variation to risk factors for type 2 diabetes in conplastic strains. Genome Res. 17(9):1319-26.
- [94] Kaasik A, Veksler V, Boehm E, Novotova M, Minajeva A, et al. (2001). Energetic crosstalk between organelles. Circ Res. 89(2):153–159.
- [95] Hood D (2001). Plasticity in skeletal, cardiac, and smooth muscle: contractile activity-induced mitochondrial biogenesis in skeletal muscle. J Apple Physiol. 90:1137–1157.
- [96] Saltiel A (2000). Series introduction: the molecular and physiological basis of insulin resistance: emerging implications for metabolic and cardiovascular diseases. J Clin Invest. 106(2):163–169.
- [97] Sheperd P, Kahn B (1999). Glucose transporters and insulin action: implications for insulin resistance and diabetes mellitus. N Engl J Med. 341(4):248–257.
- [98] Shulman GI (2000). Cellular mechanisms of insulin resistance. J Clin Invest. 106(2):171–176.
- [99] Ritov VB, Menshikova EV, He J, Ferrell RE, Goodpaster BH et al. (2005). Deficiency of Subsarcolemmal Mitochondria in Obesity and Type 2 Diabetes. Diabetes. 54(1):8 –14.
- [100] Hutchison SK, Teede HJ, Rachon D, Harrison CL, Strauss BJ (2012). Effect of exercise training on insulin sensitivity, mitochondria and computed tomography muscle attenuation in overweight women with and without polycystic ovary syndrome. Diabetologia. 55(5): 1424–1434.
- [101] Gastaldi G, Russell A, Golay A, Giacobino JP, Habicht F (2007). Upregulation of peroxisome proliferator-activated receptor gamma coactivator gene (PGC1A) during weight loss is related to insulin sensitivity but not to energy expenditure. Diabetologia. 50(11): 2348–2355.
- [102] Short KR, Vittone JL, Bigelow ML, Proctor DN, Rizza RA (2003). Impact of aerobic exercise training on age-related changes in insulin sensitivity and muscle oxidative capacity. Diabetes. 52(8): 1888–1896.
- [103] Holmstrom MH, Iglesias-Gutierrez E, Zierath JR, Garcia-Roves PM (2012). Tissue-specific control of mitochondrial respiration in obesity-related insulin resistance and diabetes. Am J Physiol Endocrinol Metab. 302(6):E731-9.
- [104] Chung N, Kreutz T, Schiffer T, Opitz D, Hermann R (2012). Training induced alterations of skeletal muscle mitochondrial biogenesis proteins in non-insulin-dependent type 2 diabetic men. Can J Physiol Pharmacol. 90(12): 1634–1641.
- [105] Francisco AB, Singh R, Sha H, Yan X, Qi L et al. (2011). Haploid Insufficiency of Suppressor Enhancer Lin12 1-like (SEL1L) Protein Predisposes Mice to High Fat Diet-induced Hyperglycemia. J Biol Chem. 286(25):22275-22282.
- [106] Cox AJ, Lehtinen AB, Xu J, Langefeld CD, Freedman BI et al. (2013). Polymorphisms in the Selenoprotein S gene and subclinical cardiovascular disease in the Diabetes Heart Study. Acta Diabetol. 50(3): 391-399.
- [107] Ozcan L, Cristina de Souza J, Harari AA, Backs J, Olson EN et al. (2013). Activation of calcium/calmodulin-dependent protein kinase II in obesity mediates suppression of hepatic insulin signaling. Cell Metab. 18(6):803-15.
- [108] Ma ZJ, Sun P, Guo G, Zhang R, Chen LM (2013). Association of the HLA-DQA1 and HLA-DQB1 Alleles in Type 2 Diabetes Mellitus and Diabetic Nephropathy in the Han Ethnicity of China. Journal of Diabetes Research. 5(2013), 452537,.
- [109] HLA-DQA1 major histocompatibility complex, class II, DQ alpha 1. http://www.ncbi.nlm.nih.gov/gene DOA:30/07/2014.
- [110] Zhang J, Wright W, Bernlohr DA, Cushman SW, Chen X (2007). Alterations of the classic pathway of complement in adipose tissue of obesity and insulin resistance. Am J Physiol Endocrinol Metab. 292(5): E1433–E1440.
- [111] Adeyemo A, Gerry N, Chen G, Herbert A, Doumatey A et al. (2009). A Genome-Wide Association Study of Hypertension and Blood Pressure in African Americans. PLoS Genet. 5(7): e1000564.