Ag adatoms on Si(111)52-Au surface
1 Introduction
Gold-induced arrays of atomic chains on flat and vicinal (stepped) Si surfaces have attracted considerable interest in recent years due to possibility of accessing the phenomena characteristic of systems of a reduced dimensionality [1]. A chain structure on Si(111) surface is known as 52-Au reconstruction [2]-[4]. The unit cell of this reconstruction is 1.625 nm () wide and 0.768 nm () long. A macroscopically ordered surface with 52 reconstruction is observed at gold coverage equal to 0.6 monolayer (ML) [5]. One monolayer refers to the number of silicon atoms in Si double layer ( atoms/cm2).
The structural model of the Si(111)52-Au surface has recently been proposed by Erwin using density functional theory (DFT) [6]. A characteristic feature of this model is the Si honeycomb (HC) chain, present also in Au-induced chain structures on vicinal Si surfaces [7]-[10]. Besides this structure, there are other characteristic chains: single- and double-Au chains. In the double-Au chain, the gold atoms are dimerized, similar as in the case of the Si(553)-Au surface [10]. Moreover, the Si(111)-52-Au surface is decorated by Si adatoms, which appear in topography measured by scanning tunneling microscopy (STM) as bright protrusions (PBs) [11]-[13]. The BPs tend to form a half-filled 54 superlattice. This half-filling is reflected in parts of the surface with fully occupied 54 BP structure and empty segments between them, so the average occupation yields one Si adatom per 58 unit cell.
The Si adatoms play an important role in electronic properties of the surface. If the BP coverage is less than one Si adatom per 58 unit cell, the surface is metallic, while increasing the BP coverage, the surface undergoes a metal-insulator transition [14]. Furthermore, it was proven theoretically that the Si(111)52-Au surface is stabilized electronically [6, 15, 16]. It turns out that the system has a minimum of energy if doped by electrons equal to one electron per 52 unit cell, that corresponds exactly to a single Si adatom per 58 cell.
The scenario of electronic stabilization of the surface was further checked with Pb and In adatoms [16, 17]. In the case of Pb atoms, they adsorb in the Si-adatom positions, that results in an almost perfect 54 superlattice composed of Pb and Si adatoms. Moreover, the Pb atoms modify the electronic properties of the system in the same way as the Si adatoms. This was explained in terms of electron doping, since both Si and Pb belong to the same group of the periodic table, and have four valence electrons, they dope the surface equally [16]. On the other hand, indium has one valence electron less than Pb and Si, thus to dope the surface by the same number of electrons as in the case of Pb and Si, we need more In adsorption sites. Indeed, it turns out that In has two nonequivalent adsorption sites [17]. Similar, as in the case of Pb atoms, one of the adsorption sites is located in free Si-adatom positions. The other one is close to the Si adatoms, where In atoms form bonds with the Si adatoms. In the STM topography images, we deal with three kinds of BPs: the Si adatoms of a native Si(111)52-Au surface, the In adatoms in positions of the Si adatoms, and In atoms bound to the Si adatoms [17]. Interestingly, the In-Si structures were visible in the STM topography only at positive sample bias. In this case, it was not possible to fabricate a perfect 54 adatom superstructures, since In atoms preferred to bond to the Si adatoms rather than to fill the empty Si-adatom sites. Such a behavior of Pb and In adatoms supports the scenario of the electron doping and stabilization of the Si(111)52-Au surface. To shed additional light on the validity of this picture, we have chosen different material, namely silver, which has only one valence electron. If the above scenario is valid, we should expect more Ag adsorption sites, than in the case of Pb and In adatoms. Thus the purpose of the present study is to investigate Ag-induced reconstruction on Si(111)52-Au surface in submonolayer coverage of Ag and verify the above assumption.
Using scanning tunneling microscopy together with the first-principles density functional theory calculations we study structural properties of the Si(111)52-Au surface covered by Ag adatoms. The STM topography data show that a submonolayer coverage of Ag does not lead to a well-ordered adatom chain structure with a periodicity 54, as it was observed for Si, Pb and In adatoms. Instead of that, we observe Ag adatoms located in different nonequivalent positions within the unit cell, which confirms the electronic nature of stabilization of the Si(111)52-Au surface. Moreover, the DFT calculations give five different structural models of the Si(111)52-Au/Ag surface. All the models are almost degenerate in energy, which further supports the above scenario. The rest of the paper is organized as follows. In Secs. 2 and 3 details of experiment and of calculations are provided. The results STM and DFT investigations of the Si(111)52-Au structure covered by Ag adatoms are presented and discussed in Sec. 4. Section 5 contains the conclusions summarizing the results.
2 Experiment
The experimental setup consists of ultrahigh vacuum (UHV) chamber with a base pressure less than mbar equipped with scanning tunneling microscope (type OmicronVT) and reflection high energy electron diffraction (RHEED) apparatus. The Si(111) substrate used in the experiment was cut from a p-type B-doped sample with a resistivity 0.15 cm. The sample was cleaned by flashing several times up to 1500 K. The quality of surface reconstruction was monitored by RHEED technique. The 52 reconstruction was obtained by deposition of 0.6 ML of Au (in units of a half of Si(111) double layer), heating the sample at temperature 1100 K for 60 s and gradually cooling down to the room temperature (RT) for 5 min. Next 0.05 ML of Ag was evaporated onto the Si(111)52-Au surface held at the RT with a rate of 0.1 ML/min. The quartz-crystal monitor was used to determine both Au and Ag coverages. All the STM measurements were performed at the RT.
3 Details of calculations
The calculations have been performed in the local density approximation (LDA) [18] to DFT, as implemented in the SIESTA code [19]-[23]. Troullier-Martins norm-conserving pseudopotentials [24] have been used in calculations. In the case of Au and Ag pseudopotentials the semicore states 5 and 4, respectively, as well as the scalar relativistic corrections were included in the calculations. A basis set in the form of double- polarized (DZP) numerical atomic orbitals was used for all the atomic species [20, 21]. The radii of the orbitals for different species were following (in a.u): Au - 7.20 (), 6.50 () and 5.85 (), Ag - 5.75 (), 4.71 () and 6.20 (), Si - 7.96 (), 7.98 () and 4.49 (), and H - 7.55 () and 2.94 (). Eight nonequivalent points for Brillouin zone sampling and a real-space grid equivalent to a plane-wave cutoff 100 Ry were employed.
The Si(111)52-Au/Ag system has been modeled by four Si double layers and a vacuum region of 17 Å. All the atomic positions were relaxed until the maximum force in any direction was less than 0.04 eV/Å, except the Si atoms in the bottom layer, which were fixed at their bulk ideal positions and saturated by hydrogen. The lattice constant of Si was fixed at the calculated value, 5.39 Å. All the calculations have been performed in the 52 unit cell.
4 Results and discussion
As it was mentioned in Sec. 1, the main building blocks of that structure are HC, single- and double-Au chains. Furthermore, the surface is decorated by the Si adatoms, forming 54 superlattice. Thus in fact the structure has 54 periodicity. This model, albeit slightly simplified, was adapted here to study the adsorption of Ag atoms on the Si(111)52-Au surface. Namely, the present calculations have been limited to the 52 unit cell, neglecting the Si adatoms. We expect that with this simplification the results do not change significantly, and the difference might concern only the number of Ag adsorption sites. In the case of the original model, the number of Ag adsorption sites can increase due to larger unit cell (54) and asymmetry between neighboring 52 unit cells introduced by Si adatoms.
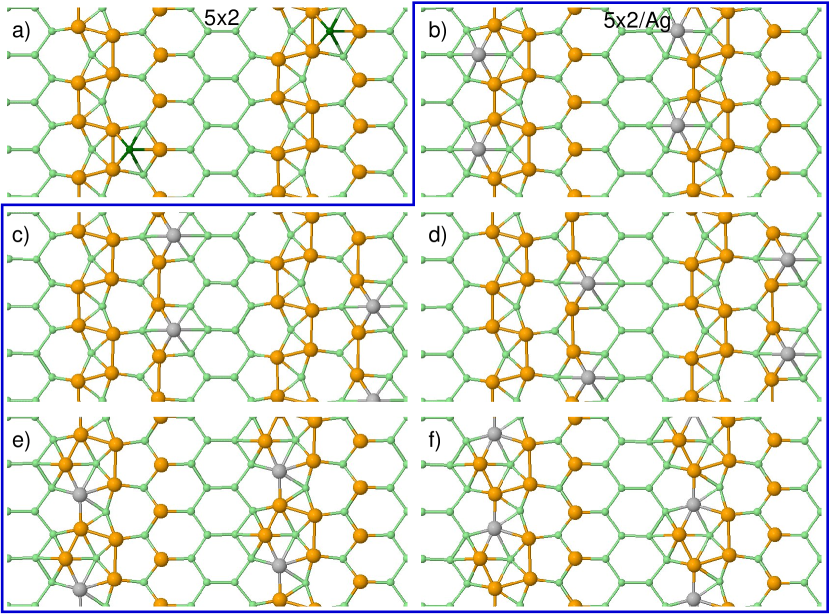
Five most stable structural models of the Si(111)52-Au/Ag surface are displayed in panels b)-f) of Fig. 1. As we can see, none of the models features Ag adatoms adsorbing in the Si-adatom positions neither in the Pb- nor in the In-adatom positions. The Si adatoms of the original Si(111)52-Au surface [panel a)] adsorb between single- and double-Au chains and are bound to the Au atoms of both chains. In the case of the double-Au chain, the Si adatoms make bonds with dimerized Au atoms. On the other hand, the Ag adatoms are bound only to one of the Au chains. The Ag adatoms in model shown in panel b) are bound only to the double-Au chain, while the Ag adatoms in models c) and d) - to the single-Au chain. The Ag adatoms of model b) are located on the opposite side of the double-Au chain than the Si adatoms. Furthermore, the Ag adatoms in this model are bound to two different Au dimers, rather than to the same dimmer, as it observed for Si adatoms. This is reflected in vertical position of Ag adatoms. Their -coordinates are by 0.66 Å lower with respect to the Si adatoms. It is worthwhile to note that the Ag adatoms in the model b) perturb the atomic arrangement of the surface very weakly, and the original surface remains almost intact. This is not the case in the remaining models. For example, the Ag adatoms bound to the single-Au chain [c) and d)] lead to the dimerization of Au atoms in that chain. However, this dimerization is weaker than in the double-Au chain. The distance between Au atoms of the same dimmer in the single-Au chain is equal to 3.42 Å, to be compared with 3.12 Å for the double-Au chain. Similar, the distance between Au atoms of different dimmers in single-Au (double-Au) chain yields 4.21 Å (4.51 Å). This yields the dimerization ratio for the single-Au chain, and for the double-Au chain. Similar, as in model b), the vertical positions of Ag adatoms are lower than that of Si adatoms, in this case by 0.41 Å. In models shown in panels e) and f) of Fig. 1, the modifications of the surface structure are even stronger. The Ag atoms substitute the Au atoms of the double chain. As a result, the substituted Au atoms are moved to the Ag adsorption sites of model b). However, the vertical positions of substituted Au atoms are by 0.26 Å lower than that of the Ag adatoms in model b). The lower values of vertical positions of Ag adatoms suggest that in STM topography images the apparent height of the Ag adatoms should be lower than of the Si adatoms, neglecting differences in electronic contributions to the STM signal.
All the models are almost degenerate in energy. The difference between the most stable model [panel b)] and the highest-energy model [panel f)] is as small as 68.9 meV per 52 unit cell. This suggests that all five structural models should be to an equal extent realized in experiment. Note that In atoms adsorb only in two different sites, while in the case of Pb adatoms there was only a single adsorption site. Furthermore, as it was mentioned already, none of the Ag-adatom positions is equivalent to the Pb nor to In adsorption sites. Comparing the number of adsorption sites of Pb, In and Ag atoms, and correlating it with corresponding number of valence electrons, we arrive at a conclusion that the fewer valence electrons exist in atoms of a given chemical element, the more adsorption sites available. Thus, this is a strong argument supporting the scenario of electronic stabilization of the surface.
To verify the above theoretical predictions, we have performed the STM measurements of the Si(111)52-Au surface covered by 0.05 ML of Ag. The STM topography images are shown in Fig. 2.
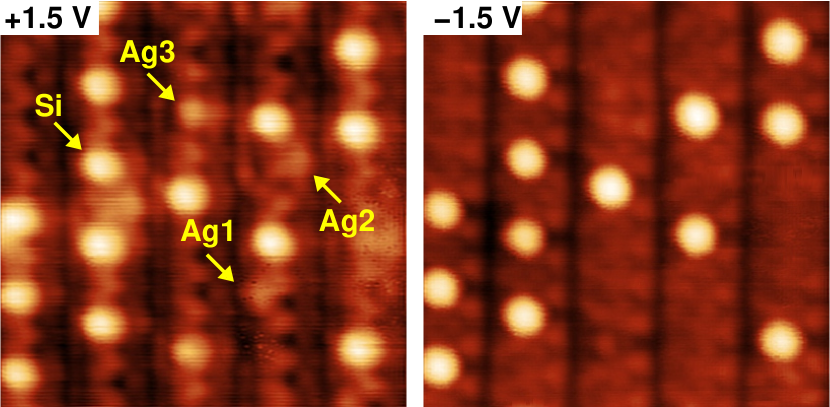
First of all, the Si adatoms are much better visible than the Ag adatoms (Ag1 to Ag3), confirming the DFT predictions. Furthermore, the Ag adatoms are located in different adsorption sites. Three nonequivalent sites are marked by Ag1 to Ag3. Comparing the positions of the Ag adatoms to the positions obtained by DFT calculations (Fig. 1), we can conclude that Ag1 corresponds either to the Ag adatom in the model b) or Au adatom in model e) or f). Unfortunately, further verification is impossible on the basis of the STM topography data, since the calculated positions of the Ag and Au adatoms are equivalent, and the apparent heights of all the Ag and Au adatoms are comparable. Note that in the case of In adatoms it was possible to distinguish them in scanning tunneling spectroscopy (STS) [17]. Here, however, the calculated densities of states (DOS) show rather small variations for adatoms in models b), e) and f). Thus the differences in DOS may not be resolved in the STS characteristics. A similar comparison between Fig. 1 and Fig. 2 indicates that the Ag2 adatom is the realization of the model c) or d). For the same reasons, a more detailed analysis is very tricky at present. Finally, we also observe Ag3 adatom located in the position, which is not reproduced in any of the models displayed in Fig. 1. The reason for that is likely due to neglecting the Si adatoms in present calculations. We expect this adsorption site to appear in calculations in complete Si(111)52-Au model of Ref. [6], as was discussed at the begging of this section.
The above STM topography results confirm the DFT predictions that the number of Ag adsorption sites should be higher than in the case of In and Pb adatoms. As it was discussed previously, such findings are required by the scenario of electronic stabilization of the Si(111)52-Au surface. Thus the behavior of Si, Pb, In and Ag adatoms altogether unambiguously proofs the realization of this scenario.
5 Conclusions
In conclusion, we have performed the STM and DFT study of the structural properties of the Si(111)52-Au surface covered by Ag adatoms. The DFT results predict the existence of five different adsorption sites. None of them is equivalent to any of the Si, Pb and In adsorption sites. The DFT predictions have been confirmed by the STM topography images, in which three different adsorption sites were revealed. Two of them are reproduced well by the present calculations. Furthermore, the Ag adatoms appear to be lower that the Si adatoms in the STM data, that allows for a clear distinction between them. The obtained results point to a significance of the electron doping and entirely confirm the picture of the electronic stabilization of the Si(111)52-Au surface
Acknowledgements
This work has been supported by the Polish Ministry of Education and Science under Grant No. N N202 330939.
References
- [1] P.C. Snijders, H.H. Weitering, Rev. Mod. Phys. 82 (2010) 307.
- [2] H.E. Bishop, J.C. Riviere, J. Phys. D 2 (1969) 1635.
- [3] H. Lipson, K.E. Singer, J. Phys. C 7 (1974) 12.
- [4] E. Bauer, Surf. Sci. Lett. 250 (1991) L379.
- [5] I. Barke, F. Zheng, S. Bockenhauer, K. Sell, V. v. Oeynhausen, K.H. Meiwes-Broer, S.C. Erwin, F.J. Himpsel, Phys. Rev. B 79 (2009) 155301.
- [6] S.C. Erwin, I. Barke, F.J. Himpsel, Phys. Rev. B 80 (2009) 155409.
- [7] J.N. Crain, J.L. McChesney, F. Zheng, M.C. Gallagher, P.C. Snijders, M. Bissen, C. Gundelach, S.C. Erwin, F.J. Himpsel, Phys. Rev. B 69 (2004) 125401.
- [8] M. Krawiec, Appl. Surf. Sci. 254 (2008) 4318.
- [9] D. Sánchez-Portal, R.M. Martin, Surf. Sci. 532-535 (2003) 655.
- [10] M. Krawiec, Phys. Rev. B 81 (2010) 115436.
- [11] Y. Yagi, K. Kakitani, A. Yoshimori, Surf. Sci. 356 (1996) 47.
- [12] T. Hasegawa, S. Hosoki, Phys. Rev. B 54 (1996) 10300.
- [13] A. Kirakosian, R. Benewitz, F.J. Himpsel, L.W. Bruch, Phys. Rev. B 67 (2003) 205412.
- [14] W.H. Choi, P.G. Kang, K.D. Ryang, H.W. Yeom, Phys. Rev. Lett. 100 (2008) 126801.
- [15] S.C. Erwin, Phys. Rev. Lett. 91 (2003) 206101.
- [16] A. Stȩpniak, M. Krawiec, G. Zawadzki, M. Jałochowski, J. Phys.: Condens. Matter 24 (2012) 095002.
- [17] A. Stȩpniak, P. Nita, M. Krawiec, M. Jałochowski, Phys. Rev. B 80 (2009) 125430.
- [18] J. P. Perdew, A. Zunnger, Phys. Rev. B 23, 5048 (1981).
- [19] P. Ordejon, E. Artacho, J.M. Soler, Phys. Rev. B 53, R10441 (1996).
- [20] D. Sanchez-Portal, P. Ordejon, E. Artacho, J.M. Soler, Int. J. Quantum Chem. 65, 453 (1997).
- [21] E. Artacho, D. Sanchez-Portal, P. Ordejon, A. Garcia, J.M. Soler, Phys. Status Solidi B 215, 809 (1999).
- [22] J.M. Soler, E. Artacho, J.D. Gale, A. Garcia, J. Junquera, P. Ordejon, D. Sanchez-Portal, J. Phys.: Condens. Matter 14, 2745 (2002).
- [23] E. Artacho, E. Anglada, O. Dieguez, J. D. Gale, A. Garcia, J. Junquera, R. M. Martin, P. Ordejon, J. M. Pruneda, D. Sanchez-Portal, J. M. Soler, J. Phys.: Condens. Matter 20, 064208 (2008).
- [24] N. Troullier, J. L. Martins, Phys. Rev. B 43, 1993 (1991).