Environmental dependence of galaxy age in the Main galaxy sample of SDSS DR10–LABEL:lastpage
Environmental dependence of galaxy age in the Main galaxy sample of SDSS DR10
Abstract
Using two volume-limited Main galaxy samples of the Sloan Digital Sky Survey Data Release 10 (SDSS DR10), I investigate the environmental dependence of galaxy age, and get the same conclusions in two volume-limited Main galaxy samples: old galaxies exist preferentially in the densest regions of the universe, while young galaxies are located preferentially in low density regions. Such an age-density relation is likely a combination of a strong age-stellar mass relation and the stellar mass-density relation.
keywords:
galaxies: fundamental parameters – galaxies: statistics – galaxies: general1 Introduction
Environmental dependence of galaxy parameters has been an important subject in the field of galaxy studies. Many galaxy parameters, such as galaxy luminosity, colour, morphological type, stellar mass and star formation rate (SFR), exhibit a strong correlation with galaxy environments (e.g., Postman & Geller 1984; Dressler et al. 1997; Hashimoto et al. 1998; Brown et al. 2000; Fasano et al. 2000; Norberg et al. 2001; Zehavi et al. 2002; Blanton et al. 2003, 2005; Gmez et al. 2003; Treu et al. 2003; Hogg et al. 2004; Kauffmann et al. 2004; Li et al. 2006; Zandivarez et al. 2006; Patel et al. 2009; Deng et al. 2007, 2008a-b, 2009, 2011a, 2012a-b). For example, Blanton et al. (2003) demonstrated that there is a strong correlation between luminosity and local density: the most luminous galaxies tend to reside in the densest regions of the Universe. Blanton et al. (2005) argued that galaxy colour is the galaxy property that is most predictive of the local environment. Patel et al. (2009) reported that the SFR and the specific star formation rate (SSFR, the star formation rate per unit stellar mass) at z 0.8 show a strong decrease with increasing local density, similar to the relation at z 0. Some studies focused on the environmental dependence of galaxy age, and concluded that galaxies in low-density environments are generally younger than galaxies in high-density environments (e.g. Bernardi et al. 1998; Trager et al. 2000; Kuntschner et al. 2002; Terlevich & Forbes 2002; Proctor et al. 2004; Mendes de Oliveira et al. 2005; Thomas et al. 2005; Gallazzi et al. 2006; Snchez-Blzquez et al. 2006; Sichenko 2006; Reed et al. 2007; Rakos et al. 2007; Wegner & Grogin 2008; Smith et al. 2012). For example, Proctor et al. (2004) and Mendes de Oliveira et al. (2005) reported that the member galaxies of compact groups are generally older than field galaxies. Thomas et al. (2005) found that massive early-type galaxies in low-density regions appear on average 2 Gyr younger than their counterparts in high-density regions. Such a conclusion is in good agreement with the current hierarchical assembly paradigm, which predicts a younger age of galaxies in lower density environments (e.g., Lanzoni et al. 2005; De Lucia et al. 2006). However, there also has been the dissenting standpoint. Kochanek et al. (2000) claimed that the stellar population age of galaxies does not depend on the environments.
In the SDSS, galaxy spectroscopic targets were selected by two algorithms. The Main galaxy sample (Strauss et al. 2002) contains galaxies brighter than =17.77(r-band apparent Petrosian magnitude), which is the largest and the most valuable galaxy sample in the local Universe. The primary goal of this study is to investigate the environmental dependence of galaxy age in this sample. The outline of this paper is as follows. Section 2 describes the data used. In section 3, I presents statistical results for the environmental dependence of galaxy age in the Main galaxy sample. My main results and conclusions are summarized in section 4.
In calculating the co-moving distance, I used a cosmological model with a matter density , cosmological constant , Hubble’s constant =100h km s-1 Mpc-1 with h=0.7.
2 Data
The tenth data release (DR10) (Ahn et al. 2014) of the SDSS-III is already available. In this work, the data of the Main galaxy sample was downloaded from the Catalog Archive Server of SDSS Data Release 10 (Ahn et al. 2014) by the SDSS SQL Search (http://www.sdss3.org/dr10/). In the SDSS, the target flags can be used to select out objects that were targeted for some particular reason. The Main galaxy targets have one of the LEGACY_TARGET1 bits "GALAXY", "GALAXY_BIG" and "GALAXY_BRIGHT_CORE" set (bits 6, 7 and 8). This corresponds to the requirement: LEGACY_TARGET1 & (64 128 256) 0. I extract 633172 Main galaxies with the redshift . The data set of age and stellar mass measurements is from the StellarMassStarFormingPort table obtained with the star-forming template and the Kroupa IMF (Maraston et al. 2013). I consider the mass lost via stellar evolution and use best-fit age of galaxy [in Gyr] and best-fit stellar mass [in log ].
Following Deng (2010), I construct a luminous volume-limited Main galaxy sample which contains 129515 galaxies at with and a faint volume-limited sample which contains 34573 galaxies at with . These two volume-limited Main galaxy samples are located in different redshift and luminosity ranges. The absolute magnitude is calculated from the r-band apparent Petrosian magnitude, using a polynomial fit formula (Park et al. 2005) for the mean K-correction within 0 z 0.3:
Deng (2010) argued that when studying the environmental dependence of galaxy properties, one needs to see the difference between the above-mentioned two galaxy samples.
3 Environmental dependence of galaxy age in the Main galaxy sample
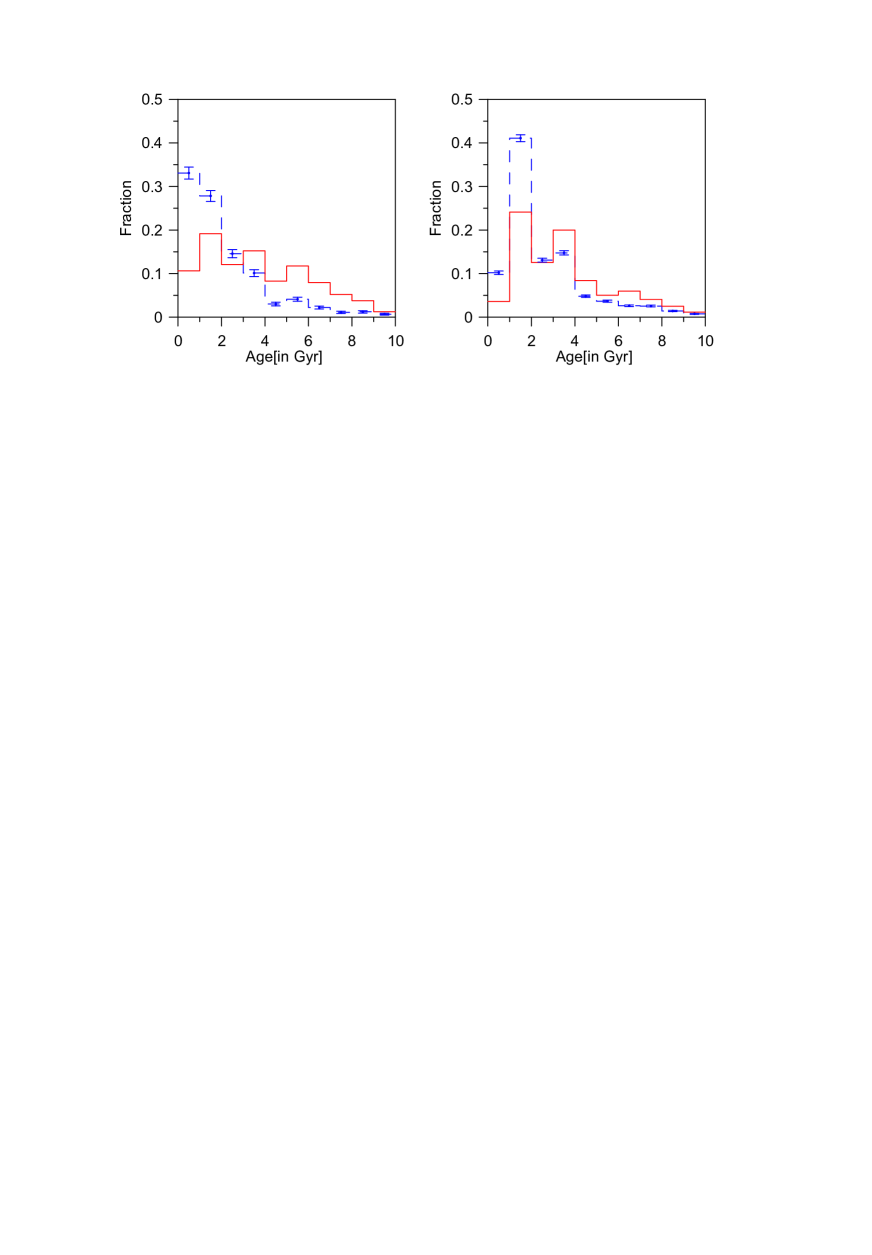
The local three-dimensional galaxy density (Galaxies Mpc-3 ) is defined as the number of galaxies (N=5) within the three-dimensional distance to the 5th nearest galaxy to the volume of the sphere with the radius of this distance. In previous works (e.g., Deng et al. 2008a, 2009; Deng 2010), such a density estimator was often applied. In this work, it is still used to characterize local galaxy environment. Like Deng et al. (2008a) did, for each sample, I arrange galaxies in a density order from the smallest to the largest, select approximately 5% of the galaxies, construct two subsamples at both extremes of density according to the density, and compare distribution of age in the lowest density regime with that in the densest regime.
Fig. 1 shows age distribution at both extremes of density for the faint (left panel) and luminous (right panel) volume-limited Main galaxy samples. As shown by this figure, in these two volume-limited Main galaxy samples, ages of galaxies strongly depend on local environments: old galaxies exist preferentially in the densest regions of the Universe, while young galaxies are located preferentially in low density regions. I further perform the Kolmogorov-Smirnov (KS) test. The probability of the two distributions in Fig. 1 coming from the same parent distribution is nearly 0, which shows that two independent distributions are significantly different in this figure. So, this statistical conclusion is robust.
There often are tight correlations between galaxy properties (e.g., Bower et al. 1992; Kennicutt 1992; Strateva et al. 2001; Blanton et al. 2003; Hopkins et al. 2003; Baldry et al. 2004; Balogh et al. 2004; Christlein et al. 2004; Kelm et al. 2005; Deng et al. 2008c, 2010; Bamford et al. 2009; Grützbauch et al. 2011a-b). For example, Kennicutt (1992) and Bamford et al. (2009) demonstrated that galaxy morphology is strongly correlated with the SFR and stellar mass. Deng et al. (2010) reported the correlation between star formation activities and the concentration index: passive galaxies are more luminous, redder, highly concentrated and preferentially ”early-type”. Grützbauch et al. (2011a) found that galaxy colour correlates strongly with stellar mass at 0.4 z 1. In this condition, the strong environmental dependence of a galaxy property is likely due to the environmental dependence of other galaxy properties and tight correlations between galaxy properties. Grützbauch et al. (2011b) argued that stellar mass is the most important factor in determining the colours of galaxies. Blanton et al. (2005) and Deng and Zou (2009) demonstrated that galaxy colour is the galaxy property very predictive of local environments. Thus, the strong environmental dependence of galaxy age is likely due to the environmental dependence of stellar mass and tight correlation between stellar mass and age.
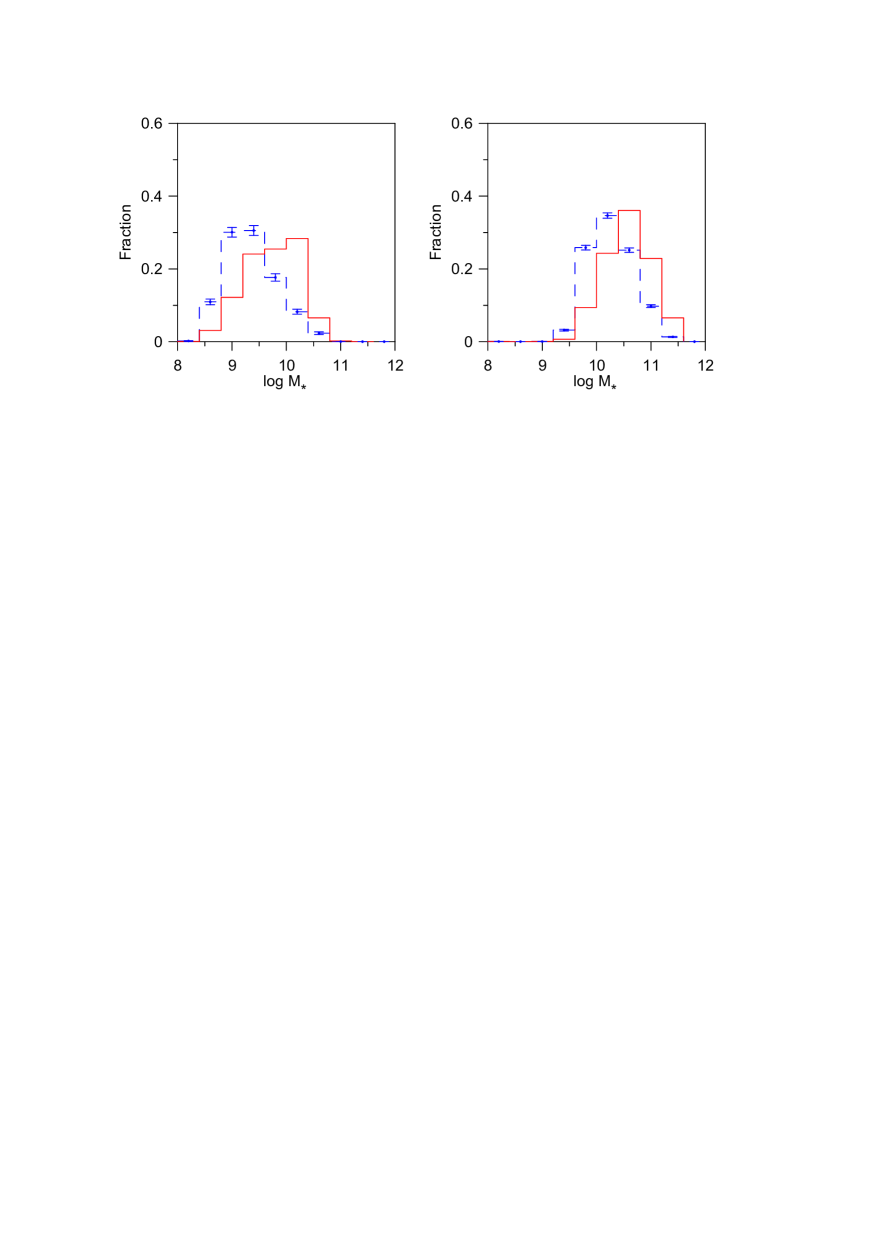
Some studies showed that there is a strong correlation between stellar mass and environment (e.g., Kauffmann et al. 2004; Li et al. 2006; Deng et al. 2011a). Fig. 2 shows stellar mass distribution at both extremes of density for the faint (left panel) and luminous (right panel) volume-limited Main galaxy samples. As shown by Fig. 2, in these two volume-limited Main galaxy samples, high mass galaxies exist preferentially in the densest regions of the Universe, while low mass galaxies are located preferentially in low density regions. The Kolmogorov-Smirnov (KS) test probability in this figure is also 0, which shows that stellar mass of galaxies indeed strongly depends on environments.
I examine average stellar mass as a function of age for the faint (left panel) and luminous (right panel) volume-limited Main galaxy samples. Fig. 3 shows that in these two volume-limited Main galaxy samples, average stellar mass of galaxies increases substantially with increasing age. This tight age-stellar mass relation and the stellar mass-density relation likely leads to the strong age-density relation.

Norberg et al. (2001) and Deng et al. (2009) demonstrated that the correlation between the galaxy luminosity and environment is fairly different between galaxies above and below the value of found for the overall Schechter fit to the galaxy luminosity function. Deng et al. (2009) noted that g-r color, concentration index ci and galaxy morphologies strongly depend on local environments for all galaxies with different luminosities, and concluded that is a characteristic parameter only for the environmental dependence of galaxy luminosity. Deng et al. (2012c) even found that is not an important characteristic parameter for the environmental dependence of the u-band luminosity. The u-band luminosity of galaxies still strongly depend on local environments in the faint volume-limited sample, like the one in the luminous volume-limited sample does. When investigating the environmental dependence of other galaxy properties, some works also demonstrated that there is no significant statistical difference between galaxies above and below the value of (e.g., Deng 2010; Deng et al. 2011b-c; Deng et al. 2013). In this work, as shown by Figs. 1-3, the same statistical conclusions can be arrived at from two volume-limited Main galaxy samples above and below the value of .
4 Summary
From the Main galaxy data of SDSS DR10, I construct two volume-limited samples with the luminosity and respectively, and explore the environmental dependence of galaxy age in these two volume-limited Main galaxy samples. I apply the three-dimensional density estimator within the distance to the 5th nearest neighbor, proceed with the same approach as used by Deng et al. (2008a), and compares distribution of age in the lowest density regime with that in the densest regime. Statistical analyses in two volume-limited Main galaxy samples can reach the same conclusions: old galaxies exist preferentially in the densest regions of the universe, while young galaxies are located preferentially in low density regions. Further investigation suggests that such an age-density relation is likely a combination of a strong age-stellar mass relation and the stellar mass-density relation.
References
- (1) Ahn C. P., Alexandroff R., Allende Prieto C., et al., 2014, ApJS, 211, 17
- (2) Baldry I. K., Glazebrook K., Brinkmann J., Ivezić z̆., Lupton R. H., Nichol R. C., Szalay A. S., 2004, ApJ, 600, 681
- (3) Balogh M. L., Baldry I. K., Nichol R., Miller C., Bower R., Glazebrook K., 2004, ApJ, 615, L101
- (4) Bamford S. P., Nichol R. C., Baldry I. K., et al., 2009, MNRAS, 393, 1324
- (5) Bernardi M., Renzini A., da Costa L., 1998, ApJ, 508, L143
- (6) Blanton M. R., Hogg D. W., Bahcall N. A., et al., 2003, ApJ, 594,186
- (7) Blanton M. R., Eisenstein D., Hogg D. W., Schlegel D. J., Brinkmann J., 2005, ApJ, 629,143
- (8) Bower R. G., Lucey J. R., Ellis R. S., 1992, MNRAS, 254, 601
- (9) Brown M. J. I., Webster R. L., Boyle B. J., 2000, MNRAS, 317, 782
- (10) Christlein D., McIntosh D. H., Zabludoff A. I., 2004, ApJ, 611, 795
- (11) De Lucia G., Springel V., White S. D. M., Croton D., Kauffmann G., 2006, MNRAS, 366, 499
- (12) Deng X. F., He J. Z., Jiang P., 2007, ApJ, 671, L101
- (13) Deng X. F., He J. Z., Song J., Wu P., Liao Q. H., 2008a, PASP, 120, 487
- (14) Deng X. F., He J. Z., Wu P., 2008b, A&A, 484, 355
- (15) Deng X. F., He J. Z., Luo C. H., Wu P., Xin Y., 2008c, Acta physica Polonica B,39,965
- (16) Deng X. F., He J. Z., Wen X. Q., 2009, MNRAS, 395, L90
- (17) Deng X. F., Zou S. Y., 2009, APh, 32, 129
- (18) Deng X. F., 2010, ApJ, 721, 809
- (19) Deng X. F., Yang B., He J. Z., Tang X. X., 2010, ApJ, 708, 101
- (20) Deng X. F., Chen Y. Q., Jiang P., 2011a, Chinese Journal of Physics, 49, 1137
- (21) Deng X. F., Xin Y., Luo C. H., Wu P., 2011b, Ap, 54, 355
- (22) Deng X. F., Chen Y. Q., Jiang P., 2011c, MNRAS, 417, 453
- (23) Deng X. F., Wu P., Qian X. X., Luo C. H., 2012a, PASJ, 64, 93
- (24) Deng X. F., Song J., Chen Y. Q., Jiang P., Ding Y. P., 2012b, ApJ, 753, 166
- (25) Deng X. F., Song J., Chen Y. Q., Jiang P., Ding Y. P., 2012c, AstL, 38, 213
- (26) Deng X. F., Luo C. H., Xin Y., Wu P., 2013, RMxAA, 49, 181
- (27) Dressler A., Oemler A. J., Couch W. J., et al., 1997, ApJ, 490, 577
- (28) Fasano G., Poggianti B. M., Couch W. J., Bettoni D., Kjærgaard P., Moles M., 2000, ApJ, 542, 673
- (29) Gallazzi A., Charlot S., Brinchmann J., White S. D. M., 2006, MNRAS, 370, 1106
- (30) Gmez P. L., Nichol R. C., Miller C. J., et al., 2003, ApJ, 584, 210
- (31) Grützbauch R., Conselice C. J., Varela J., Bundy K., Cooper M. C., Skibba R., Willmer C. N. A., 2011a, MNRAS, 411, 929
- (32) Grützbauch R., Chuter R. W., Conselice C. J., Bauer A. E., Bluck A. F. L., Buitrago F., Mortlock A., 2011b, MNRAS, 412, 2361
- (33) Hashimoto Y., Oemler A. J., Lin J. H., Tucker D. L., 1998, ApJ, 499, 589
- (34) Hogg D. W., Blanton M. R., Brinchmann J., et al., 2004, ApJ, 601, L29
- (35) Hopkins A. M., Miller C. J., Nichol R. C., et al., 2003, ApJ, 599, 971
- (36) Kauffmann G., White S. D. M., Heckman T. M., Ménard B., Brinchmann J., Charlot S., Tremonti C., Brinkmann J., 2004, MNRAS, 353, 713
- (37) Kelm B., Focardi P., Sorrentino G., 2005, A&A, 442, 117
- (38) Kennicutt R. C. Jr., 1992, ApJ, 388, 310
- (39) Kochanek C. S., Falco E. E., Impey C. D., et al., 2000, ApJ, 543, 131
- (40) Kuntschner H., Smith R. J., Colless M., Davies R. L., Kaldare R., Vazdekis A., 2002, MNRAS, 337, 172
- (41) Lanzoni B., Guiderdoni B., Mamon G. A., Devriendt J., Hatton S., 2005, MNRAS, 361, 369
- (42) Li C., Kauffmann G., Jing Y. P., White S. D. M., Börner G., Cheng F. Z., 2006, MNRAS, 368, 21
- (43) Maraston C., Pforr J., Henriques B. M., et al., 2013, MNRAS, 435, 2764
- (44) Mendes de Oliveira C., Coelho P., Gonzlez J. J., Barbuy B., 2005, ApJ, 130, 55
- (45) Norberg P., Baugh C. M., Hawkins E., et al., 2001, MNRAS, 328, 64
- (46) Park C., Choi Y. Y., Vogeley M. S., et al., 2005, ApJ, 633,11
- (47) Patel S. G., Holden B. P., Kelson D. D., Illingworth G. D., Franx M., 2009, ApJ, 705, L67
- (48) Postman M., Geller M. J., 1984, ApJ, 281, 95
- (49) Proctor R. N., Forbes D. A., Hau G. K. T., Beasley M. A., De Silva G. M., Contreras R., Terlevich A. I., 2004, MNRAS, 349, 1381
- (50) Rakos K., Schombert J., Odell A., 2007, ApJ, 658, 929
- (51) Reed D. S., Governato F., Quinn T., Stadel J., Lake G., 2007, MNRAS, 378, 777
- (52) Snchez-Blzquez P., Gorgas J., Cardiel N., González J. J., 2006, A&A, 457, 809
- (53) Sichenko O. K., 2006, ApJ, 641, 229
- (54) Smith R. J., Lucey J. R., Price J., Hudson M. J., Phillipps S., 2012, MNRAS, 419, 3167
- (55) Strateva I., Ivezic Z., Knapp G. R., et al., 2001, AJ, 122, 1861
- (56) Strauss M. A., Weinberg D. H., Lupton R. H., et al., 2002, AJ, 124, 1810
- (57) Terlevich A., Forbes D., 2002, MNRAS, 330, 547
- (58) Thomas D., Maraston C., Bender R., Mendes de Oliveira C., 2005, ApJ, 621, 673
- (59) Trager S. C., Faber S. M., Worthey G., González J. J., 2000, AJ, 120, 165
- (60) Treu T., Ellis R. S., Kneib J., Dressler A., Smail I., Czoske O., Oemler A., Natarajan P., 2003, ApJ, 591, 53
- (61) Wegner G., Grogin N. A., 2008, AJ, 136, 1
- (62) Zandivarez A., Martnez H. J., Merchn M. E., 2006, ApJ, 650, 137
- (63) Zehavi I., Blanton M. R., Frieman J. A., et al., 2002, ApJ, 571, 172
Acknowledgements
I thank the anonymous referee for providing many useful comments and suggestions. This study was supported by the National Natural Science Foundation of China (NSFC, Grant 11263005).
Funding for SDSS-III has been provided by the Alfred P. Sloan Foundation, the Participating Institutions, the National Science Foundation, and the U.S. Department of Energy.
The SDSS-III web site is http://www.sdss3.org/. SDSS-III is managed by the Astrophysical Research Consortium for the Participating Institutions of the SDSS-III Collaboration including the University of Arizona, the Brazilian Participation Group, Brookhaven National Laboratory, University of Cambridge, University of Florida, the French Participation Group, the German Participation Group, the Instituto de Astrofisica de Canarias, the Michigan State/Notre Dame/JINA Participation Group, Johns Hopkins University, Lawrence Berkeley National Laboratory, Max Planck Institute for Astrophysics, New Mexico State University, New York University, Ohio State University, Pennsylvania State University, University of Portsmouth, Princeton University, the Spanish Participation Group, University of Tokyo, University of Utah, Vanderbilt University, University of Virginia, University of Washington, and Yale University.