Tensile Fracture of Welded Polymer Interfaces: Miscibility, entanglements and crazing
Abstract
Large-scale molecular simulations are performed to investigate tensile failure of polymer interfaces as a function of welding time . Changes in the tensile stress, mode of failure and interfacial fracture energy are correlated to changes in the interfacial entanglements as determined from Primitive Path Analysis. Bulk polymers fail through craze formation, followed by craze breakdown through chain scission. At small welded interfaces are not strong enough to support craze formation and fail at small strains through chain pullout at the interface. Once chains have formed an average of about one entanglement across the interface, a stable craze is formed throughout the sample. The failure stress of the craze rises with welding time and the mode of craze breakdown changes from chain pullout to chain scission as the interface approaches bulk strength. The interfacial fracture energy is calculated by coupling the simulation results to a continuum fracture mechanics model. As in experiment, increases as before saturating at the average bulk fracture energy . As in previous simulations of shear strength, saturation coincides with the recovery of the bulk entanglement density. Before saturation, is proportional to the areal density of interfacial entanglements. Immiscibiltiy limits interdiffusion and thus suppresses entanglements at the interface. Even small degrees of immisciblity reduce interfacial entanglements enough that failure occurs by chain pullout and .
Johns Hopkins University]Department of Physics and Astronomy, Johns Hopkins University, Baltimore, MD 21218 USA \alsoaffiliation[University of North Carolina]Department of Chemistry, University of North Carolina, Chapel Hill, NC 27599-3290, USA Sandia National Laboratories]Sandia National Laboratories, Albuquerque, NM 87185 USA Johns Hopkins University]Department of Physics and Astronomy, Johns Hopkins University, Baltimore, MD 21218 USA
![[Uncaptioned image]](/html/1410.1917/assets/x1.png)
***For Table of Contents Use Only***
Title: Tensile Fracture of Welded Polymer Interfaces:
Miscibility, entanglements and crazing
Authors: Ting Ge, Gary S. Grest and Mark O. Robbins
1 1 Introduction
The strength of polymer-polymer interfaces has great importance in the application of polymers as adhesives, coating materials and structural components 1, 2, 3. Ideally the interface should be as strong as the surrounding bulk material so that it does not initiate failure. One common means of strengthening polymer interfaces is thermal welding 1. The interface is heated above the glass transition temperature so that polymers can diffuse across the interface. While polymers must diffuse by a distance on the order of their radius of gyration for all memory of the interface to be erased, experiments 1, 4, 5 and simulations 6, 7 have shown that bulk strength is recovered at much earlier times.
There has been great interest in understanding the evolution of interfacial strength with interdiffusion time and its connection to interfacial structure 8, 4, 9, 10, 11, 12, 13, 14, 15, 16, 17, 5, 6, 18. Experiments 8, 4, 9 have found a correlation between the mechanical strength and the interfacial width. For homopolymers, the growth of interfacial width with time has been explained using reptation theory 10, 11, 12, 13, 14, 15, 16. For immiscible polymers, the free energy cost of mixing limits interdiffusion, causing both the interfacial width and strength to saturate 19, 20, 17. Theories have interpreted the growth of strength with time in terms of entanglements 10, 11, 12, 13, 14, 15, 16, 17, but experiments can not directly image entanglements to test these predictions.
In recent work we have used simulations to follow the evolution of the shear strength of interfaces between miscible 6 and immiscible polymers 18. The maximum shear stress before failure was evaluated using a geometry that mimics a lap-joint shear experiment 21, 22, 23, 24. As in experiments 21, we found that rose with welding time as and saturated long before polymers had diffused by their radius of gyration. In contrast to experiments, simulations allowed direct observations of the evolution of topological constraints (TCs) associated with entanglements. The shear strength rose linearly with the areal density of interfacial entanglements between polymers that started on opposite sides of the interface. Homopolymers achieved bulk strength when they had interdiffused enough to produce roughly two TCs per chain. This was sufficient to prevent chain pullout at the interface and led to failure through chain scission, as in the bulk. Even a small degree of immiscibility prevented interfacial entanglements, resulting in weak interfaces that failed through chain pullout.
In many applications polymer interfaces are under tensile loading and the ultimate mechanical strength of the whole system containing them is determined by their interfacial fracture energy 1, 2, 3. The fracture energy is the amount of external work per unit area required to propagate a crack across the interface 2. It represents an integral of the stress times displacement and rises both with the peak tensile stress and the total deformation of the system. A lower bound for is the free energy change , where is the interfacial free energy. Common methods of measuring include the double cantilever beam experiment and T-peel test 1, 8, 4, 9, 17. Experiments on homopolymer interfaces 10 show that grows as , which is proportional to the interfacial width, before saturating at the bulk fracture energy .
The bulk fracture energy of glassy polymers is typically thousands of times larger than . This increase is not due to a large increase in the peak tensile stress, but rather because a large volume around the crack tip is deformed into a network of fibrils and voids called a craze 2, 25, 26, 27, 28. The density of craze is lower than that of the bulk glass by the extension ratio . In most cases correlates to the entanglement molecular weight of the polymer and is insensitive to temperature, strain rate and other conditions 25, 26, 27, 28, 2. Formation of the craze occurs by drawing fibrils out of the bulk polymer at a constant plateau stress . These oriented fibrils are then strong enough to resist further deformation. Brown 29 developed a fracture mechanics model for in terms of , and the ultimate failure strength of fully developed crazes . Rottler et al.30 later used molecular dynamics (MD) simulations to determine the inputs to Brown’s model. Their results capture many aspects of craze formation, including the large fracture energies of bulk polymers.
In this paper we use simulations to study the tensile strength of the interfaces between miscible and immiscible homopolymers whose shear strength was studied in Refs. 6 and 18. For miscible polymers at small times, and for the immiscible interfaces studied here, the interface separates easily and chains are pulled back to their initial side of the interface with a small interfacial fracture energy. The fracture energy begins to rise rapidly when the interface is strong enough to allow formation of a stable craze over a large volume. This coincides with formation of the first TCs of polymers with polymers on the opposing side and occurs long before there is a significant increase in the peak shear or tensile stress. Brown’s theory is used to determine , which grows as for miscible polymers. Final saturation of strength occurs when interdiffusion has restored the entanglement density near the interface to its bulk value. This saturation occurs at the same time as the saturation of shear strength 6. While only increases by a factor of 2 or 3 during welding, increases by more than two orders of magnitude because of the large increase in craze volume. As in studies of shear strength18, interfaces between immiscible polymers are weaker because their finite equilibrium width suppresses entanglements. The equilibrium fracture energy is comparable to that of homopolymers at welding times that produce the same density of interfacial entanglements.
The following section describes the simulation geometry and method for determining fracture energy. In Section 3, results are presented first for miscible polymers and then for the immiscible case. The final section presents a summary and conclusions.
2 2 Simulation Model and Methodology
The potential models and welded states were the same as in Refs.6, 7 and 18 where further details of their preparation can be found. All of the simulations employed the canonical bead-spring model 31 that captures the properties of linear homopolymers. The van der Waals interactions between spherical monomers of mass are modeled using the standard Lennard-Jones (LJ) potential with interaction energy , monomer diameter and characteristic time . The potential was truncated and shifted to zero at monomer separation or . To model immiscible films, the interaction strength between unlike monomers was reduced to . Four systems with , , and were simulated.
Chains of length beads were made by connecting nearest-neighbors using an additional bonding potential. Melt simulations were performed with the usual unbreakable finitely extensible nonlinear elastic (FENE) bonding potential31. A simple quartic potential with the same equilibrium spacing was used in the mechanical tests since chain scission plays an essential role in failure. As in past simulations 6, 18, 7, 30, 32, the breaking force for the quartic potential, , is 100 times higher than that for the intermolecular LJ potential. This ratio is consistent with experimental estimates 33, 34, 7. Previous work has shown that the entanglement length for this model is and that the mechanical response for is characteristic of highly entangled (large ) polymers 30, 35, 36, 37, 38, 7.
There is no precise mapping of our coarse-grained model to any specific polymer, but approximate mappings give MPa and mJ/m2 for the units of stress and fracture energy, respectively 7. The interfacial energy of the polymer-vacuum interface is mJ/m2 with a weak dependence on temperature 39, 40. The fracture energy must exceed the free energy associated with the two interfaces created, .
Fluid films of each polymer species were equilibrated separately at temperature with . Each film contains chains or in total million beads. Periodic boundary conditions were applied along the - and -directions with dimensions and , while featureless walls separated by confined films in the non-periodic - direction. Equilibrated films were placed in contact and allowed to interdiffuse for a time at . The system was then quenched rapidly to , which is below the glass temperature 41. Glass simulations are done with to reduce the difference between melt and glass densities, and thus changes in chain conformation42. This also facilitates comparison with previous mechanical studies 30, 35, 36, 37, 38. The cutoff radius was reduced to prior to quenching. The system was then quenched at constant volume with a rate to where the pressure . Subsequently, the temperature was further quenched to at and .
Entanglements in all quenched states were identified using the Primitive Path Analysis (PPA) algorithm 43, which has provided unique information about the average spacing between entanglements both in a polymer melt at equilibrium 43 and during the recovery of the entanglement network from a non-equilibrium situation 44. During PPA, chain ends are frozen and tensile forces are introduced to minimize the contour length without allowing chain crossing. To limit excluded volume effects, we use a modification of the original PPA algorithm where the diameter of repulsive interactions between chains is then reduced by a factor of four and the contour is minimized again 45, 6, 18. The resulting configuration is a network of primitive paths for each chain.
As in previous studies 45, 46, 47, 6, 18, we identified the interchain contacts between primitive paths as topological constraints (TCs) associated with entanglements. The spacing between TCs is typically 2 to 3 times smaller 46, 47 than the entanglement length, which is defined as the Kuhn length of the primitive path. The reason is that several contacts with primitive paths of other chains are needed to randomize the direction. Recent studies of entangled polymer melts 48 and craze formation 49 also show that unlike TCs, entanglements are not associated with specific pairs of chains. However, all of the past work has found that the densities of TCs and entanglements are proportional to each other. Refs. 6 and 18 describe the evolution of the ratio of the local density of TCs to the bulk density. This is equivalent to the evolution of the entanglement density and we will refer to these results below. We also present new measures of the evolution of TCs that are related to the onset of interfacial craze formation.
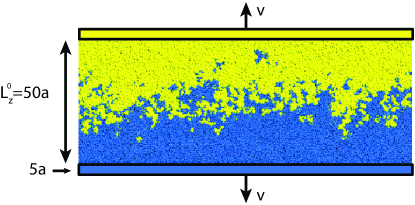
To perform tensile tests that isolate the effect of the interface 7 we apply strain to a region of height centered on the initial interface. Layers of width above and below this region are held rigid and displaced at constant velocity in opposite directions along the axis. Our simulation protocol is schematically illustrated in Figure 1. The deformation is characterized by the stretch factor along the axis , where is the growing separation between the top and bottom rigid layers. The periodic boundary conditions along and directions are not changed. The temperature is maintained at by applying a Langevin thermostat with damping rate to the peculiar velocities in and directions.
Tests with different , , , and gave similar results. As discussed in Ref. 7, the rigid walls screen the stress on regions separated by more than along the x-y plane. Thus the data for different regions along are independent and the total stress from a single run is effectively an ensemble average over roughly 14 regions. Previous simulations 36, 40 showed that simulations of craze formation should be done at constant widening velocity rather than constant true strain rate because deformation is localized to an active zone of fixed width at the edge of the craze. Rottler and Robbins 36 examined the velocity dependence of the plateau stress during craze formation and found a weak, logarithmic variation for .
To obtain the average tensile response of bulk samples with chain length , we let one polymer film evolve at constant temperature and constant volume. We then selected six states at times separated by equal intervals, , for mechanical testing. Simulation protocols for quenching and tensile tests on these bulk samples were identical to those for polymer interfaces.
3 3 Results
3.1 3.1 Fully Miscible Interface
3.1.1 3.1.1 Evolution of Stress and Failure Mechanism
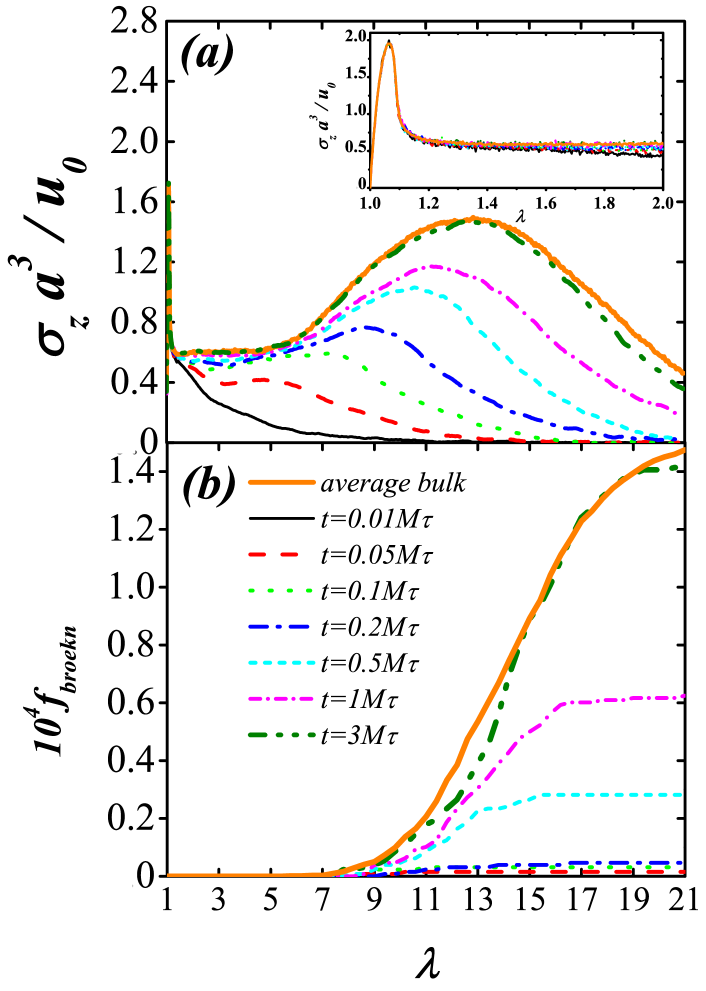
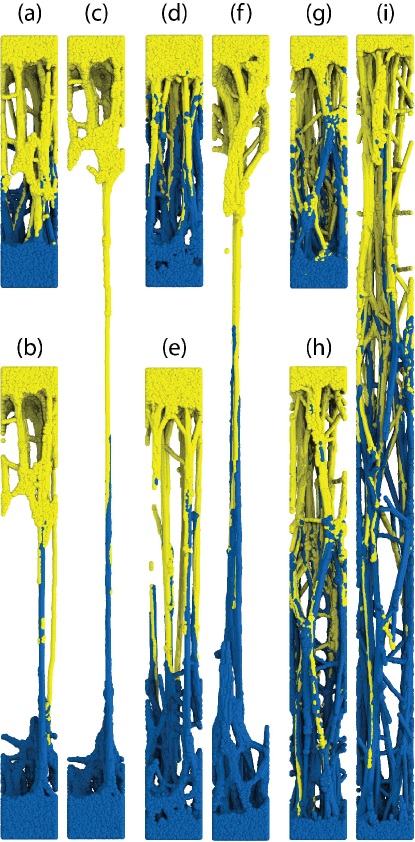
Figure 2(a) shows the tensile stress as a function of the stretch factor for interfaces between fully miscible chains at the indicated interdiffusion times . A million is abbreviated as 1M and the average result for bulk films is shown for comparison.
As shown in the inset of Fig.2(a), for the stress curves show a linear elastic region followed by a peak and sharp drop, indicating the start of cavitation. The similarity between the curves for different confirms that cavitation is controlled by the local structure and stress state 2, 36, which is nearly identical for all and the bulk. A consequence is that cavitation and subsequent craze nucleation can occur at places away from the interface. However, because of the thin film geometry in our simulations, the results mainly reflect the effects of the interface on the fracture process. In experiment, examining purely interfacial fracture is challenging. Special techniques are usually required to confine the fracture process as near to the interface as possible 1, 8, 4.
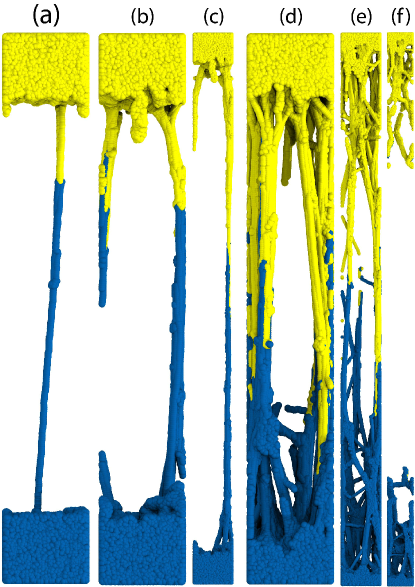
Changes in the mechanical response become evident after cavitation (). For , drops to zero without a clear stress plateau, indicating that the system fails without forming a stable craze. As shown in Fig. 2(b), for these states there are almost no broken bonds during the whole process. Instead, the interface fails through chain pullout. Figures 3(a)-(f) illustrate the evolution of systems at and upon stretching to , and . These snapshots show that a few fibrils can form across the interface, but quickly fail through pullout. In the final state (not shown) all monomers are on the side they started from before interdiffusion.
For , there is a pronounced plateau in at the average bulk plateau stress . This indicates that a stable craze has formed and grows steadily through the interfacial region 27, 28, 36. Figure 3(g) illustrates the structure of the craze, an intricate network of fibrils and voids. The density of the craze is lower than the initial density by the same extension ratio that is found for bulk samples 36, 7, 49. The stress plateau ends when all the material between the two rigid layers, except regions within a distance on the order of the tube diameter from the rigid layers, has been transformed into craze. Because of these uncrazed regions, the plateau ends at a value of that is smaller than . Figure 2(b) shows that there is no bond breaking during craze formation.
Upon further stretching of the fully developed craze, rises above and reaches a maximum stress before the ultimate breakdown of the craze. For , is close to , but rises rapidly as increases. The failure mechanism of craze fibrils also changes from chain pullout to chain scission. For and , only a few bonds break. For , significant bond breaking is observed. The peak rate of bond breaking and the final fraction of broken bonds increase with . In each case, the rate of bond breaking begins to drop near the point where reaches . Deformation of the craze in this range of times is illustrated by Figures 3(h) and (i) for . Snapshot (h) shows the structure at , where the entire system is stretched into a uniform craze without significant bond breaking. Snapshot (i) shows the same interfacial craze at , where the ultimate breakdown has started. Note that chains from the two opposite sides remain mixed rather than being pulled out to their initial sides, as for small . Around , the rate of bond breaking and the entire stress curve become statistically indistinguishable from the bulk result.
3.1.2 3.1.2 Correlating Failure Mechanisms to Entanglements
In the previous section we identified several characteristic times where the mechanical response changes. There is an onset of stable craze formation at M, a transition from chain pullout to chain scission at M and a saturation at the bulk response for M. As in our previous studies of shear strength 6, 7, these transitions correlate with the evolution of entanglements near the interface as measured by identifying TCs between the primitive paths of different chains.
Previous simulations 40, 36 showed that in mono-dispersed bulk samples stable crazes began to form when the chain length was increased from 128 to 256. To sharpen this criterion, additional simulations of bulk samples were performed for a set of chain lengths in the range . We found that homopolymers with chains of length did not form a stable craze, while those with did 49. Since , craze growth requires roughly two entanglements per chain. At small welding times, chains have not diffused far enough to form these entanglements and the interface responds like a bulk system with .
Results for the density of entanglements near the interface as a function of welding time are presented in Ref. 6. They show that at the interfacial entanglement density is still strongly suppressed from the bulk value for chains with . To identify a criterion for stable craze formation we examined a new measure, the density of entangled interfacial strands. These are defined as chain segments that cross the mid-plane once and have one end forming a TC with a chain from each side. Based on the bulk results described above, we expect that this is a minimal criterion for the chain segment to contribute to stable craze formation.
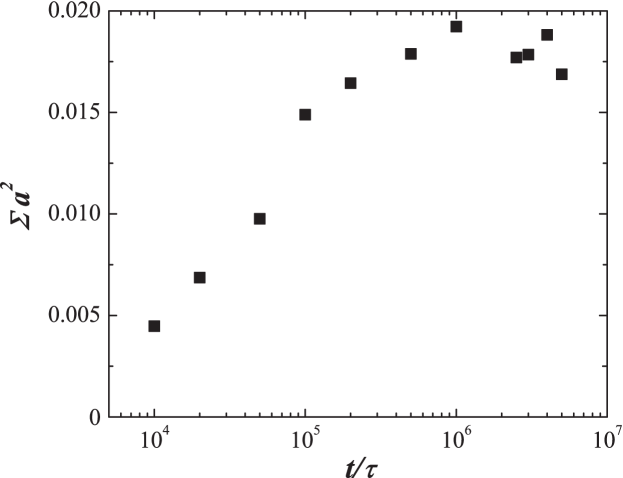
Figure 4 shows the time dependence of the areal density of entangled interfacial strands, . At small times, rises as chains diffuse across the interface. For , saturates. There is no further increase in the number of chains that cross the interface to form entanglements. The total number of interfacial entanglements between chains from opposite sides continues to grow 6, but only because chains that cross the interface diffuse farther and form more entanglements on the opposing side. Note that saturates near . Thus, once chains have formed the first TC across the interface, chain pullout is suppressed and a craze is formed.
For the interface and bulk deform into a craze in the same way. Mechanical stability requires that the tensile stresses are the same and we find the final densities correspond to the same extension ratio . For bulk crazes, both experiment 25, 26, 27, 28 and simulation 36 results for are consistent with a model based on the idea that segments between entanglements become taut during crazing. We verified that entangled interfacial strands stretched by the same amount as their bulk counterparts. However, as in previous work 36, 35, 49, the strands are not completely taut. This reflects a factor of from an average over orientations that was dropped from the original derivation of the expression for 25, 26, 35.
In mono-dispersed samples, previous simulations 36 have shown that the mechanism of craze failure changes with increasing chain length. For , the craze forms and then fails through chain pullout, while for the craze fails through chain scission. This criterion again highlights the role of entanglements in the breakdown of crazes. Our previous analysis 6 has shown that the density of entanglements keeps rising at the interface for . At , we can already observe a considerable amount of bond breaking during craze failure (Fig. 2(b)). The bulk mechanical response (and accordingly the level of bond breaking) is recovered when the bulk entanglement density is recovered at the interface. This occurs by , which is the same time where the bulk shear strength is recovered 6. Shear studies also found a rapid onset of bond breaking between and .
The time for diffusion to completely erase the initial interface should be of order the disentanglement time M for chains to diffuse by their end-end distance 7. Our finding that bulk behavior is recovered for is consistent with several previous studies. Tensile tests by Schnell et al. 4 also showed that strength recovers at times much smaller than . More recently, McGraw et al. 5 examined crazes formed at the interface between two identical polymer films as a function of welding time 5. They found that the extension ratio of the interfacial craze reaches that of the bulk craze at . In Ref. 6 we showed that 3M corresponds to the time for the density of entanglements near the interface to return to the bulk value. Chains have only diffused far enough to create roughly two entanglements per chain with chains on the other side of the interface, but this is enough to prevent chain pullout and achieve bulk strength.
3.1.3 3.1.3 Macroscopic Fracture Energy
The interfacial tensile strength is usually characterized by the interfacial fracture energy which corresponds to the work needed to fracture a unit area 1, 8, 4, 9, 17. For systems that do not form a stable craze (), deformation is localized to the interface. can then be obtained by integrating the work under the stress curves in Figure 2: . This method is not sufficient for , because the rigid boundary layers limit the growth of the craze and therefore prevent the simulation from capturing the whole plastic zone that would form ahead of an experimental crack tip. To circumvent this limitation, we apply the same method as in a previous study 30, where Brown’s fracture model and molecular simulation were combined to estimate the fracture energy for polymer glasses.
Brown’s fracture model 29 links two length scales: the macroscopic scale where the fracture test is performed and the microscopic scale of fibrils and voids within the craze. In his model, , where is the maximum width of the craze ahead of the crack tip. Brown showed that , where is the spacing between fibrils and the dimensionless can be expressed in terms of various elastic moduli of the fully developed craze. Since is not directly accessible to experiments, Brown estimated from the stress needed for chain scission, though the model applies for any mode of craze failure.
All quantities needed for the calculation of using Brown’s model can be measured in our simulation. For the plateau stress and extension ratio are nearly constant, and . The ratio is extracted from stress curves like those shown in Fig. 2. Previous simulations 30 using the same polymer model determined that and . Here, and are used in our calculation of .
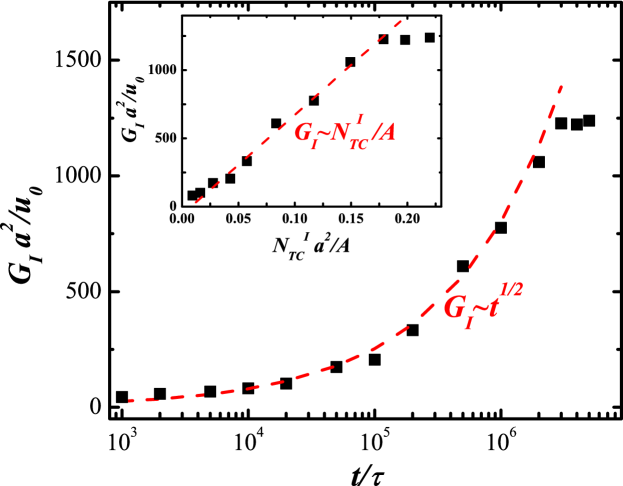
The increase of with is shown in Figure 5. At long times, approaches the bulk fracture energy . Both are about times higher than the lower bound for that is given by twice the surface tension . This ratio is consistent with experimental observations that crazing increases the fracture energy by factors of several thousand 2. As in experiment 10, 1, the increase of with follows a roughly power law before saturating at the bulk fracture energy . A reptation 50 argument has been employed to explain this power law based on formation of entanglements across the interface. However, a recent simulation 51 has shown that the dynamics across the interface between entangled melts is dominated by chain ends, and cannot be simply described as a reptation process. Differentiating between these pictures is difficult given the limited scaling range in experiments.
Our simulation allows a direct test of the connection between and entanglements. The inset of Fig. 5 shows a clear linear correlation between and , the areal density of interfacial TCs, before saturates at the bulk value. The proportionality between and can be related to the failure mechanism of chain scission, which is fostered by entanglements. Note that this correlation is independent of the exact scaling of or with .
3.2 3.2 Immiscible Interface
For immiscible polymer interfaces, the free energy cost of mixing limits the degree of interdiffusion. The interfacial width grows more slowly with time than for the miscible case and saturates at a finite value at large times 18. The growth in fracture energy with reflects these differences, as shown in Fig. 6. Immiscible results are always below those for the miscible case. For , saturates at M. For more immiscible cases, shows almost no increase and saturates by M.
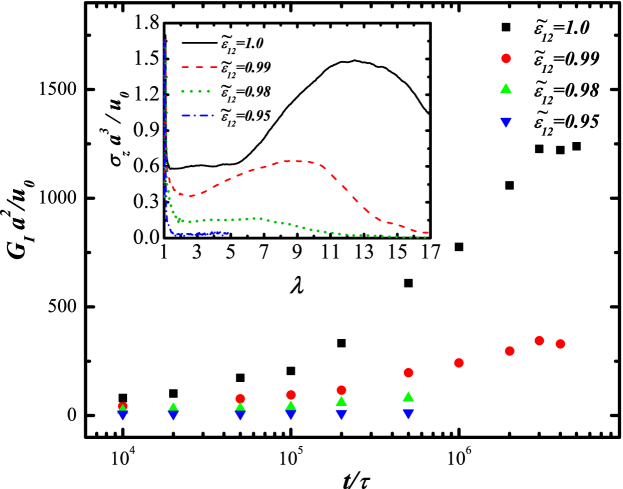
The inset of Fig. 6 shows stress-strain curves for immiscible interfaces at their equilibrium state and for the miscible case at M. The trends with increasing are similar to those with increasing time for miscible interfaces in Fig. 2. The interface fails rapidly after cavitation for and . Figures 7(a-c) show that these systems fail through chain pullout to the original side with no craze formation. For the stress has a value close to the bulk plateau stress for a range of strains. Figures 7(d-f) show some fibrils, but there is no stable craze and failure is through chain pullout.
In Ref. 18 we showed that a minimum interfacial width was needed for entanglements to form across the interface. The equilibrium width for is below this threshold, which is consistent with the rapid failure shown in Fig. 6. For there are a few interfacial entanglements at and rises noticeably after this time. However the equilibrium density of entanglements at long times is far below the bulk value needed for significant shear strength 18.
For the miscible case we found that stable craze formation was associated with saturation of the areal density of interfacial strands at . For , and , at the equilibrium interface is , and of the saturation value needed for stable craze formation. In all cases the equilibrium is comparable to that for miscible interfaces at the time when they have reached a comparable .
4 4 Summary and Conclusions
We have presented detailed studies of the evolution with welding time of interfacial entanglements and the tensile fracture energy of welded polymer interfaces. For miscible polymer interfaces at times less than M, there is a clean fracture along the initial interface. The ends of chains that have diffused across the interface are simply pulled out. The small fracture energy is related to the friction resisting chain pull out.
For the interface is strong enough to support craze formation. Direct examination of interfacial entanglements shows that the areal density of chains that have diffused far enough to form at least one topological constraint with chains on the opposing surface saturates at . This first TC is sufficient to transfer stress and stabilize the craze. However the interfacial region remains weak and for M the craze eventually fails through chain pullout near the interface. For chains are entangled enough that craze breakdown produces chain scission. This is the mechanism of craze failure in the bulk and the interfacial craze is as strong as the bulk for M. This is the same time where the interfacial shear strength saturates and coincides with the recovery of a bulk density of entanglements in the interfacial region 6.
The interfacial fracture energy is calculated by using our simulation results as inputs to Brown’s fracture model. As in experiment, increases roughly as before saturating at the bulk fracture energy . A linear correlation between and the density of interfacial entanglements is observed until saturates at . A similar linear relation between shear strength and interfacial entanglement density was observed previously 6, 18. However the increase in shear strength is only a factor of 3 while the fracture energy increases by two orders of magnitude.
We also simulate tensile failure at immiscible polymer interfaces. Due to the lack of entanglements across the interface, the dominant failure mechanism is chain pullout at the interface without stable craze formation. This reduces the interfacial fracture energy . However, once the interfacial width rises above the threshold value for entanglement development, is dramatically increased.
The above studies are for the simplest polymer model that captures the effects of entanglements. In a recent study of thermal healing of cracks we considered the effect of increasing chain stiffness and thus lowering the entanglement length. The results show that interchain friction may compete with entanglements in determining interfacial strength 7. We hope that our findings spur further studies with more realistic potentials and can be used to improve existing macroscopic fracture models of polymer glasses and interfaces.
We thank E. Kramer, D. Perahia and M. Rubinstein for useful discussions and T. O’Connor for creating final versions of Figs. 2 and 6. This work was supported by the National Science Foundation under grants DMR-1006805, DMR-1309892, CMMI-0923018, and OCI-0963185. MOR acknowledges support from the Simons Foundation. This research used resources at the National Energy Research Scientific Computing Center (NERSC), which is supported by the Office of Science of the United States Department of Energy under Contract No. DE-AC02-05CH11231. Research was carried out in part, at the Center for Integrated Nanotechnologies, a U.S. Department of Energy, Office of Basic Energy Sciences user facility. Sandia National Laboratories is a multi-program laboratory managed and operated by Sandia Corporation, a wholly owned subsidiary of Lockheed Martin Corporation, for the U.S. Department of Energy’s National Nuclear Security Administration under contract DE-AC04-94AL85000.
References
- Wool 1995 Wool, R. P. Polymer Interfaces: Structure and Strength; Hanser: Munich, 1995
- Haward and Young 1997 Haward, R. N., Young, R. J., Eds. The Physics of Glassy Polymers; Chapman & Hall: London, 1997
- Jones and Richards 1999 Jones, R. A. L.; Richards, R. W. Polymers at Surfaces and Interfaces; Cambridge University Press: New York, 1999
- Schnell et al. 1999 Schnell, R.; Stamm, M.; Creton, C. Macromolecules 1999, 32, 3420
- McGraw et al. 2013 McGraw, J. D.; Fowler, P. D.; Ferrari, M. L.; Dalnoki-Veress, K. Eur. Phys. J. E 2013, 36, 7
- Ge et al. 2013 Ge, T.; Pierce, F.; Perahia, D.; Grest, G. S.; Robbins, M. O. Phys. Rev. Lett. 2013, 110, 098301
- Ge et al. 2014 Ge, T.; Robbins, M. O.; Perahia, D.; Grest, G. S. Phys. Rev. E in press 2014,
- Schnell et al. 1998 Schnell, R.; Stamm, M.; Creton, C. Macromolecules 1998, 31, 2284
- Brown 2001 Brown, H. R. Macromolecules 2001, 34, 3720
- Jud et al. 1981 Jud, K.; Kausch, H. H.; Williams, J. G. J. Mater. Sci. 1981, 16, 204
- Prager and Tirrell 1981 Prager, S.; Tirrell, M. J. Chem. Phys. 1981, 75, 5194
- Prager et al. 1983 Prager, S.; Adolf, D.; Tirrell, M. J. Chem. Phys. 1983, 78, 7015
- Wool and O’Connor 1981 Wool, R. P.; O’Connor, K. M. J. Chem. Phys. 1981, 52, 5953
- Kim and Wool 1983 Kim, Y. H.; Wool, R. P. Macromolecules 1983, 16, 1115
- Mikos and Peppas 1989 Mikos, A. G.; Peppas, N. A. Polymer 1989, 30, 84
- Benkoski et al. 2001 Benkoski, J. J.; Fredrickson, G. H.; Kramer, E. J. J Polym Sci Part B: Polym. Phys. 2001, 39, 2363
- Cole et al. 2003 Cole, P. J.; Cook, R. F.; Macosko, C. W. Macromolecules 2003, 36, 2808
- Ge et al. 2013 Ge, T.; Grest, G. S.; Robbins, M. O. ACS Macro Lett. 2013, 2, 882–886
- Helfand and Tagami 1971 Helfand, E.; Tagami, Y. J. Polym. Sci., Part B: Polym. Phys. 1971, 9, 741
- Helfand and Tagami 1972 Helfand, E.; Tagami, Y. J. Chem. Phys. 1972, 56, 3592
- Kline and Wool 1988 Kline, D. B.; Wool, R. P. Polym. Eng. Sci. 1988, 28, 52
- Parsons et al. 1998 Parsons, M.; Ernst, A.; Smyser, G.; Hiltner, A.; Baer, E. J. Adhesion 1998, 66, 135
- Akabori et al. 2006 Akabori, K.; Baba, D.; Koguchi, K.; Tanaka, K.; Nagamura, T. J. Polym. Sci., Part B: Polym. Phys. 2006, 44, 3589
- Boiko 2012 Boiko, Y. M. Macromol. Symp. 2012, 316, 71
- Donald and Kramer 1982 Donald, A. M.; Kramer, E. J. J. Polym. Sci. Polm. Phys. Ed. 1982, 20, 899–909
- Donald et al. 1982 Donald, A. M.; Kramer, E. J.; Bubeck, R. A. J. Polym. Sci. Polm. Phys. Ed. 1982, 20, 1129–1141
- Kramer 1983 Kramer, E. J. Adv. Polymer Sci. 1983, 52, 1
- Kramer and Berger 1990 Kramer, E. J.; Berger, L. L. Adv. Polymer Sci. 1990, 91, 1
- Brown 1991 Brown, H. R. Macromolecules 1991, 24, 2752
- Rottler et al. 2002 Rottler, J.; Barsky, S.; Robbins, M. O. Phys. Rev. Lett. 2002, 89, 148304
- Kremer and Grest 1990 Kremer, K.; Grest, G. S. J. Chem. Phys. 1990, 92, 5057
- Stevens 2001 Stevens, M. J. Macromolecules 2001, 34, 2710
- Odell and Keller 1986 Odell, J. A.; Keller, A. J. Polym. Sci., Part B: Polym. Phys. 1986, 24, 1889–1916
- Creton et al. 1992 Creton, C.; Kramer, E. J.; Hui, C. Y.; Brown, H. R. Macromolecules 1992, 25, 3075–3088
- Rottler and Robbins 2002 Rottler, J.; Robbins, M. O. Phys. Rev. Lett. 2002, 89, 195501
- Rottler and Robbins 2003 Rottler, J.; Robbins, M. O. Phys. Rev. E 2003, 68, 011801
- Hoy and Robbins 2007 Hoy, R. S.; Robbins, M. O. Phys. Rev. Lett. 2007, 99, 117801
- Hoy and Robbins 2008 Hoy, R. S.; Robbins, M. O. Phys. Rev. E 2008, 77, 031801
- Gersappe and Robbins 1999 Gersappe, D.; Robbins, M. O. Europhys. Lett. 1999, 48, 150
- Baljon and Robbins 2001 Baljon, A. R. C.; Robbins, M. O. Macromolecules 2001, 34, 4200
- Rottler and Robbins 2003 Rottler, J.; Robbins, M. O. Phys. Rev. E 2003, 68, 011507
- 42 If was not reduced, the density and chain conformation changes would be much larger than in experiments because the melt is at a very elevated temperature to speed diffusion.
- Eveaers et al. 2004 Eveaers, R.; Sukumaran, S. K.; Grest, G. S.; Svaneborg, C.; Sivasubramanian, A.; Kremer, K. Science 2004, 303, 823
- Vettorel and Kremer 2010 Vettorel, T.; Kremer, K. Macromol. Theory Simul. 2010, 19, 44–56
- Hoy and Grest 2007 Hoy, R. S.; Grest, G. S. Macromolecules 2007, 40, 8389
- Tzoumanekas and Theodorou 2006 Tzoumanekas, C.; Theodorou, D. N. Macromolecules 2006, 39, 4592
- Everaers 2012 Everaers, R. Phys. Rev. E 2012, 86, 022801
- Anogiannakis et al. 2012 Anogiannakis, S. D.; Tzoumanekas, C.; Theodorou, D. N. Macromolecules 2012, 45, 9475–9492
- Ge 2013 Ge, T. Ph.D. thesis, Johns Hopkins University 2013,
- de Gennes 1971 de Gennes, P. G. J. Chem. Phys. 1971, 55, 572
- Pierce et al. 2011 Pierce, F.; Perahia, D.; Grest, G. S. EPL 2011, 95, 46001