Transparency robust to disorder in a periodic array of Helmholtz resonators
Abstract
In this paper, the influence of disorder on 1D periodic lattice of resonant scatterers is inspected. These later have multiple resonance frequencies which produce bandgap in the transmission spectrum. One peculiarity of the presented system is that it is chosen with a nearly perfect overlap between the Bragg and the second hybridization bandgaps. In the case of a perfect ordered lattice, and around this overlap, this produces a narrow transparency band within a large second bandgap. As expected, the effect of the disorder is generally to increase the width of the bandgaps. Nevertheless, the transparency band appears to be robust with respect to an increase of the disorder. In this paper, we study this effect by means of experimental investigations and numerical simulations.
I Introduction
Phononic crystals have experienced an increasing interest in recent years because of their potential applications to acoustic filters Romero , the control of vibration isolation Hussein , noise suppression, and the possibility of building new transducers Wu ; for a review see Page . It is thus of interest to understand which properties of such structures are sensitive to inherent imperfections in their design and which are not. Besides, one can also address the question of whether or not the disorder can make new interesting properties to appear.
It is usual to characterize a random medium in terms of an effective -homogeneous- medium. For random perturbation of homogeneous free space one finds that the dispersion relation departs from the dispersion relation in free space without disorder, and the imaginary part of the effective wavenumber indicates how much the opacity due to disorder is important lintonmartin . In the case of photonic or phononic crystals, the band structure of the unperturbed medium is more complicated, with a wavenumber of the Bloch Floquet mode being either purely real (pass band) or complex (stop band). The addition of disorder modifies the band structures of these periodic-on-average systems maradudin ; Deych98 ; Han2008 ; Maurel2008 ; Maurel2010 ; Izrailev2012 ; Maurel2013 , and generally, produces an increase in the band gap width Chang2003 . Among periodic media, the case of periodic arrays of resonant scatterers is very attractive since the resonances inherent to the individual scatterers produce strong modifications of the wave propagation; owing to these modifications in the wave properties may help to design materials with unusual properties. Such arrays present band gaps around the resonance frequencies of an individual scatterer. Because periodically located, Bragg resonances are also produced, resulting in a complex band gap structure. Overlapping two types of gaps, a resonant scatterer gap and a Bragg gap, have been shown to produce interesting phenomena, as the creation of a super wide and strongly attenuating band gap used for structure isolation Croenne2011 ; Xiao2011 ; Sugimoto1995 ; Bradley1994 and slow wave application Theocharis2014 .
In this paper, we consider the propagation of an acoustic wave in a periodic array of Helmholtz resonators connected to a duct in the plane wave regime (low frequency regime with one propagating mode in the duct). The corresponding model describes the 1D propagation of the pressure field through resonant point scatterers (Kronig- Penney system) Olivier ; Richoux2009
| (1) |
where is the periodicity of the array and where encapsulates the effect of the th resonator of the array. The disorder is introduced by varying the volume of the Helmholtz resonators. When an overlap between a Bragg gap and a resonant bandgap is produced, a narrow transparency band appears within the resulting large bandgap. Unexpectedly, we found that this transparency band is robust with respect to the disorder. Indeed, first, for small disorder, the transmission decreases; but increasing further the disorder induces an increase in the transmission. We have carried out experiments whose results show qualitatively this behavior. To get further informations, with a broader range of the disorder parameter, numerical calculations are shown, that confirm the transparency induced by disorder. The paper is organized as follow: in Part II, the 1D model and the CPA result for the randomly perturbed system are discussed. The experimental results are presented in Part III, and this is completed by numerical calculations, in Part IV. Finally, a discussion is proposed in Part V.
II Propagation in 1D periodic and perturbed HR array
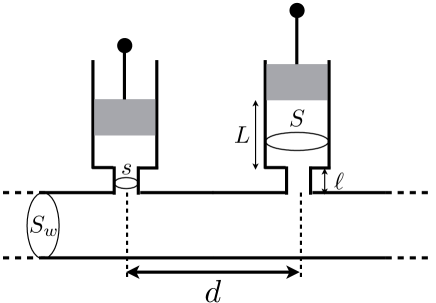
At low frequencies, when only one mode can propagates in the duct, the propagation of acoustic waves in an array of Helmholtz resonators periodically located with spacing (Fig. 1) can be described by
| (2) |
where is the pressure field and (the time dependance is omitted, is the angular frequency and the sound velocity in free space). The potential is
| (3) |
with , where are the area of the main waveguide, of the cavity and of the neck, respectively. and denote the length of the neck and of the cavity respectively (see Fig. 1(b)). The wavenumbers are , with (waveguide, cavity and neck respectivelly) and the corresponding radius, with and the viscous boundary layer depth ( the cinematic viscosity). The term proportional to in the wavenumber is a good model of the viscous and thermal attenuation of sound in the duct. We can notice that, with , the strength of the Helmholtz scatterer is small except at resonances. Approximating and by , and thus omitting the attenuation, these cavity resonances correspond to a vanishing term , and they are of two types: i) the typical Helmholtz resonance occurring at low frequency, say for close to and ii) the resonances in the cavity (hereafter referred as volume resonances), near . For instance, for ,
| (4) |
For a single resonator, these resonances produce a vanishing transmission. When the resonators are organized in a perfect periodic array, band gaps are created around the resonance frequencies, according to Bloch Floquet wavenumber becoming purely imaginary, being given by
| (5) |
When disorder is introduced in the volume cavity by changing the length of the nth cavity, and , it is possible to predict the new Bloch Floquet using CPA approach Maurel2010
| (6) |
where denotes the ensemble average for all realizations of the -values. The resulting transmission coefficient is
| (7) |
where we have written (the incident wave is ) and with
| (8) |
Obviously, the above results obtained from CPA recover the perfect periodic case when .
In the following, we present the experimental set-up to realize the lattice of Helmholtz resonators. Comparisons between the measured transmission and the above CPA- result, Eq. (7) is presented.
III Experimental results
III.1 Experimental set-up
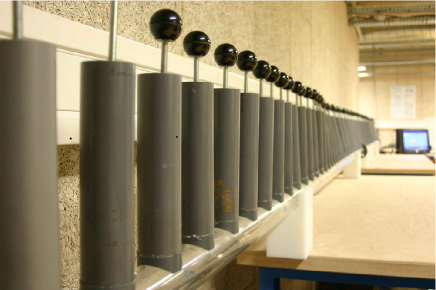
The experimental set-up (fig. 1) consists in a m long cylindrical waveguide with an inner area m2 and a cm thick wall. This waveguide is connected to an array of Helmholtz resonators periodically distributed, with inter-distance m. Each resonator is composed by a neck (cylindrical tube with an inner area m2 and a length cm) and by a cavity with variable length. The cavity is a cylindrical tube with an inner area m2 and a maximum length cm, see fig. 1(b).
The sound source is connected to the input of the main tube. The source is embedded in an impedance sensor MinutePub , able to calculate the input impedance of the lattice , defined as the ratio of the acoustic pressure and the acoustic flow (the product of the velocity by the area cross section) at the entrance of the lattice, as described in Macaluso2011 . This allows to get the reflection coefficient defined as owing to with , , where the index and denote the parts of the quantity associated to right- and left-going waves:
| (9) |
At the output, an anechoic termination made of a m long waveguide partially filled with porous plastic foam suppresses the back propagative waves. This ensures the output impedance to be close to the characteristic impedance . Finally, a microphone is used to measure the pressure at the end of the lattice.
Using line matrix theory, and are linked by the transfer matrix through
| (10) |
with ( being measured) and (the acoustic flow is deduced from because of the anechoic termination). Then, the transmission coefficient defined as , is calculated using that by definition of and from above, , from which
| (11) |
where is deduced from the measured -values.
When considered, the disorder in the lattice is introduced through the variable lengths , of the cavities, and is used with a normal distribution of being chosen for each realization and for each resonator cavity, with , resulting in a variable scattering strength, in Eq. (3).
The transmission coefficients are measured for ten different distributions with same standard deviation, and the mean value is taken.
III.2 Experimental observations
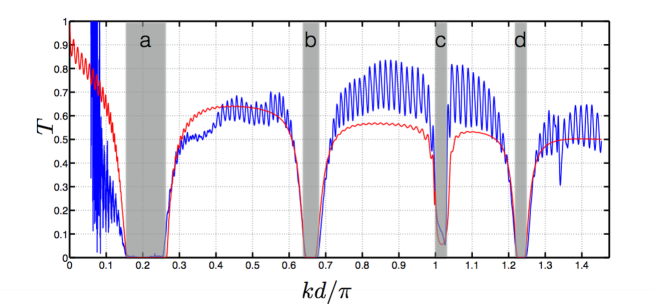
The transmission coefficient in the perfect periodic case is presented in the Fig. 2 for a cavity length m. Four bandgaps are visible : The first (labeled a) at low frequency is associated to the Helmholtz resonance () for , corresponding to frequency in Hz. Two other band gaps (labeled b and d) are associated to the two first volume resonances ( close to and ); these are for in , (corresponding frequency ranges Hz and Hz). These three band gaps associated to resonances of the scatterer are often referred as hybridization band gaps Croenne2011 . Finally, the band gap labeled c is associated to the Bragg resonance, for , (frequency range Hz). This band structure has been described in details, including non linear aspects, in Olivier ; Richoux2007 ; Richoux2009 . The comparison between the experimental (blue line) and the analytical expression, Eq. (7), (black line) shows a good agreement. The discrepancy in the low frequency regime may be attributable to the bad quality of the source in this frequency range.
Finally, the strong peaks appearing in the experimental measurements are due to the imperfection in the anechoic termination, resulting in interferences between forward and backward waves in the main tube.
The Fig. 3(a) shows the transmission in the perfect periodic case for m. With , the volume resonance , with , and the Bragg frequency are very close, resulting in an almost perfect overlap of the two corresponding band gaps, previously labeled b and c, visible here in the range (frequency range Hz). The first band gap, associated to the Helmholtz resonance is almost non affected by the change in while the volume resonance with (previously labeled d) is sent to higher frequency (not visible in our plot). A noticeable feature is the existence of a small transparency band inside the large stop band near , a feature already observed in other system where such overlapping is realized Sugimoto1995 ; Bradley1994 ; Theocharis2014 . This feature, in addition to the main behavior of , is accurately captured by our analytical expression, Eq. (7), in the perfect periodic case, thus with constant unpertubed potential (and ).
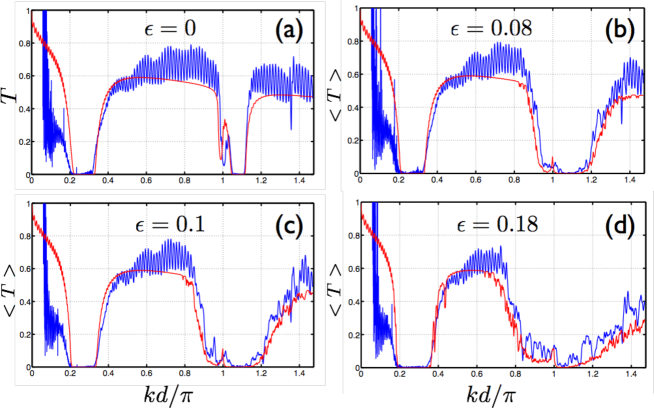
We now consider several amplitudes of disorder in the scattering strength of the resonators, as previously described. The measured transmission coefficients are reported in Fig. 3(b,c,d) for respectively .
As expected, the more visible effect of the disorder is to strengthen the opacity of the media. This is associated to the fact that the wavenumber of the effective Bloch mode acquires an imaginary part due to the disorder (in addition to the attenuation) in the ex-pass bands of the perfect ordered case. In counterpart, in the ex-stop bands of the perfect ordered case, the imaginary part of the wavenumber decreases, resulting in an increase of the transmission maradudin .
In the second stop band, an interesting behavior can be noticed, although very qualitative at this stage: inside the second band gap, around , the small transparency band remains visible, since we observe a peak of transmission robust to disorder. This trend is confirmed by the analytical model (red curves on Fig 3).
In the following section, we use numerical calculations to get further insights on this induced transparency near .
IV Numerical inspection of the induced transparency
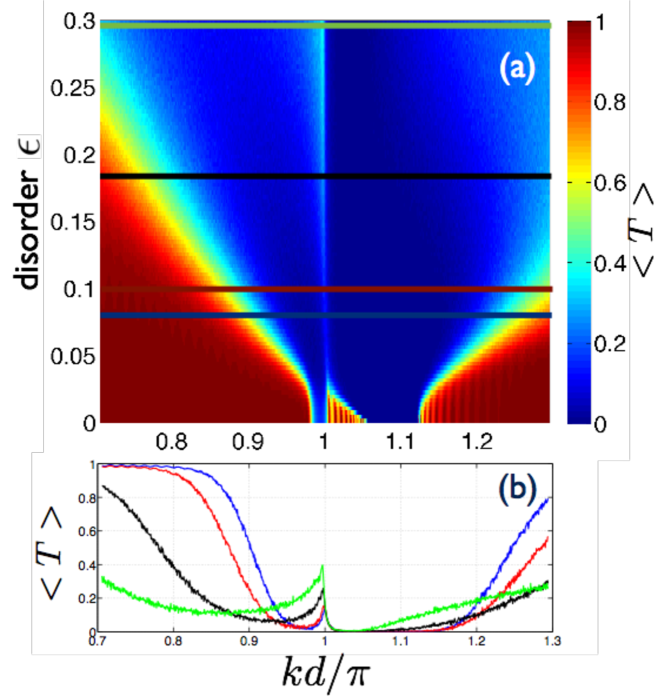
We now present results from numerical experiments of the propagation in the array of Helmholtz resonators. This is done by solving Eq. (2), with variable values. The disorder is introduced by using in Eq. (3). To calculate , we implement a method based on the impedance, as describe in Maurel2008 . For each frequency, realizations of the disorder with same amplitude are performed. The effective transmission is calculated by averaging the transmission coefficients , where the are the transmission coefficients for each realization.
The main result is presented in Figs. 4. In Fig. 4(a), is shown in a 2D plot as a function of and and Fig. 4(b) shows several transmission curves for given -values. Clearly, with realizations of the disordered, the averaged systems have converged. The transparency robust to disorder is quantitatively confirmed: For the largest values of disorder, the transmission near increases with the disorder.
V Discussion
Robustness of transparency to disorder could appear counterintuitive with regards to the usual influence of disorder in wave propagation. Indeed, the presence of disorder is known to break the wave propagation and to avoid any transmission. In this study, robustness of transparency is the result of the mixing of two different physical phenomena : (1) the non-exact overlap of the Bragg and hybridization band gaps which generates, in the periodic case, a narrow passband located inside a band gap and (2) the presence of disorder on potential which prevents the wave propagation inside the media. In the periodic case, one of the edges of transparency band due to overlap is located at which corresponds to the Bragg frequency Theocharis2014 ; Sugimoto1995 . Because disorder is injected in the potential (resonance frequency of the Helmholtz cavity), the edge of the transparency band is not affected Maurel2013 . As a consequence, the narrow passband is very sensitive to disorder and disappears from its upper edge remaining the lower edge unchanged and creating a peak of transparence for . On the contrary, with no overlapping, the Bragg bandgap increases with disorder only from its upper edge. The lower edge belongs to a passband. In this case, there is no peak of transparency. This configuration can be used to filtering applications by tuning very narrow filter by injection of disorder in the system.
VI Conclusion
In this paper, we reported an experimental and numerical characterization of a periodic-on-average disordered system. The usual widening of the band gaps of disordered arrays is observed. On the other hand, when nearly perfect overlap between the Bragg and the scatterer resonance frequencies is realized, evidence of robust transparency has been shown.
Acknowledgments. This study has been supported by the Agence Nationale de la Recherche through the grant ANR ProCoMedia, project ANR-10-INTB-0914. V.P. thanks the support of Agence Nationale de la Recherche through the grant ANR Platon, project ANR-12-BS09-0003-03.
References
- (1) V. Romero-Garcia, C. Lagarrigue, J.-P. Groby, O. Richoux and V. Tournat, J. Phys. D 46, 305108 (2013).
- (2) M.I. Hussein, K. Hamza, G.M. Hulbert and K. Saitou, Waves in Random and Complex Media 17, 491 (2007).
- (3) T.Z. Wu and S.T. Chen, IEEE Trans. Microwave Th. and Tech. 54, 3398 (2006).
- (4) J.H. Page, A. Sukhovich, S. Yang, M.L. Cowan, F. Van Der Biest, A. Tourin, M. Fink, Z. Liu, C.T. Chan and P. Sheng, Phys. Stat. Sol. B 241, 3454 (2004).
- (5) C. M. Linton and P.A. Martin, J. Acoust. Soc. Am. 117(6), 3413-3423 (2005).
- (6) V. D. Freilikher, B. A. Liansky, I. V. Yurkevich, A. A. Maradudin and A. R. McGurn, Physical Review E 51(6), 6301 (1995).
- (7) L. I. Deych, D. Zaslavsky and A. A. Lisyansky, Phys. Rev. Lett. 81(24), 5390 (1998).
- (8) P. Han and C. Zheng, Phys. Rev. E 77(4), 041111 (2008).
- (9) A. Maurel and V. Pagneux, Phys. Rev. B 78(5), 052301 (2008).
- (10) A. Maurel, P. A. Martin and V. Pagneux, Waves in Random and Complex Media 20(4), 634-655 (2010).
- (11) F. M. Izrailev, A. A. Krokhin and N. M. Makarov, Physics Reports 512(3), 125-254 (2012).
- (12) A. Maurel and P. A. Martin, The European Physical Journal B 86(11), 1-10 (2013).
- (13) S. H. Chang, H. Cao and S. T. Ho, Quantum Electronics, IEEE Journal of Quantum Electronics 39(2), 364-374 (2003).
- (14) C. Croenne, E. J. S. Lee, H. Hu and J. H. Page, AIP Advances 1, 041401 (2011).
- (15) Y. Xiao, B. R. Mace, J. Wen and X. Wen, Phys. Lett. A 375, 1485 (2011).
- (16) N. Sugimoto and T. Horioka, J. Acoust. Soc. Am. 97(3), 1446 (1995).
- (17) C. E. Bradley, J. Acoust. Soc. Am. 96(3), 1844 (1994).
- (18) G. Theocharis, O. Richoux, V. Romero-Garcia, A. Merkel and V. Tournat, Limits of slow sound propagation and transparency in lossy locally resonant periodic structures, accepted by New Journal of Physics (2014).
- (19) O. Richoux and V. Pagneux, EPL 59(1), 34 (2002).
- (20) O. Richoux, E. Morand and L. Simon, Annals of Physics, 324(9), 1983-1995 (2009).
- (21) O. Richoux, V. Tournat and T. LeVanSuu, Phys. Rev. E, 75(2), 026615 (2007).
- (22) The sensor is developed jointly by CTTM (Centre de Transfert de Technologie du Mans, 20 rue Thalès de Milet, 72000 Le Mans, France) and LAUM (Laboratoire d’Acoustique de l’Université du Maine, UMR CNRS 6613, Avenue Olivier Messiaen, 72085 Le Mans Cedex 9, France)
- (23) A.D. Pierce, Acoustics: An Introduction to Its Physical Principles and Applications, Acoustical Society of America (1989).
- (24) C. A. Macaluso and J. P. Dalmont, J. Acoust. Soc. Am. 129(1), 404-414 (2011).