Decoding Spatial Complexity in Strongly Correlated Electronic Systems
Abstract
Inside the metals, semiconductors, and magnets of our everyday experience, electrons are uniformly distributed throughout the material. By contrast, electrons often form clumpy patterns inside of strongly correlated electronic systems (SCES) such as colossal magnetoresistance materials and high temperature superconductors. In copper-oxide based high temperature superconductors, scanning tunneling microscopy (STM) has detected an electron nematic on the surface of the material, in which the electrons form nanoscale structures which break the rotational symmetry of the host crystal. These structures may hold the key to unlocking the mystery of high temperature superconductivity in these materials, but only if the nematic also exists throughout the entire bulk of the material. Using newly developed methods for decoding these surface structures, we find that the nematic indeed persists throughout the bulk of the material. We furthermore find that the intricate pattern formation is set by a delicate balance among disorder, interactions, and material anisotropy, leading to a fractal nature of the cluster pattern. The methods we have developed can be extended to many other surface probes and materials, enabling surface probes to determine whether surface structures are confined only to the surface, or whether they extend throughout the material.
There is growing experimental evidence that many strongly correlated electronic systems such as nickelates, cuprates, and manganites exhibit some degree of local inhomogeneity,Dagotto (2005); Lai et al. (2010); Qazilbash et al. (2007); Sun et al. (2007); Tranquada et al. (1995); Zaanen and Gunnarsson (1989); Fratini et al. (2010) i.e., nanoscale variations in the local electronic properties. Describing the electronic behavior of these materials involves several degrees of freedom, including orbital, spin, charge, and lattice degrees of freedom. Disorder only compounds the problem. Not only can disorder destroy phase transitions, leaving mere crossovers in the wake, it can fundamentally alter ground states, sometimes forbidding long range order. Especially in systems where different physical tendencies compete, disorder can act as nucleation points for competing ground states.
One approach to disentangling disorder from the fundamental correlations induced by strong electron interactions is to put resources toward developing cleaner samples. While this approach is laudable and has led to many key insights and advances in strongly correlated electronic systems, it is also labor intensive and expensive. Even the cleanest sample, when stored over time at finite temperature, will acquire a thermodynamically required concentration of defects. Moreover, in some sense, disorder is intrinsic to the correlated phases, since in most systems the phases of interest happen upon chemical doping, which necessarily introduces disorder. Especially in cuprates, this drive toward cleaner samples or even toward controlling disorder in order to understand the intrinsic electronic states may not be necessary, since even “dirty” samples that have not undergone strict preparation protocols still exhibit the salient feature of superconductivity.Dull and Kerchner (1994) Indeed, in any high temperature superconductor, because the pairing scale must also be high, an understanding of the short-distance physics (i.e. within a few coherence lengths of the superconductivity) should be sufficient to understand the origin of pairing.Carlson et al. (2004) In this sense, long range order of a proposed pseudogap phase is neither necessary to produce superconductivity nor is it necessary in order to understand the superconductivity.
Ultimately, the interplay between many degrees of freedom, strong correlations, and disorder can lead to a hierarchy of length scales over which the resulting physics must be described.Dagotto (2005) While such electronic systems are highly susceptible to pattern formation at the nanoscale, unfortunately most of our theoretical and experimental tools are designed for understanding and detecting homogeneous phases of matter. Therefore, there is a critical need to design and develop new ways of understanding, detecting, and characterizing electronic pattern formation in strongly correlated electronic systems at the nanoscale, especially in the presence of severe disorder effects. Such theoretical guidance will enable more direct contact between theory and experiment in a number of materials, and provide a path forward for understanding “disputed” regions of phase diagrams of strongly correlated materials.
In this paper, we focus on detecting electron nematics and other electronic phases which break the rotational symmetry of the host crystal. Such phases have been proposed and/or observed in a variety of materials and contexts, including Sr3Ru2O7Borzi (2007), GaAs/AlxGa1-xAs heterostructures in fieldCooper et al. (2002); Du et al. (1999), and a subset of cuprate superconductorsFradkin and Kivelson (2010); Ando et al. (2002); Hinkov et al. (2004); Daou et al. (2010); Howald et al. (2003); Kohsaka et al. (2007); Lawler et al. (2010) such as YBa2Cu3O6+xAndo et al. (2002); Hinkov et al. (2004); Daou et al. (2010), and Bi2Sr2CaCu2O8+xHowald et al. (2003); Kohsaka et al. (2007); Lawler et al. (2010), as well as the iron arsenic based superconductor Ca(Fe1-xCox)2As2Chuang et al. (2010). The state has been proposed to exist in many more systems, such as AlAs heterostructures, the Si(111) surface, elemental bismuth, and both single layer and bilayer graphene.Abanin et al. (2010); Vafek and Yang (2010); Rasolt et al. (1986); Fradkin and Kivelson (2010)
We have proposed three approaches which, rather than shying away from disorder, use disorder to advantage in order to detect and characterize mesoscale and multi scale order in electronic systems (such as electron nematics) which break the rotational symmetry of the host crystal: (1) Extracting critical exponents from observed multi scale pattern formation in image data via cluster analyses.Fratini et al. (2010); Phillabaum et al. (2012); (2) Manifestations of nonequilibrium behavior such as hysteresisCarlson and Dahmen ; Mirri et al. (2014); and (3) Noise characteristicsBonetti et al. (2004); Carlson et al. (2006).
Method # 1 (Cluster Analyses) above is the subject of this paper, and the key insight is that near criticality, most physical quantities display power law behavior on length scales smaller than an appropriately defined correlation length. In order to make the connection with image data, this requires translating the geometric patterns into critical exponents, as described below.Fratini et al. (2010); Phillabaum et al. (2012) Method #2 (Hysteresis) relies on the extreme critical slowing down accompanying certain classes of quenched disorder.Fisher (1986) For systems in which the quenched disorder is of the random field type (see Eqn. 1 below), hysteresis is a prominent and robust feature, which means that hysteresis can be a good diagnostic tool for order parameters which couple to material disorder via a random field mechanism.Carlson et al. (2006) In this case, we have proposed using hysteresis in order to detect disordered electron nematics, even ones which never fully order but exhibit only local nematic order. The key insight is to field cool in an orienting field (such as uniaxial pressure), and measure any macroscopic response function which is sensitive to nematic order (such as anisotropic resistivity). Through specific field cooling and orientational field switching protocols as described in Ref. Carlson and Dahmen , the presence of a disordered electron nematic can be revealed experimentally.Mirri et al. (2014) Method #3 (Noise Characteristics) above concerns another manifestation of the slow time dynamics associated with random field disorder. For example, very slow telegraph noise was observed in the transport properties of a YBCO nanowire in the pseudogap phaseBonetti et al. (2004), consistent with the expected resistivity fluctuations of mesoscale electron nematic patches thermally switching their orientation.Carlson et al. (2006).
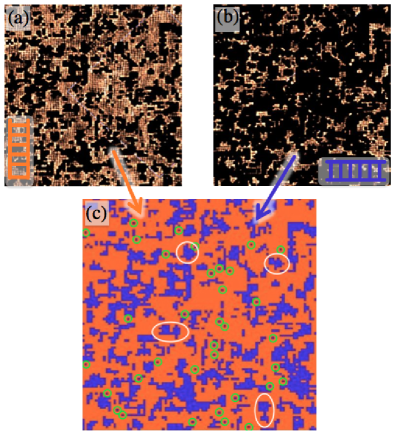
Patterns of unidirectional domains have been detected on the surface of cuprate superconductors.Kohsaka et al. (2007) In Fig. 1(a) and (b), we show the patterns of vertically oriented and horizontally oriented stripe domains, respectively, derived from a local Fourier transform of the R-map of STM on Dy-Bi2212, from Supplementary Fig. S3 of Ref. Kohsaka et al. (2007), as detailed in Ref. Phillabaum et al. (2012). Fig. 1(c) shows the corresponding Ising cluster map, where orange represents vertically aligned clusters, and blue represents horizontally aligned clusters. From the figure, it is evident that there is one large system-spanning (orange) cluster. There are also several medium-sized clusters (some are circled in white in Fig. 1(c)), as well as many small clusters (circled in green in Fig. 1(c)).
The clusters display structure on all length scales within the field of view. In addition, as we will show below, the boundaries of the clusters are fractal, and the sizes of the clusters are power law distributed. These are all features which point to the pattern formation being driven by proximity to a critical point. If there is an underlying critical point driving the pattern formation, then critical exponents are encoded in the image.Fratini et al. (2010); Phillabaum et al. (2012). For example, the number of clusters of a particular size is power-law distributed in this image, , with a power set by the Fisher exponent . In addition, the fractal geometric structure of the clusters can be quantified as the hull fractal dimension, , and the volume (interior) fractal dimension, of clusters. By studying the orientational analogue of the spin-spin correlation function, the anomalous dimension can also be extracted from the image.
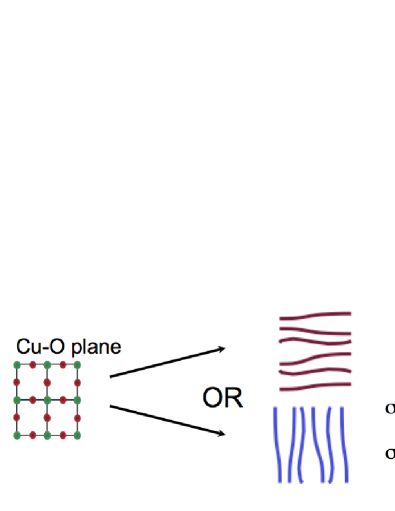
Relating these critical exponents to a particular fixed point requires a model. Near a critical point, the correlation length grows to become the dominant length scale, and it is possible to map the real physical system to a coarse-grained model with the same universal features. Starting from the cluster map in Fig. 1(c), we assign Ising variable to vertical domains, and to horizontal domains.Phillabaum et al. (2012) We furthermore incorporate disorder into the model in the following way: In any given region of the sample, dopant disorder locally breaks the rotational symmetry of the Cu-O plane. (The same is true of other sources of quenched disorder.) This locally favors one orientation of the nematic over the other. Thus, quenched disorder acts as a random field on the local director of the Ising nematic.Carlson et al. (2006) The model may be stated as
| (1) | |||||
where the sum runs over the coarse-grained regions (Ising sites) consisting of a cubic lattice, chosen with spacing comparable to the resolution of the image(s) to be studied. The tendency for neighboring regions to be of like character is modeled as a nearest neighbor ferromagnetic interaction . The layered structure of the material is captured by the in-plane coupling being larger than the coupling between planes . Ultimately, the criticality of such a quasi-two-dimensional system is controlled by a three dimensional fixed point for any finite . However, in a strongly layered system such as the cuprates where , it is possible to observe a drift from two dimensional to three dimensional exponents when observing a finite field of view.Zachar and Zaliznyak (2003)
There are six critical fixed points which can arise from the model of Eqn. 1: In the limit of zero disorder strength, the phase transition from disordered to long-range ordered nematic is controlled by the two-dimensional clean Ising model (C-2D) if , or by the three-dimensional clean Ising model (C-3D) for any nonzero coupling between planes. Random field disorder is relevant, and so the presence of any finite amount of random field disorder shifts the universality class to either the two-dimensional random field Ising model (RF-2D) or the three-dimensional random field Ising model (RF-3D).Phillabaum et al. (2012) Note that quenched material disorder can also give rise to randomness in the coupling strengths and , also known as random bond disorder. However, in the presence of both random bond and random field disorder, the critical behavior is always controlled by the random field fixed point. For completeness, we also consider the possibility that the observed local orientations are not arising from an interacting model, which corresponds to the percolation fixed points which occur at the infinite temperature limit of Eqn. 1 as a function of applied orienting field. These are the two-dimensional and three-dimensional uncorrelated percolation points, P-2D and P-3D, respectively.

As shown in Fig. 1(c), there is one large spanning cluster, and there are several medium-sized clusters, and even more small clusters. By counting the number of clusters of each size (where is the number of Ising sites in each cluster), one can construct the cluster size distribution . Near a critical point, this quantity exhibits power law scaling, as . However, it is known that near criticality, the scaling function which forms the prefactor for the power law has a pronounced bumpPerković et al. (1995), at least for the 3D random field fixed point. Therefore, a finite-size field of view is expected to underestimate the true value of . In future experiments, larger fields of view can mitigate this effect. Within the field of view available, we find that a straightforward power law fit yields .
From the cluster structure in Fig. 1, one can see that the clusters themselves are not compact. Rather, they are ethereal, even gossameryLaughlin (1997) in nature. Indeed, both the boundaries and the interiors of the clusters are fractal in nature. In Fig. 3(a), we show a log-log plot of the average perimeter of clusters of each size . As with the cluster size distribution, a robust power law emerges throughout the entire field of view. By comparing the perimeter and cluster sizes, the ratio of fractal dimensions can be extracted, where and denote the hull and volume fractal dimensions, respectively. (Here, the asterisk denotes the fact that only a 2D slice of the clusters is experimentally accessible, and therefore a corresponding geometric factor must be applied before comparing directly with 3D models.Phillabaum et al. (2012)) The ratio of fractal dimensions thus obtained is
In Fig. 3(b), we plot the probability that two pseudospins a distance apart are aligned. This is linearly related to the spin-spin correlation function . (In the physical system, the spin-spin correlation function corresponds to the orientation-orientation correlation function of the director of the electron nematic.) The spin-spin correlation function becomes power law near a critical point, . Here, we denote by the anomalous dimension at the surface of a material. As can be seen in the figure, this function is at most weakly power law in the data, with less than a decade of scaling. As such, this is the least reliable critical exponent extracted from the cluster analysis, yielding a value .
| Exponent ; Model | C-2D | C-3D | P-2D | P-3D | RF-2D | RF-3D | Dy-Bi2212 |
|---|---|---|---|---|---|---|---|
| 2.076 | 2.21 | 2.02 | 2.18 | 2.0 | |||
| 0.71 | - | 0.92 | 0.74 | .92 | 0.57 | ||
| 0.25 | 2.54 | 0.207 | 0.93 | 1 | 0.336 |
Table 1 shows a comparison between the critical exponents derived from the observed unidirectional electronic clusters in Dy-Bi2212 and theoretical values from critical fixed points of Eqn. 1. Note that for layered clean and random field Ising models, it is possible to observe a drift from 2D to 3D exponents in going from smaller to larger fields of view.Zachar and Zaliznyak (2003) However, no such dimensional crossover makes sense when considering uncorrelated percolation.
We now compare the data-derived exponents against theoretical models. Note that the value of from the data is lower than the theoretical value of every fixed point. This is expected for a finite field of view in random field models, where it is known that the cluster size distribution has a pronounced scaling bump.Perković et al. (1995) Note also that there is not much variation in the theoretical values of among the fixed points, so that while the presence of a robust power law in in the data is significant, it is difficult in principle to determine which fixed point could be responsible for the scale-free behavior via this exponent.
By contrast, the anomalous exponent shows a wide variation among fixed points, and can in principle be a good value to distinguish among fixed points. Unfortunately, the data-derived value has rather large error bars due to a limited regime of scaling, and so yields little information in this case.
Solid information can be gleaned by comparing the effective ratio of fractal dimensions, . For 2D models, this corresponds to the bulk fractal dimensions, . For 3D models, the bulk fractal dimensions differ from those observed on a 2D slice via geometrical factors, so that .Phillabaum et al. (2012) This ratio shows distinguishable variation among fixed points, and the data-derived value has small error bars and exhibits decades of scaling. All of this means that this exponent ratio is useful for distinguishing among the fixed points. Note that the observed ratio is inconsistent with uncorrelated 2D percolation (P-2D), and we can rule out this fixed point as the origin of the pattern formation. Although the P-3D fixed point may appear to be a reasonable match, other considerations rule this out as the origin of the cluster pattern. First, this fixed point occurs when 31% of domains point one direction, and the rest point the other.Stauffer and Aharony (1991) Such an extreme value of net nematicity would surely have been observed in macroscopic measurements on Dy-Bi2212, which is not the case. Second, while P-3D corresponds to the point at which geometric clusters percolate in a 3D system, this is not the same as the point at which those clusters percolate on a slice. Rather, at the 3D percolation point when viewed on a 2D slice, there is one large spanning cluster with many small clusters, and no robust power law behavior on the slice. So, the P-3D point can also be ruled out as the origin of the complex pattern formation.
This leaves the possibility of a dimensional crossover from 2D to 3D behavior in either the clean or random field Ising models. The expectation in the literature is that there should be no well-defined fractal dimension of geometric clusters at C-3D, since in fact geometric clusters do not exhibit power law behavior at the C-3D point.Dotsenko et al. (1995) However, recent studies indicate that when viewed on a 2D slice, geometric clusters do exhibit power law behavior at C-3D.Saberi and Dashti-Naserabadi (2011) The ratio of fractal dimensions on a 2D slice is not known in this case, and will be discussed in a future publication.Liu et al.
The possibility of a dimensional crossover from 2D to 3D exponents in a layered random field model is consistent with all data-derived exponents, and is the most likely source of the observed scale-free pattern formation of the electron nematic. In contrast with the clean model, geometric clusters do exhibit fractal dimensions and scale-free behavior at the RF-3D fixed point. Furthermore, if this identification is correct, then the clear prediction is that all data-derived exponents should drift away from the RF-2D values and closer to the RF-3D values upon increasing the field of view.
Other considerations also point to random field behavior: It has been previously shown that the slow telegraph noise observed in transport on a YBCO nanowire in the pseudogap regimeBonetti et al. (2004) is consistent with the mapping of electron nematic domains in a host crystal to the random field Ising model.Carlson et al. (2006) This identification also serves to unify several experiments, in that it offers a concrete explanation for why certain materials display long-range orientational stripe order, and others do not. While true long-range electron nematic order is possible in a real 3D system, it is completely forbidden in a 2D system in the presence of any nonzero random field disorder. Thus, in a highly layered system such as the cuprates, many samples are expected to display no long-range order of the electron nematic, although in a layered RFIM, nematic clusters can grow quite large within the plane even if true long-range order is never achieved.Lawler et al. (2010); Zachar and Zaliznyak (2003)
The RF-3D fixed point is a zero temperature fixed point, which has implications for dynamics as well as future experimental tests of the critical exponents. First, it means that the entire finite-temperature phase transition boundary in the layered model exhibits extreme critical slowing down. With typical critical slowing down, the relaxation time of the system diverges as a power law as criticality is approached, . However, the dynamics of the 3D random field Ising model are even more extreme near criticality, with the relaxation time diverging exponentially as criticality is approached, where is the spin-spin correlation length (which here corresponds to the orientation-orientation correlation length of the nematic director), and is the violation of hyperscaling exponent, which is nonzero at this fixed point.Fisher (1986) Second, because at a zero temperature fixed point, hyperscaling relations of critical exponents (which involve the dimension of the underlying phenomenon) must be modified.Fisher (1986) Third, there is the question of whether fine-tuning is required to see power law behavior associated with the RF-3D fixed point. In fact, partly because it is a zero temperature fixed point with pronounced nonequilibrium effects, there is a wide critical region associated with this fixed point. For example, in the zero temperature 3D RFIM, critical behavior with 2 decades of scaling can be observed even 50% away from the critical point.Perković et al. (1995)
Finally, we comment on the implications of multiscale behavior in cuprate superconductors. It is not just the electron nematic which exhibits fractal behavior in a bismuth-based cuprate, but similar behavior has been noted in the lanthanum family of cuprates as well. The local density of oxygen interstitials in LaSrCuO follows a power law at optimal doping.Fratini et al. (2010) In addition, theoretical studies have shown that there is a Goldilocks type of optimal inhomogeneity (neither too little nor too much) which favors superconductivity in a strongly correlated electronic system.Arrigoni and Kivelson (2003); Loh and Carlson (2007) The presence of inhomogeneity on multiple length scales, with robust power laws, in both the doping concentrations and also directly in the electronic degrees of freedom may point to the optimal inhomogeneity being fractal in nature. Much like the construction of the Eiffel tower incorporates elements of a scale-free iron latticework in order to optimize structural stability given a certain amount of iron to work with, high temperature superconductors may benefit from scale-free organization of electronic degrees of freedom in order to optimize the superconducting transition temperature.Poccia et al. (2011)
In summary, we conclude that the complex, scale-free patternPhillabaum et al. (2012) of nematic clusters observed at the surface of Dy-Bi2212 via STMKohsaka et al. (2007) is controlled by the 3D random field Ising model fixed point. That is, the ethereal cluster structure is due to a combination of interactions between clusters and quenched disorder due to material defects throughout the bulk of the material. As such, the pattern formation is not merely a surface effect. Rather, the nematic clusters form deep inside the material, and intersect the surface. While this analysis cannot distinguish between true macroscopic long-range order of the electron nematic and short-range order, we can conclude that there is significant multiscale order in the system. Indeed, because the pairing energy scale is high, the pairing mechanism can arise from short-distance physics, and the presence of large nematic clusters throughout the bulk of the material is sufficient for superconducting pairing to originate from the electron nematic.
Acknowledgements.
We thank J. Hoffman, S. Kivelson, Y. Loh, E. Main, B. Phillabaum, and C.-L. Song for helpful conversations. S.L. and E.W.C. acknowledge support from NSF Grant No. DMR 11-06187. K.A.D. acknowledges support from NSF Grant No. DMR 10-05209 and NSF Grant No. DMS 10-69224.References
- Dagotto (2005) E. Dagotto, Science 309, 257 (2005).
- Lai et al. (2010) K. Lai, M. Nakamura, W. Kundhikanjana, M. Kawasaki, Y. Tokura, M. Kelly, and Z. Shen, Science 329, 190 (2010).
- Qazilbash et al. (2007) M. M. Qazilbash, M. Brehm, B.-G. Chae, P.-C. Ho, G. O. Andreev, B.-J. Kim, S. J. Yun, A. V. Balatsky, M. B. Maple, F. Keilmann, H.-T. Kim, and D. N. Basov, Science 318, 1750 (2007).
- Sun et al. (2007) Z. Sun, J. Douglas, A. Fedorov, Y. Chuang, H. Zheng, J. Mitchell, and D. Dessau, Nature physics 3, 248 (2007).
- Tranquada et al. (1995) J. M. Tranquada, B. J. Sternlieb, J. D. Axe, Y. Nakamura, and S. Uchida, Nature 375, 561 (1995).
- Zaanen and Gunnarsson (1989) J. Zaanen and O. Gunnarsson, Phys. Rev. B 40, 7391 (1989).
- Fratini et al. (2010) M. Fratini, N. Poccia, A. Ricci, G. Campi, M. Burghammer, G. Aeppli, and A. Bianconi, Nature 466, 841 (2010).
- Dull and Kerchner (1994) R. W. Dull and H. R. Kerchner, “A teacher’s guide to superconductivity for high school students,” (1994), oRNL/M-3063/R1.
- Carlson et al. (2004) E. W. Carlson, V. J. Emery, S. A. Kivelson, and D. Orgad, “Concepts in high temperature superconductivity,” in The Physics of Superconductors, Vol. II, edited by J. Ketterson and K. Benneman (Springer-Verlag, 2004) in The Physics of Superconductors, Vol. II, ed. J. Ketterson and K. Benneman.
- Phillabaum et al. (2012) B. Phillabaum, E. W. Carlson, and K. A. Dahmen, Nature Communications 3, 915 (2012).
- Kohsaka et al. (2007) Y. Kohsaka, C. Taylor, K. Fujita, A. Schmidt, C. Lupien, T. Hanaguri, M. Azuma, M. Takano, H. Eisaki, H. Takagi, S. Uchida, and J. C. Davis, Science 315, 1380 (2007).
- Borzi (2007) R. Borzi, Science(Washington) 315, 214 (2007).
- Cooper et al. (2002) K. Cooper, M. Lilly, J. Eisenstein, L. Pfeiffer, and K. West, Phys. Rev. B 65, 241313 (2002).
- Du et al. (1999) R. Du, D. Tsui, H. Stormer, L. Pfeiffer, K. Baldwin, and K. West, Solid State Communications 109, 389 (1999).
- Fradkin and Kivelson (2010) E. Fradkin and S. Kivelson, Science 327, 155 (2010).
- Ando et al. (2002) Y. Ando, K. Segawa, S. Komiya, and A. Lavrov, Physical review letters 88, 137005 (2002).
- Hinkov et al. (2004) V. Hinkov, S. Pailhes, P. Bourges, Y. Sidis, A. Ivanov, A. Kulakov, C. Lin, D. Chen, C. Bernhard, and B. Keimer, Nature 430, 650 (2004).
- Daou et al. (2010) R. Daou, J. Chang, D. Leboeuf, O. Cyr-Choiniere, F. Laliberte, N. Doiron-Leyraud, B. J. Ramshaw, R. Liang, D. A. Bonn, W. N. Hardy, and L. Taillefer, Nature 463, 519 (2010).
- Howald et al. (2003) C. Howald, H. Eisaki, N. Kaneko, and A. Kapitulnik, Proceedings of the National Academy of Sciences of the United States of America 100, 9705 (2003).
- Lawler et al. (2010) M. J. Lawler, K. Fujita, J. Lee, A. R. Schmidt, Y. Kohsaka, C. K. Kim, H. Eisaki, S. Uchida, J. C. Davis, J. P. Sethna, and E.-A. Kim, Nature 466, 347 (2010).
- Chuang et al. (2010) T.-M. Chuang, M. P. Allan, J. Lee, Y. Xie, N. Ni, S. L. Bud’ko, G. S. Boebinger, P. C. Canfield, and J. C. Davis, Science 327, 181 (2010).
- Abanin et al. (2010) D. Abanin, S. Parameswaran, S. Kivelson, and S. Sondhi, Phys. Rev. B 82, 035428 (2010).
- Vafek and Yang (2010) O. Vafek and K. Yang, Phys. Rev. B 81, 041401 (2010).
- Rasolt et al. (1986) M. Rasolt, B. Halperin, and D. Vanderbilt, Physical review letters 57, 126 (1986), predicts Valley Degeneracy Breaking in QHE.
- (25) E. W. Carlson and K. A. Dahmen, “Using disorder to detect locally ordered electron nematics via hysteresis,” Submitted to Phys. Rev. Lett.
- Mirri et al. (2014) C. Mirri, A. Dusza, S. Bastelberger, J. H. Chu, H. H. Kuo, I. R. Fisher, and L. Degiorgi, Physical Review B 89, 060501 (2014).
- Bonetti et al. (2004) J. Bonetti, D. Caplan, D. Van Harlingen, and M. Weissman, Physical Review Letters 93, 087002 (2004).
- Carlson et al. (2006) E. W. Carlson, K. A. Dahmen, E. Fradkin, and S. A. Kivelson, Physical Review Letters 96, 097003 (2006).
- Fisher (1986) D. Fisher, Physical Review Letters 56, 416 (1986).
- Zachar and Zaliznyak (2003) O. Zachar and I. Zaliznyak, Physical Review Letters 91, 036401 (2003).
- Newman (2005) M. E. J. Newman, Contemporary Physics 46, 323 (2005).
- Perković et al. (1995) O. Perković, K. Dahmen, and J. Sethna, Physical Review Letters 75, 4528 (1995).
- Laughlin (1997) R. B. Laughlin, Phys. Rev. Lett. 79, 1726 (1997).
- Stauffer and Aharony (1991) D. Stauffer and A. Aharony, Introduction to Percolation Theory (Taylor & Francis, Philadelphia, 1991).
- Dotsenko et al. (1995) V. Dotsenko, M. Picco, P. Windey, G. Harris, E. Martinec, and E. Marinari, Nuclear Physics B 448, 577 (1995).
- Saberi and Dashti-Naserabadi (2011) A. A. Saberi and H. Dashti-Naserabadi, EPL (Europhysics Letters) 92, 67005 (2011).
- (37) S. Liu, E. W. Carlson, and K. A. Dahmen, Forthcoming.
- Arrigoni and Kivelson (2003) E. Arrigoni and S. Kivelson, Physical Review B 68, 180503 (2003).
- Loh and Carlson (2007) Y. Loh and E. Carlson, Physical Review B 75, 132506 (2007).
- Poccia et al. (2011) N. Poccia, A. Ricci, and A. Bianconi, Journal of Superconductivity and Novel Magnetism 24, 1195 (2011).