The Clusters AgeS Experiment (CASE)
Analysis of the detached eclipsing binary V15 in
the metal-rich open cluster NGC 6253***Based
on data obtained with the Magellan, du Pont, and Swope telescopes at Las Campanas Observatory.
M. R o z y c z k a1,
J. K a l u z n y1,
I. B. T h o m p s o n2,
A. D o t t e r3
W. P y c h1
and W. Narloch1
1Nicolaus Copernicus Astronomical Center, ul. Bartycka 18, 00-716 Warsaw, Poland
e-mail: (jka, mnr, wp)@camk.edu.pl
2The Observatories of the Carnegie Institution of Washington, 813 Santa Barbara Street, Pasadena, CA 91101, USA
e-mail: ian@obs.carnegiescience.edu
3Research School of Astronomy and Astrophysics, Australian National University, Canberra, Australia
e-mail: dotter@mso.anu.edu.au
ABSTRACT
We present the first detailed analysis of the detached eclipsing binary V15 in the super-metal rich open cluster NGC 6253. We obtain the following absolute parameters: M⊙, R⊙, L⊙ for the primary, and M⊙, R⊙, L⊙ for the secondary. Based on Dartmouth isochrones, the age of NGC 6253 is estimated to be 3.80 – 4.25 Gyr from the mass-radius diagram and 3.9 – 4.6 Gyr from color-magnitude diagram (CMD) fitting. Both of these estimates are significantly higher than those reported so far. The derived apparent distance modulus of 11.65 mag agrees well with the range of 10.9 – 12.2 mag derived by other authors; however our estimated reddening (0.113 mag) is lower than the lowest published value (0.15 mag). We confirm earlier observations that model atmospheres are not accurate enough to account for the whole CMD of the cluster, with the largest discrepancies appearing on the subgiant and giant branches. Although age estimation from the mass-radius diagram is a relatively safe, distance- and reddening-independent procedure, our results should be verified by photometric and spectroscopic observations of additional detached eclipsing binaries which we have discovered, at least two of which are proper-motion members of NGC 6253.
binaries: close – binaries: spectroscopic – open clusters: individual (NGC 6253) – stars: individual (V15-NGC 6253)
1 Introduction
NGC 6253 is an attractive research target for several reasons. Because it is an exceptionally metal-rich and evolutionary advanced open cluster, it offers a unique opportunity to verify predictions of stellar evolution codes in the high-metallicity regime (Claret 2007). As a high metallicity environment favors planet formation, it is of special interest in the search for exoplanets (Montalto et al. 2011) and for the development of the theory of planetary systems. Finally, it is an important benchmark for scenarios of the chemical evolution of the Galactic disk (Montalto et al. 2011) and an ideal sample to study the dependence of evolutionary alterations of the chemical abundances in metal-rich stars (Sestito et al. 2007; Mikolaitis et al. 2012).
The cluster has been the subject of several photometric surveys, briefly revieved by Kaluzny et al. (2014, hereafter Paper I), a proper-motion analysis (Montalto et al. 2009), and a radial velocity survey (Montalto et al. 2011). Metallicity determinations based on high resolution spectra range from (Carretta et al. 2007; Anthony-Twarog et al. 2010) through (Sestito et al. 2007) to (Montalto et al. 2012). The latter value is based on observations of just two red giants while the samples of Carretta et al. (2007), Anthony-Twarog et al. (2010) and Sestito et al. (2007) included 4, 15, and 4 stars, respectively. The rms errors range from 0.03 (Carretta et al. 2007; Anthony-Twarog et al. 2010) to 0.13 (Montalto et al. 2012). Only Carretta et al. (2007) give an estimate of the systematic uncertainty (0.08). There is no evidence that varies from the solar value. In the present paper we adopt and .
Age estimates of NGC 6253 have yielded values from 3.0 Gyr (Bragaglia et al. 1997) to 5.0 Gyr (Piatti et al. 1998). An intermediate value of 3.5 Gyr was obtained by Montalto et al. (2009) and Sagar et al. (2001). Confidence in all these estimates is lowered by significant discrepancies in the photometric results. As we show in Paper I, at most one of the four sets of photometry was correctly transformed to the standard system. Another problem is the interstellar reddening, which essentially all authors attempted to determine simultaneously with the age of the cluster by means of isochrone fitting. Additional complications arise from the poorly defined red giant branch of NGC 6253 and a high contamination of the cluster field by background and foreground stars. The astrometric study by Montalto et al. (2009) provided a list of likely cluster members; however it also demonstrated that on the vector-point diagram the members are poorly separated from the field population.
In Paper I, we reported the results of an extensive photometric survey of NGC 6253 as part of a search for variable stars. Two new detached eclipsing binaries were discovered at the turnoff region of the cluster, and another one on the subgiant branch. These systems can be used to independently determine the age and distance modulus of NGC 6253 as proposed by (Paczyński 1997). We also obtained good phase coverage for another turnoff binary, discovered by Montalto et al. (2011). This object, their star #45368 and our variable V15, is a well-detached SB2 system for which they found approximate parameters based on three velocity measurements. Based on 15 good quality spectra of V15, we report in this paper a substantial refinement of the solution obtained by Montalto et al. (2011).
2 Observations
2.1 Photometry
Our photometric observations of V15 consist of two data sets secured at Las Campanas Observatory. observations collected with the 1.0-m Swope telescope and the SITE3 CCD camera are described in detail in Paper I. Additional data were obtained on the 2.5-m du Pont telescope equipped with the SITE2 camera providing a scale of 0.26 arcsec/pixel. Profile photometry was extracted with the Daophot/Allstar utility (Stetson 1987). Since the field of NGC 6253 is only moderately crowded, the quality of the profile photometry was comparable to that obtained with the image subtraction technique. Moreover, the profile photometry practically eliminated any zero-point differences measured between the du Pont and Swope data. The instrumental magnitudes were transformed to the standard values using stars observed by Sagar et al. (2001). A detailed justification for this choice of secondary standards is given in Paper I.
The light curves of V15 turned out to be unstable; most likely due to chromospheric activity. Such instabilities are common for short period binaries composed of low-mass stars with convective envelopes. We detected variations both in and out of the eclipses, with amplitudes reaching 0.03 mag in . Upon averaging over seasonal light curves we found mag and mag at quadratures.
Altogether, 13 eclipses of V15 were observed between 2007 August 7 and 2013 September 13. However, only for a few of these were both ingress and egress covered, which would allow for precise timing. This prevented us from a classical period study based on the determination of individual moments of eclipses and the O-C technique. We began by assuming d as found in Paper I and, keeping this value fixed, we obtained the photometric solution described in Section 3. To refine the period, a combined light curve including data from all seasons and both telescopes was used, with seasonal light curves adjusted in magnitude to assure a consistent level of the maximum light. The combined curve was fitted with the JKTEBOP code†††available at http://www.astro.keele.ac.uk/jkt/codes/jktebop.html (Southworth et al. 2004), allowing only for variations of and the moment of primary eclipse . Mode 8 of the code was used, which enabled a robust determination of the errors of the two parameters with the help of a Monte Carlo algorithm. We obtained the linear ephemeris
| (1) |
where numbers in parentheses are the uncertainties of the last significant digits. This refined period was then used to calculate updated geometric parameters. These turned out to be insignificantly different from those reported in Section 3. No evidence for any variability of was found. The refined period is 65.7 s shorter than that found by Montalto et al. (2011). Their result was based on four eclipses, all only partially covered during the ingress. This difference is large enough to cause a profound dephasing of seasonal light curves when their period is used.
2.2 Spectroscopy
Our radial velocity data are based on observations obtained with the blue channel of the MIKE Echelle spectrograph (Bernstein et al. 2003) on the Magellan Clay telescope between 2010 June 7 and 2011 July 29 (UT). Most of the observations consisted of two 1200 s exposures interlaced with an exposure of a Th/Ar lamp (depending on observing conditions, some exposures were shorter or longer). For all observations a arcsec slit was used, and pixel binning was applied. For nm the resolution was 2.7 pixels at a scale of 0.0043 nm/pixel. The typical S/N ratio at the same was 45. The spectra were processed using a pipeline developed by Dan Kelson following the formalism of Kelson (2003).
A total of 15 spectra were used for the analysis. The velocities were measured using software based on the TODCOR algorithm of Zucker & Mazeh (1994), kindly made available by Guillermo Torres. Synthetic echelle-resolution spectra from the library of Coelho et al. (2005) with and [/Fe]=0.0 were used as velocity templates. The templates were Gaussian-smoothed to match the resolution of the observed spectra. All velocities were measured on the wavelength range 400 – 460 nm. Results of the measurements are presented in Table 1.
3 Analysis of velocity and light curves
A nonlinear least-squares fit to the observed velocity curves of V15 was obtained with the help of code kindly made available by Guillermo Torres. Since the secondary minimum occurs at phase 0.5, the orbital eccentricity was fixed at zero while fitting. Observations and orbital solutions are shown in Fig. 1, and the derived orbital parameters are listed in Table 2 together with formal errors returned by the fitting routine. The table also lists standard deviations from the orbital solution and which are a measure of the precision of a single velocity measurement. We note that the derived systemic velocity of V15 agrees well with the mean radial velocity of NGC 6253, which according to Montalto et al. (2011) is equal to km/s.
For the photometric analysis we selected six seasonal curves distinguished by low dispersion and relatively high symmetry. The analysis was performed with the PHOEBE implementation (Prša & Zwitter 2005) of the Wilson-Devinney model (Wilson & Devinney 1971; Wilson 1979) which offers the possibility of simultaneous fitting of and light curves. Linear limb darkening coefficients were interpolated from the tables of Claret (2000) with the help of the JKTLD code.‡‡‡Written by John Southworth and available at www.astro.keele.ac.uk/jkt/codes/jktld.html.
The color of V15 remains nearly constant at all phases, indicating nearly equal temperatures of the components. The map of galactic extinction by Schlafly & Finkbeiner (2011) predicts mag at the location of NGC 6253. However, the amount of foreground extinction is not known (Anthony-Twarog et al. 2010), and values ranging from mag (Bragaglia et al. 1997) to mag (Montalto et al. 2009) can be found in the literature. Thus a direct estimation of the temperature from the dereddened color is not feasible. Our procedure, based on Dartmouth isochrones (Dotter et al. 2008) fitted to the CMD of the cluster (see Section 4), yields 5830 K and this is the value we adopt for both the primary and the secondary, and , at the start of the PHOEBE iterations.
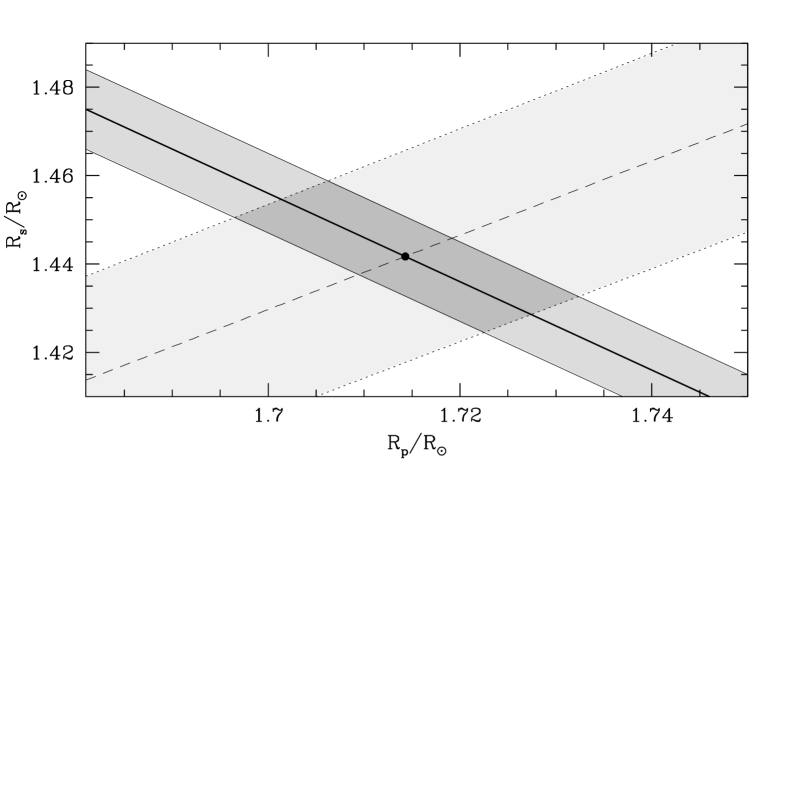
The eclipses of V15 are partial, moderately deep (0.26 mag) and almost equal in depth, which causes a well-known degeneracy in the light-curve solutions (Russell & Merrill 1952). Keeping fixed and iterating for , orbital inclination and surface potentials (, ) we obtained a range of equally good fits for which the sum of the component radii was nearly constant at R⊙. A pair of such fits is shown in Fig. 2. Photometric solutions with R⊙ occupy a stripe signified by the grey colored region in Fig. 3.
To remove the degeneracy we calculated a series of synthetic spectra of V15, again using the library of Coelho et al. (2005). The spectra retrieved from the library were rotationally broadened (a synchronous rotation of both components was assumed) and Doppler-shifted to the velocities of the primary and secondary listed in Table 1. These pairs of spectra corresponding to a given phase were then combined in various proportions and compared to the observed spectrum taken at the same phase. The comparison was performed separately for 15 different spectral ranges between 408 and 496 nm, each 3 nm long (we decided to compare short segments of the spectra rather than the whole available range in order to account for the varying mean intensity). For each phase and each segment the best value of the total secondary-to-primary light ratio was found by minimizing the sum of squared differences in synthetic and observed spectrum intensity. For further analysis the mean value of light ratios thus obtained, , was used. From one can derive the ratio of the radii of the components of the binary
where
is the Planck function and is the spectral sensitivity of MIKE’s blue arm. Since the difference between and is small, we can write
We found that the correction introduced by the temperature factor was smaller than 0.005 and could be neglected. Thus, the spectroscopic data impose a condition which on the plane defines a stripe marked with the light grey color in Fig. 3. The best solution is defined by the intersection of lines R⊙ and . At the intersection we have R⊙ and , where the errors are defined by the corners of the dark-grey quadrangle in Fig. 3. The remaining parameters of the best photometric model of V15 can be found in Table 3, and the final fits to the observed light curves are shown in Fig. 4. The errors of , , and given in Table 3 are based on 20,000 Monte Carlo simulations performed with the help of a procedure written in PHOEBE-scripter after that outlined in the description of the JKTEBOP code (Southworth et al. 2004, and references therein). Upon combining data from Tables 2 and 3 we obtained the absolute parameters of V15 listed in Table 4.
We finish this Section with a word of caution. One should be very careful when dealing with light curves similar to that of V15, as accepting the first solution found may lead one completely astray. The problem becomes especially acute when automatic light-curve solvers are applied.
4 Discussion
Fig. 5 shows the color-magnitude diagram of NGC 6253 to which Dartmouth isochrones with [Fe/H] = +0.46 and [/Fe]=0.0 are fitted. Simultaneous fitting of unevolved main sequence, turnoff region, subgiant branch and giant branch turned out to be impossible. Similar problems had been encountered earlier by Anthony-Twarog et al. (2007), Montalto et al. (2009), and Anthony-Twarog et al. (2010). Since uncertainties of stellar models grow larger with evolutionary time, we decided to assign the largest weight to main sequence and turnoff. We found the latter to be nearly entirely contained between isochrones for 3.9 and 4.6 Gyr, with that for 4.25 Gyr running through its center (Fig. 5). The mean turnoff temperature obtained from the three curves amounts to 5830 K with the caveat that the fit yields mag, i.e. a value lower than the lowest used so far. Keeping this in mind, we performed a consistency check using dereddended color index of the cluster and color-temperature calibration of Sousa et al. (2011) which is valid for [Fe/H/], mag and K. Applying this calibration to [Fe/H] = +0.46 and mag yields K – a value consistent with the assumed one within the 1- range of the calibration, equal to 52 K.
Fig. 5 also shows the location of V15 and its components on the CMD of the cluster. Both the primary and the secondary are located at the turnoff, with the primary being slightly more evolved. The activity of V15 suggests that its components might be cooler and larger than inactive stars of the same mass and at the same evolutionary phase (see e.g. Morales et al. 2008). However, there are good reasons to believe that they are quite normal. First, none of our spectra shows emission in Ca II H & K or the Balmer lines. Second, both components are located close to the blue edge of the turnoff, whereas one would expect them to be shifted to the red if their sizes and temperatures are affected by the activity.
The apparent distance modulus obtained from the isochrone fit is 11.65 mag. This is nearly the mean of values found by the other authors, which range from 10.9 mag (Sestito et al. 2007) to 12.2 mag (Twarog et al. 2003).
Almost all ages reported so far for NGC 6253 range from 2.5 Gyr (Anthony-Twarog et al. 2007) to 3.5 Gyr (Montalto et al. 2009), the sole exception is an age of 5 Gyr found by Piatti et al. (1998). Our attempts to fit Dartmouth isochrones for those ages failed completely. For the younger ages the discrepancy between theoretical turnoff temperature and temperature obtained from the calibration was too large, while for the older ages the reddening became unreasonably small ( mag). Further support for our CMD fit comes from the mass-radius diagram shown in Fig. 6, where error boxes of both components are contained between isochrones for 3.8 Gyr and 4.25 Gyr. As the mass-radius relation is free from uncertainties in distance and extinction that plague ages derived via isochrone fitting, we regard this estimate as very reliable. The data are also compatible with 3.8 Gyr and 4.25 Gyr isochrones in the mass-luminosity diagram (Fig. 6) , but because of the way the temperature was estimated this result cannot be regarded as an independent verification.
The recently published BT-Settl model atmospheres (Allard 2014) produce bluer isochrones than those from the Dartmouth database. We obtained several such isochrones and repeated CMD and mass-radius fitting. The age derived from the mass-radius diagram did not change; essentially the same age as before (3.8-4.5 Gyr) was also derived from the CMD fit. However, the distance modulus and reddening changed to 11.45 mag and 0.13 mag, respectively. The overall agreement of isochrones with the data did not improve. While most objects on the subgiant branch fell within the area bordered by 3.8 Gyr and 4.5 Gyr lines (as opposed to Fig. 5, where most of them lie above the 3.9 Gyr line), all BT-Settl isochrones missed the ”blue clump” composed of seven stars surrounding the location of the binary. The O-C discrepancy on the giant branch remained as large as before, however the theoretical colors were bluer than the observed ones.
Brogaard et al. (2012) extensively discuss problems related to the theoretical relation between colours and effective temperatures, which are a major uncertainty when comparing observations to stellar models in the CMD. The problem becomes especially acute at high metallicities, where a significant contribution to opacity comes from metals with poorly known abundances. Brogaard et al. (2012) explicitly warn that a good match between models and the observed CMD is likely to be more of a coincidence than a reflection of reality. Obviously, the same may be true regarding age estimation based on CMD fitting. Indeed, the agreement between ages derived for V15 from CMD and mass-radius diagram is so good that a suspicion arises it might be spurious. Although age determination from the mass-radius diagram is a relatively safe procedure, it is clear that our results should be verified.
In Paper I we reported a discovery of additional three detached eclipsing binaries in NGC 6253, two of which are proper motion members of the cluster (PM data are missing for the third one). All these systems are bright enough ( mag) for detailed spectroscopic studies. Solving for their light and velocity curves would create a very valuable benchmark against which stellar evolution codes could be tested in the high metallicity regime through mass-radius and mass-luminosity comparisons. Furthermore, a significant improvement in CMD fitting is possible provided that better proper motion and radial velocity data will be collected (the presently available ones are not sufficient to select cluster members with confidence; see Fig. 5). Future observations should also determine the reddening in a way independent of isochrone fitting. Anthony-Twarog et al. (2010) discuss this issue in detail, and show that the task is by no means easy.
5 Summary
Based on photometric and spectroscopic observations of the detached eclipsing binary V15 in NGC 6253 we derived absolute parameters of its components. Both the primary and the secondary are located at the turnoff of the cluster, making them suitable for an age estimate from the mass-radius diagram. Using Dartmouth isochrones we find NGC 6253 to be 3.80 – 4.25 Gyr old - a range of ages compatible with 3.9 – 4.6 Gyr derived from CMD fitting. Both these estimates are significantly higher than those reported so far, which with one exception do not exceed 3.5 Gyr. The apparent distance modulus found from CMD fitting amounts to 11.65 mag and it agrees well with 10.9 – 12.2 mag derived by other authors; however the reddening (0.113 mag) is lower than the lowest published value (0.15 mag). We confirm earlier conclusions that models of metal-rich atmospheres are not accurate enough to account for the whole CMD of the cluster, with the largest discrepancies appearing at advanced evolutionary phases. Although age estimation from the mass-radius diagram is a relatively safe, distance- and reddening-independent procedure, we stress the need to verify our results by photometric and spectroscopic observations of three detached eclipsing binaries discovered by Kaluzny et al. (2014), at least two of which are proper-motion members of NGC 6253.
Acknowledgements. JK, WN, WP and MR were partly supported by the grant DEC-2012/05/B/ST9/03931 from the Polish National Science Center.
REFERENCES
-
Allard, F. 2014, IAU Symp., 299, 271.
-
Anthony-Twarog B. J., Twarog, B. A. and Mayer, L. 2007, Astron. J., 133, 1285.
-
Anthony-Twarog B. J., Deliyannis C. P., Twarog B. A., Cummings J. D. and Maderak R.M. 2010, Astron. J., 139, 2034.
-
Bernstein, R., Shectman, S. A., Gunnels, S. M., Mochnacki, S., and Athey, A. E. 2003, Instrument Design and Performance for Optical/Infrared Ground-based Telescopes, eds. Masanori Iye and Alan F. M. Moorwood. Proceedings of the SPIE, 4841, 1694.
-
Brogaard, K., VandenBerg, D. A., Bruntt, H., Grundahl, F. Frandsen, S. et al. 2012, Astron. Astrophys., 543, A106.
-
Bragaglia, A., Tessicini, G., Tosi, M., Marconi, G. and Munari, U. 1997, MNRAS, 284, 477.
-
Carretta, E., Bragaglia, A., and Gratton, R. 2007, Astron. Astrophys., 473, 129.
-
Claret, A. 2000, Astron. Astrophys., 363, 1081.
-
Claret, A. 2007, Astron. Astrophys., 467, 1389.
-
Coelho, P., Barbuy, B., Meléndez, J., Schiavon, R. P. and Castilho, B. V. 2005, Astron. Astrophys., 443, 735.
-
Dotter, A., Chaboyer, B., Jevremović, D. et al. 2008, Astrophys. J. Suppl. Ser., 178, 89.
-
Kaluzny, J., Rozyczka, M., Pych, W. and Thompson, I. B. 2014, Acta Astron., 64, 77 (Paper I).
-
Kelson, D. D. 2003, P.A.S.P., 1125, 688.
-
Mikolaitis, Š., G. Tautvaišienė, G., Gratton, R., Bragaglia, A. and Carretta, E. 2012, Astron. Astrophys., 541, A137.
-
Montalto, M., Piotto, G., Desidera, S., Platais, I, Carraro, G. et al. 2009, Astron. Astrophys., 505, 1129.
-
Montalto, M. N., Santos, N. C., Villanova, S., Pace, G., Piotto, G. et al. 2012, MNRAS, 423, 3039.
-
Montalto, M., S. Villanova, S., Koppenhoefer, J., Piotto, G. Desidera, S. et al. 2011, Astron. Astrophys., 535, A39.
-
Morales J. C., Ribas I. and Jordi C. 2008, Astron. Astrophys., 478, 507.
-
Paczyński 1997, in Space Telescope Science Institute Series, The Extragalactic Distance Scale, ed. M. Livio (Cambridge: Cambridge Univ. Press), , p. 273.
-
Piatti, A. E., Clariá, J. J., Bica, E. Doug Geisler, D. and Minniti, D. 1998, Astron. J., 116, 801.
-
Prša, A., and Zwitter, T. 2005, ApJ, 628, 426.
-
Russell, H. N., and Merrill, J. E. 1952, Contributions from the Princeton University Observatory, 23-26, .
-
Schlafly, E. F. and Finkbeiner, D. P. 2011, Astrophys. J., 737, 103.
-
Sagar, R., Munari, U., de Boer, K. S. 2001, MNRAS, 327, 23.
-
Sestito, P., Randich, S. and Bragaglia, A. 2007, Astron. Astrophys., 465, 185.
-
Southworth, J., Maxted, P. F. L. and Smalley, B. 2004, MNRAS, 349, 547.
-
Sousa, S. G., Santos, N. C., Israelian, G., Lovis, C., Mayor, M. et al. 2011, Astron. Astrophys., 526, A99.
-
Stetson P. B. 1987, P.A.S.P., 99, 191.
-
Twarog, B. A., Anthony-Twarog, B. J. and De Lee, N. 2003, Astron. J., 125, 1383.
-
Wilson, R. E. 1979, Astrophys. J., 234, 1054.
-
Wilson, R. E., and Devinney, E. J. 1971, Astrophys. J., 166, 605.
-
Zucker, S., and Mazeh, T. 1994, Astron. J., 420, 806.
| HJD | Phase | ||||
|---|---|---|---|---|---|
| -2450000 | [km/s] | [km/s] | [km/s] | [km/s] | |
| 5354.59687 | 56.61 | -120.07 | 0.840 | -0.72 | -0.15 |
| 5354.81742 | 17.45 | -77.63 | 0.925 | 0.18 | -0.18 |
| 5355.62665 | -130.44 | 78.70 | 0.240 | -0.18 | -0.25 |
| 5388.72531 | -91.68 | 38.97 | 0.107 | 0.27 | 0.64 |
| 5389.51319 | -81.33 | 27.85 | 0.413 | 0.27 | 0.49 |
| 5457.55448 | 49.27 | -110.26 | 0.863 | 0.97 | 0.09 |
| 5458.47928 | -129.19 | 77.62 | 0.223 | -0.20 | 0.02 |
| 5459.48720 | 37.94 | -100.56 | 0.615 | -0.50 | -0.66 |
| 5763.64679 | 51.86 | -115.00 | 0.854 | -0.34 | -0.52 |
| 5764.61295 | -129.86 | 77.45 | 0.229 | -0.25 | -0.80 |
| 5770.73991 | 37.08 | -97.38 | 0.611 | 0.39 | 0.66 |
| 5836.49309 | -118.38 | 67.40 | 0.172 | 0.10 | 0.94 |
| 6096.58400 | -128.34 | 77.07 | 0.280 | 0.36 | -0.22 |
| 6096.80512 | -103.62 | 51.89 | 0.366 | 1.13 | -0.01 |
| 6097.66008 | 67.25 | -131.80 | 0.698 | -0.42 | -0.92 |
| Parameter | Value | Error |
|---|---|---|
| (km s-1) | -28.73 | 0.011 |
| (km s-1) | 101.61 | 0.20 |
| (km s-1) | 108.06 | 0.19 |
| 0.9403 | 0.0027 | |
| 0.0a | ||
| (km s-1) | 0.51 | |
| (km s-1) | 0.54 | |
| Derived quantities: | ||
| (R⊙) | 10.657 | 0.015 |
| (M⊙) | 1.2662 | 0.0055 |
| (M⊙) | 1.1906 | 0.0056 |
aAssumed in fit
| Parameter | Value | Error |
|---|---|---|
| (deg) | 82.14 | 0.06 |
| 1.714 | 0.018 | |
| 1.441 | 0.018 | |
| 0a | ||
| (K) | 5830a | |
| (K) | 5842 | 10 |
| 1.403 | 0.033 | |
| 1.393 | 0.034 | |
| (mmag) | 7 | |
| (mmag) | 7 | |
| (mag) | 15.297 | 0.012b |
| (mag) | 15.665 | 0.016b |
| (mag) | 16.137 | 0.012b |
| (mag) | 16.497 | 0.016b |
| (mag) | 0.840 | 0.017b |
| (mag) | 0.832 | 0.023b |
aAssumed.
bIncludes errors from photometric solution and
profile photometry.
| Parameter | Value | Error |
|---|---|---|
| (M⊙) | 1.303 | 0.006 |
| (M⊙) | 1.225 | 0.006 |
| (R⊙) | 1.714 | 0.018 |
| (R⊙) | 1.441 | 0.018 |
| (K) | 5830a | |
| (K) | 5842 | 10 |
| (L⊙) | 3.05 | 0.10 |
| (L⊙) | 2.17 | 0.06 |
| (R⊙) | 10.758 | 0.017 |
| (d) | 2.5724149 | 3 |
aAssumed.