Revisiting defect-induced magnetism in graphite through neutron irradiation
Abstract
We have investigated the variation in the magnetization of highly ordered pyrolytic graphite (HOPG) after neutron irradiation, which introduces defects in the bulk sample and consequently gives rise to a large magnetic signal. We observe strong paramagnetism in HOPG, increasing with the neutron fluence. The induced paramagnetism can be well correlated with structural defects by comparison with density-functional theory calculations. In addition to the in-plane vacancies, the trans-planar defects also contribute to the magnetization. The lack of any magnetic order between the local moments is possibly due to the absence of hydrogen/nitrogen chemisorption, or the magnetic order cannot be established at all in the bulk form.
I Introduction
Defect induced magnetism in carbon based materials gives many attractive perspectives in the fundamental understanding of magnetism as well as in future spintronic applications. As early as 2003 highly ordered pyrolytic graphite (HOPG) was reported to be ferromagnetic after proton irradiation Esquinazi et al. (2003), which provides an approach to control the defect-induced magnetism in graphite both concerning strength and in lateral distribution. After that, successive investigations were performed for testing the reliability of the ferromagnetism in graphite Talapatra et al. (2005); Lee and Lee (2006); Xia et al. (2008); Červenka et al. (2009); Yang et al. (2009); Makarova et al. (2011); He et al. (2011a); Shukla et al. (2012) and for finding other carbon-based ferromagnetic materials Makarova et al. (2003); Han et al. (2003, 2005); Mathew et al. (2007); Höhne et al. (2007); Ma et al. (2012). As a consequence, the investigation on defect induced magnetism in semiconductors has been greatly stimulated Xing et al. (2009); Zhou et al. (2009); Pan et al. (2007); Yi et al. (2010); Liu et al. (2011); Roever et al. (2011). So far experiments and theory show the following common features:
-
1.
Paramagnetism can be greatly enhanced by introducing defects in graphite or graphene Ramos et al. (2010); Ney et al. (2011); Nair et al. (2012). Some research groups conclude that these paramagnetic centers do not show any magnetic ordering down to 1.8 or 2 K Sepioni et al. (2010); Ney et al. (2011); Nair et al. (2012).
- 2.
- 3.
- 4.
However, as to our knowledge, the research has focused mostly on thin-film like samples: ion implanted graphite with nm–m affected thickness or graphene flakes. The as-measured magnetization is always in the range of 10-6–10-5 emu per sample Esquinazi et al. (2003); Zhou et al. (2009); Ramos et al. (2010); He et al. (2012); Liu et al. (2011); Roever et al. (2011). The small magnetization renders data interpretation controversial as shown in a recent intensive discussion on the potential contamination in graphite Esquinazi et al. (2010); Sepioni et al. (2012a); Spemann et al. (2012); Sepioni et al. (2012b); Spemann et al. (2013); Venkatesan et al. (2013) as well as on artificial effects in magnetometry Sawicki et al. (2011); Pereira et al. (2011). Moreover, the implanted ions, especially those that differ chemically from the substrate, will stay in the matrix as foreign atoms and an interface will naturally form between the implanted region and the untouched substrate. Both the interface and the implanted ions will make it difficult to unambiguously identify the defect type and hamper the interpretation of the mechanism for the observed magnetization. To avoid these problems we use neutron irradiation. Neutrons have a much stronger penetrating capability than ions and will generate defects throughout the whole sample. In this way, the foreign ion effect and the interface effect can be excluded in the present study. Therefore, the application of neutron irradiation could be a promising method to clarify the long standing question regarding the origin of the defect induced magnetism in graphite in the following aspects.
-
•
To verify whether the defect induced paramagnetism or ferromagnetism is a bulk effect or only a surface effect;
-
•
To make a correlation between magnetism and defects based on the strong magnetic signal and results from various structural analysis techniques.
Accordingly, our work has been performed in the following way. HOPG specimens were subjected to neutron irradiation, whereby the irradiation fluence is varied to induce defects in graphite from slight damage to near amorphization. The magnetic and structural properties have been measured by various techniques. The results were complemented with a theoretical interpretation of the role of in-plane defects from literature and from new first-principles calculations of magnetic states of trans-planar divacancy configurations.
The paper is organized as follows. In section II all experimental methods employed will be described. Then the results will be presented in three sub-sections. In section III.A, we present the large paramagnetism induced by irradiation and its dependence on the neutron fluence. In section III.B and C, the defect type and its concentration evolution will be discussed based on Raman and X-ray absorption spectroscopy, respectively. In section IV, we attempt to correlate the induced paramagnetic centers with in-plane vacancies and trans-planar defects by reviewing the literature data as well as by first-principles calculations. In the end of the discussion section, we also explain why the magnetic coupling between the induced moments is missing. The paper is finished with a short conclusion.
II Experimental methods
In the experiment, the used graphite samples were highly oriented pyrolytic graphite (HOPG) with a grade of ZYA, which are generally referred as graphite in this manuscript. Neutron irradiation was performed at the reactor BER II (Position DBVK) at Helmholtz-Zentrum Berlin Lin et al. (2003). During irradiation the temperature of the samples was less than 50 ∘C (see ref. Wendler et al., 2012). Four samples were irradiated with the fluences of 6.241017, 1.251018, 6.241018, and 3.121019 cm-2, which are named as 3H, 6H, 30H and 150H according to the irradiation time of 3 hours, 6 hours, 30 hours, 150 hours, respectively. The mechanism to produce crystal lattice defects by neutron irradiation is the elastic or inelastic scattering between neutrons and target nuclei. If the target nucleus gets enough energy after scattering, it will irreversibly displace the lattice atom from its original site, resulting in vacancies and interstitials. The minimum energy required to displace a carbon atom in graphite is around 25 eV Kelly et al. (2000). Therefore, we only consider the epithermal (0.5 eV – 100 keV) and fast neutrons (100 keV – 20 MeV) Bode (1996) in calculating the fluence. The elastic scattering dominates when the energy is below 5.5 MeV in carbon and the nuclear reaction (inelastic scattering) only becomes appreciable when the energy is above 9 MeV Kelly et al. (2000).
Magnetometry was performed using a SQUID-VSM (Quantum Design). The magnetic properties were measured regarding their dependences on magnetic field and on temperature. The structure change is characterized by Raman spectroscopy which is sensitive to defects in the aromatic ring, the edge state, the hybridization type, the interstitial ions, and also to the stacking orders, etc Pimenta et al. (2007). The -Raman system is equipped with a 532 nm wavelength laser and a liquid nitrogen cooled CCD detector working in backscattering geometry. X-ray absorption spectroscopy (XAS) will further detect the bonding state change resulting from neutron irradiation. The variations of the magnetization, the Raman scattering and the X-ray absorption at the carbon K-edge depending on the irradiation fluence allow us to clearly correlate the density of vacancies interstitials with the magnetism in the neutron irradiated graphite.
III Results and discussion
III.1 Magnetic properties
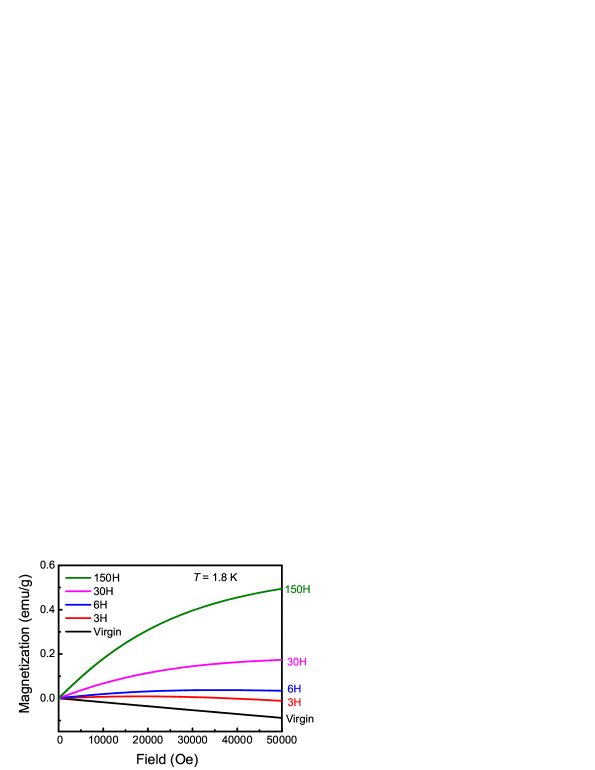
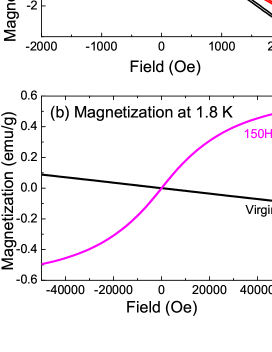
Figure 1 shows the magnetization measurements at 300 K and 1.8 K for the virgin and irradiated graphite without any background correction. For the virgin graphite, the diamagnetic background dominates the magnetic properties. A weak ferromagnetic hysteresis is observed already in the virgin graphite. It is probably caused by intrinsic defects Ohldag et al. (2010) or by Fe contamination Sepioni et al. (2012a); Spemann et al. (2012); Venkatesan et al. (2013). Moreover, the ferromagnetic contribution is not changed significantly upon neutron irradiation. Therefore, this weak ferromagnetism is not the topic of our study in this manuscript. Besides the marginal change in the ferromagnetic component, there is a huge increment of the magnetization at low temperature. Figure 1(b) shows the comparison of the magnetization measurement at 1.8 K for the virgin graphite and sample 150H. Sample 150H shows a large paramagnetic component which will be discussed in detail later. Note that the change in the slope of the MH curves in Fig. 1(a) is due to the large increase of the paramagnetism upon irradiation as shown. At low temperature, the weak ferromagnetism in the irradiated samples is dominated by the paramagnetism and not resolvable.
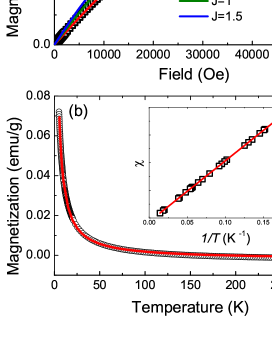
The field dependence of the magnetization at 1.8 K for all samples is shown in Fig. 2. Neutron irradiation leads to strong paramagnetism. The graphite sample is changed completely from diamagnetic-like to paramagnetic-like with increasing neutron fluence. However, even for the sample with the highest neutron fluence, the magnetization is not saturated at 1.8 K up to a field of 50000 Oe. In our experiment, the measured absolute magnetic moment for a graphite sample of around 44 mm2 is in the range of 0.001-0.01 emu at 1.8 or 5 K. This value is much larger than the previously reported ion implanted samples with a magnetic moment of around 10-5–10-6 emu Esquinazi et al. (2003); Zhou et al. (2009); Ramos et al. (2010); He et al. (2012) and is far above the sensitivity of SQUID-VSM. As shown in Fig. 3(a), the induced paramagnetism can be precisely described by the standard Brillouin function after removing the residual diamagnetic background and the intrinsic paramagnetic contribution from the virgin graphite:
| (1) |
where the factor is about 2 obtained from electron spin resonance measurement (not shown), is Bohr magneton, , is the the Boltzmann constant and N is the density of spins. The Brillouin function provides excellent fits for J = 0.5, which corresponds to single electrons as charge carries and N = 81019 /mg for sample 150H. The fits using larger J unequivocally deviate from the shape of the measured M-H curves, as they give significantly different, sharper changes with faster saturation.
The Curie law
| (2) |
with = 0.5 and = 81019 /mg inferred from Fig. 3(a) also gives a good fit to the temperature dependent magnetization as shown in Fig. 3(b). The inset of Fig. 3(b) shows the inverse susceptibility versus temperature, revealing a linear, purely paramagnetic behavior with no indication of magnetic ordering.
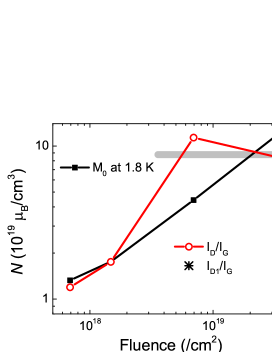
Figure 6 (shown later in the paper) shows the density of paramagnetic centers obtained by fitting the magnetization measured at 1.8 K for different samples as a function of neutron fluence in double logarithmic scale. With increasing neutron fluence, i.e. the amount of defects, more and more paramagnetic centers are generated. This indicates that even the most strongly irradiated sample is still not totally amorphous.
We also noted the work by Ramos et al. Ramos et al. (2010) Using ion implantation to introduce defects into graphite, they reported an anomalous paramagnetic contribution. This contribution remains independent of temperature up to 100 K, whereas the field dependent magnetization shows neither saturation nor any nonlinearity Ramos et al. (2010). Meanwhile theoretical calculations also pointed out that if sufficient carbon adatoms were available, they could weakly agglomerate in graphene and superparamagnetism can be finally observed Gerber et al. (2010). However, in our experiment the magnetic properties for all samples can be well described by spin 1/2 paramagnetism without superparamagnetic contributions. As expected if the whole volume contributes, in our experiment the as-measured magnetization signal is as large as 0.001–0.01 emu per sample. The large magnetization signal allows us to draw reliable conclusions and to exclude any spurious and anomalous paramagnetic contribution.
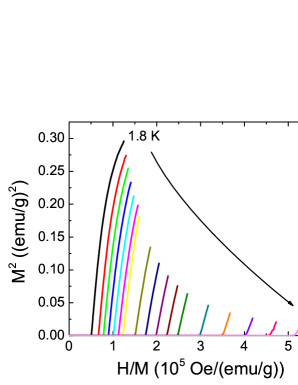
To further exclude a possible ferromagnetic ordering in our sample we measured the magnetization vs. field at different temperature to perform an Arrott plot analysis Arrott (1957). This method is usually used to accurately determine the Curie temperature and to verify the paramagnetic to ferromagnetic phase transition. Such an analysis is based on the relationship derived by Wohlfarth Wohlfarth (1968)
| (3) |
Note that this relationship results in parallel lines of the isothermal which cross zero () in the vicinity of . Figure 4 shows the isothermal magnetization Arrott plot for sample 150H (irradiated up to the highest fluence). The measurement temperatures range from 1.8 K to 20 K. With increasing temperature, the magnetization decreases, but none of the lines crosses the zero point (). It confirms that down to 1.8 K no magnetic order appears in this sample. It is purely paramagnetic.
III.2 Raman spectroscopy
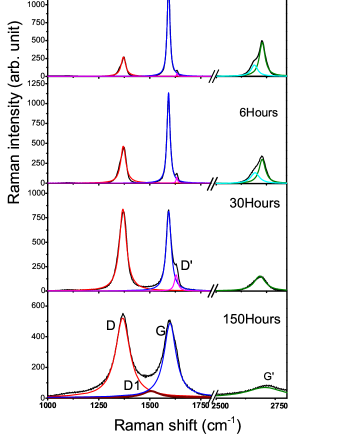
Figure 5 shows the Raman spectra of graphite samples after neutron irradiation. From top to bottom are the virgin sample and samples 3H…150H, respectively. A linear background has been removed.
The reference sample shows the peaks typical for the high-quality HOPG Pimenta et al. (2007); He et al. (2011b). The G peak located at around 1590 cm-1 corresponds to the inherent E2g mode of the aromatic ring. The D peak around 1360 cm-1 represents an elastic scattering at defects in crystal Elman et al. (1982); Pimenta et al. (2007); He et al. (2011b); Xing et al. (2013).
Upon neutron irradiation, the most pronounced changes occur in the D peak and in its overtone G’ peak (2D peak): the D peak rises with irradiation fluence and becomes as strong as the G peak. Two pronounced changes will be described in the following.
III.2.1 In-plane vacancies
The increase of peak D is generally attributed to the in-plane vacancies in graphite Elman et al. (1982); Pimenta et al. (2007); He et al. (2011b); Xing et al. (2013). By independent methods such as X-ray diffraction and transmission electron microscopy, the intensity ratio between D and G peaks has been confirmed as a measure of the in-plane grain size. Neutron irradiation induces a large number of interstitial and vacancy pairs (I-V). Most of I-V defects will recombine simultaneously and the remaining species can form various defects. Since a high energy barrier blocks the diffusion of vacancies, most vacancies become in-plane vacancies or form vacancy clusters. The interstitial atoms prefer staying in the region between the layers owing to the energetically highly unfavorable interstitial in-plane position Telling and Heggie (2007). In Figure 6, we plot the fluence dependent ID/IG (the intensity ratio between D and G peaks). In our samples, the strength of the D peak increases with the neutron fluence when the irradiation time is less than 30 hours. Further increasing the neutron fluence, ID/IG reaches a saturation value. It indicates that with increasing the irradiation time from 3 hours to 30 hours the density of vacancies is continuously increasing until the vacancies reach a saturation density. Such behavior was observed in ion irradiated or ball milled graphite Elman et al. (1982); Xing et al. (2013).
III.2.2 Out-of-plane defects
The G’ peak around 2720 cm-1 is the overtone of the D peak. It is often referred as the 2D peak and is very sensitive to the c-axis stacking order of graphite. The line shape and intensity of G’ are signatures of the stacking of graphene layers. For bulk graphite consisting of an …ABAB…stacking, the G’ peak is composed of two peaks. When the stacking is absent, the interaction between the planes is very weak and they behave as two-dimensional crystals. For a single graphene layer, the G’ peak is composed of a single peak Pimenta et al. (2007). For our experiment, in the virgin sample the interaction between the layers in 3D graphite makes the G’ peak to be split into G’1 and G’2. When the irradiation time is less than 6 hours, two peaks can fit the spectra, but their strength becomes weak with increasing irradiation fluence. This indicates a slight crystalline damage in the graphene sheet stacking. The influence of shear moments caused by the interstitial atoms between the two sheets is less notable for irradiation times of less than 6 hours. When the irradiation time is over 30 hours, G’1 and G’2 peaks decease strongly and mix into a single weak peak. This is attributed to the out-of-plane defects in graphite Makarova et al. (2008); He et al. (2011b). With increasing neutron fluence, more interstitial atoms are assumed to diffuse into regions between the graphene sheets so that the distance between the sheets increases strongly enough, such that the graphene sheets behave like an isolated single graphene sheet. The appearance of the D1 peak at around 1500 cm-1 for sample 150H is another indication for the interstitial atoms between graphene sheets Jawhari et al. (1995); He et al. (2011b). At low fluence range, the D1 peak is too weak to be fitted even for samples 30H. The D1 peak was also observed in ion implanted graphite when the implantation fluence is large enough He et al. (2011b).
This Raman analysis allows us to define two regimes for the four reported fluences. In the first regime (3H, 6H and 30H) defects are created in plane without interaction between neighboring planes. In the second regime (30H and 150H), the latter interaction becomes a dominant effect and trans-planar defects (interstitial or vacancy) are expected to play a major role: due to the high defect concentration, newly created defects are expected to combine with pre-existing defects in the neighboring planes as revealed by the rather saturated value of in the second fluence regime. Interestingly, these transplanar defects seem also contribute to the total magnetization.
III.3 X-ray absorption spectroscopy
To further probe the change in the electronic state in graphite after neutron irradiation from a microscopic point of view, we performed near-edge X-ray absorption fine structure spectroscopy (NEXAFS, Beamline 6.3.1 at the Advanced Light Source in Berkeley). The description of the experimental set up can be found in reference Ohldag et al., 2010. In our experiment, the incident light was inclined by 45∘ to the sample surface. The signals were collected in the total electron yield mode at room temperature. All the spectra are normalized by the input flux for comparison.
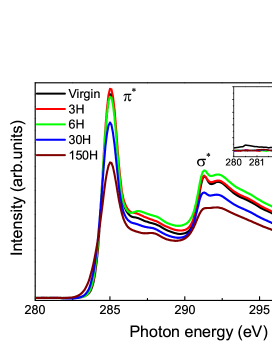
As shown in Fig. 7, there are two resonances around 285 eV and 292 eV, respectively. They correspond to the transitions from 1s core-level electrons to and empty states, respectively. For samples 3H and 6H with a small neutron fluence, there is no significant change either in the peak intensity or in the peak shape compared with the virgin sample. After the irradiation over 30 hours, the intensity of the peak decreases, which indicates that the aromatic system is severely perturbed. At the same time, the and features are becoming broader. In previous literature, it has been shown that the and resonances of carbon are much more broadened in proton implanted graphite than our case Ohldag et al. (2007, 2010).
The inset of Fig. 7 shows a zoom into the energy range 280–284 eV. Compared with previous results on ion implanted graphite He et al. (2012), the fundamental difference of our sample is the missing of a pre-edge peak at around 282 eV. In ref. He et al., 2012, a new small, but sizeable peak in the pre-edge region (281.5 eV to 284.5 eV), has been reported in ion implanted ferromagnetic graphite. This new peak was attributed to be closely related with defect states near the Fermi energy level, and it was temporarily assigned to rehybridized C-H bonds. The lack of rehybridized C-H bonds in our samples may explain the absence of ferromagnetism, which will be discussed later.
IV Discussion
We have investigated the magnetic and structural properties of graphite after neutron irradiation. Different from ion implantation, neutron irradiation can introduce defects in the whole graphite sample. The resulting magnetization is very large and allows one to draw a reliable conclusion free of the influence of contamination. Our experimental results lead to two conclusions: (1) only spin 1/2 paramagnetism is induced in graphite by neutron irradiation; and (2) both in-plane vacancies and out-of-plane defects appear after irradiation. In this discussion, we attempt to correlate the magnetization and defects and to understand why the magnetic ordering is lacking.
IV.1 The origin of the paramagnetism
Defect induced magnetism in both graphite and graphene has been intensively investigated theoretically. Structural defects, in general, can give rise to localized electronic states. It is well accepted that the in-plane vacancies are the origin of local magnetic moments Nair et al. (2012). Upon removal of one atom, each of the three neighboring atoms has one dangling bond. Two of the C atoms can form a pentagon, leaving one bond unsaturated. This remaining dangling bond is responsible for the magnetic moment. Moreover, the flat bands associated with defects lead to an increase in the density of states at the Fermi level. Lehtinen et al., used spin-polarized DFT and demonstrated that vacancies in graphite are magnetic Lehtinen et al. (2004b). They also found that hydrogen will strongly adsorb at vacancies in graphite, maintaining the magnetic moment of the defect. Zhang et al. Zhang et al. (2007) have confirmed that the local moments appear near the vacancies and with increasing vacancy accumulation the magnetization decreases non-monotonically. Using a combination of a mean-field Hubbard model and first principles calculations, Yazyev also confirmed that vacancies in graphite and graphene can result in net magnetic moments Yazyev (2008), while the preserved stacking order of graphene layers is shown to be a necessary condition for achieving a finite net magnetic moment of irradiated graphite. In most calculations, the moment per vacancy is sizeable up to 1–2 Lehtinen et al. (2004b); Zhang et al. (2007). Indeed, by scanning tunneling microscopy experiments, Ugeda et al. have observed a sharp electronic resonance at the Fermi energy around a single vacancy in graphite, which can be associated with the formation of local magnetic moments Ugeda et al. (2010).
In our neutron irradiated graphite, we observed a strong correlation between the magnetization and vacancies. Figure 6 shows the irradiation-fluence dependent magnetization and the values of / of the Raman spectra. At the low fluence regime, the density of magnetic moments shows an excellent correlation with / (the density of in-plane vacancies): both increase monotonically with the fluence. This indicates an agreement with the theoretical calculation: the vacancy in graphite results in local magnetic moment. In the next subsection, we discuss the role of out-of-plane defects.
IV.2 The role of trans-planar defects
As shown in Fig. 6, / reaches its saturation value of around 1.2–1.4 when the neutron fluence is higher. / of 1.2–1.4 is also a threshold of amorphisation in ion irradiated graphite Elman et al. (1982). Despite the saturation in the density of in-plane vacancies, the density of local moments still increases with neutron fluence as shown in Fig. 6. What is the contribution for these additional local magnetic moments? We consider the role of the trans-planar defects. As shown in Fig. 5, for the largest irradiation fluence, peaks appears, which has been attributed to the trans-planar defects He et al. (2011b). In order to assess the experimental findings described in the above sections, we have investigated the possible magnetic state for trans-planar defects.
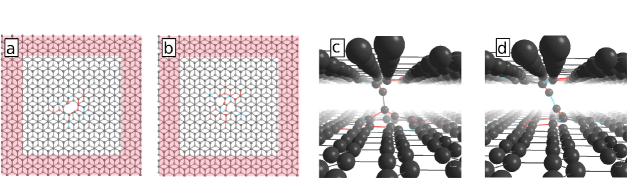
We start our analysis from the seminal work of Telling et al. Telling et al. (2003) who firstly propose the trans-planar divacancy configurations (see Figure 8) that breaks the symmetry rules in graphite. Interestingly, the spin-polarized states for these defects was discussed in the paper but never assessed. In order to answer this question without any artifacts we have decided to run additional spin-polarized calculations in a super-cell which is large enough to avoid elastic effects between neighboring defect images (in-plane). Systems containing 448 atoms per graphene sheets have proven to be reliable to study triangular vacancy clusters in hexagonal boron nitride sheets Machado-Charry et al. (2012) and are also used in the present study. Here, two of these sheets with Bernal stacking were considered. The distance between the two sheets was fixed to 6.45 Bohr radii () for simplifying the treatment of the interlayer. This is achieved by the freezing of the perpendicular displacements in a band close to the edges of the super-cell (pink area in Fig. 8). This treatment allows for a full relaxation both in-plane and out-of-plane of the central part of the super-cell where the defect sits. The PBE exchange and correlation function was chosen as it was found to well reproduce the in-plane relaxations Krishnan et al. (2013). The BigDFT Genovese et al. (2008) code was used to perform DFT calculations within surface boundary conditions Genovese et al. (2007).
The two trans-planar divacancies V and V are considered together with the in-plane divacancy V2 as a reference. The formation energy of the defect is calculated using the chemical potential of carbon in the pristine bilayer system. Singlet and triplet states are obtained by running spin averaged and spin polarized calculations, respectively. The results are summarized in table 1. The formation energy of the three defects increases in-line with the initial report of Telling et al. Telling et al. (2003). However, important differences arise, underlying the role of the in-plane relaxations that were blocked in the previously used 64 atoms box Telling et al. (2003). Indeed, while the estimated error of about 0.4 eV Telling et al. (2003) holds for the trans-planar vacancies, the difference is much more bigger for V2. As a consequence, the energy difference between the two trans-planar divacancies remains in the order of 1.5 eV.
| Samples | Ef (eV) | Espin (meV) |
|---|---|---|
| V2 in-plane | 7.55 (8.7) | 2 |
| V trans-planar | 13.85 (14.6) | 560 |
| V trans-planar | 12.77 (13.0) | 1 |
In Table 1 we also report the singlet to triplet formation energy for each defect. In line with the report of a double bond Telling et al. (2003) for the inter-planar C-C bond (see bond length scale in figure 8), the V divacancy is in a singlet state. This situation is different for the V divacancy: the inter-planar C-C bond is longer and more twisted, thus preventing further hybridization between the two carbon atoms. As a consequence, the triplet state is stabilized by more than 500 meV with respect to the singlet state. According to Telling et al., the existence of triplet states gives a solid explanation for the observed spin 1/2 paramagnetism.
IV.3 Why is the magnetic interaction missing?
As shown in Fig. 2 and Fig. 6, the paramagnetism in graphite can be strongly enhanced by irradiation induced defects. After irradiation even to the largest fluence, the samples are not fully amorphous and / of around 1.2 corresponds to a planar grain size of 3.5 nm Elman et al. (1982). Why is the magnetic interaction between the generated paramagnetic centers then missing? To answer this question, we first need to estimate the density of defects, i.e. the average distance between adjacent local moments.
Assuming the defects are homogeneously distributed in the sample matrix, we estimate the average distances () between local moments in our irradiated graphite samples. This value amounts to 2.2 nm for the sample with the largest neutron fluence. The nearest average distance between two spins is around 16 ( = 0.14 nm is the C-C bond length). Therefore, the direct coupling between the localized spins at the vacancies is nearly negligible. Alternatively, the Ruderman-Kittel-Kasuya-Yosida (RKKY) coupling is suggested to appear in defective graphite and graphene Yazyev and Helm (2007). This coupling might be ferromagnetic at a finite temperature when . If assuming a Fermi energy of 20 meV in graphite Barzola-Quiquia et al. (2007), the inverse of the Fermi wave vector 30 nm. To have ferromagnetic ordering, the distance between two spins should be 30 nm which corresponds to a spin density of 3.71018 cm-3. In principle, all samples fulfill this criteria. All these moments may tend to be ferromagnetically coupled via the RKKY coupling, although the Curie temperature can be very low Barzola-Quiquia et al. (2007). However, we do not observe any magnetic ordering down to 1.8 K even for sample 150H. It is not practical to further increase the defect density, since the stacking order of graphenes plane must be preserved Yazyev (2008); He et al. (2012). Our sample with the highest neutron fluence is already at the verge of amorphization. A larger irradiation fluence will perturb the graphene lattice too much and destroy the necessary band structure and carrier density.
Both published theory and experimental results suggest a crucial role of hydrogen or nitrogen chemisorption in enhancing the spin density and in establishing the magnetic coupling Lehtinen et al. (2004b); Zhang et al. (2007); Yazyev (2008); Barzola-Quiquia et al. (2007); Ohldag et al. (2010). All these moments from chemisorption will tend to be ferromagnetically coupled, enhancing the Curie temperature by the RKKY coupling. Recently, by careful angular dependent NEXAFS, He et al. observed a new small peak in the pre-edge region (281.5 eV to 284.5 eV) He et al. (2012). This new peak has been interpreted to be closely related with the defect states near the Fermi energy level and it is assigned to the formation of C-H bonds Ohldag et al. (2010). Ohldag et al. also observed an X-ray magnetic circular dichroism (XMCD) signal in the pre-edge region of the C K-edge. However, as shown in Fig. 7, our present findings do not exhibit any new peak in the pre-edge of the C K-edge. This may explain why the ferromagnetic coupling is missing.
V Conclusion
Neutron irradiation in graphite can induce a large amount of defects throughout the bulk specimens, consequently leading to a large measurable magnetization. This approach allows for a revisiting of defect induced magnetism in graphite by eliminating the influence of contamination or artificial effects. We conclude that only spin 1/2 paramagnetism is induced in neutron irradiated graphite. The creation of trans-planar vacancies (without dangling bonds) reduces the concentration of single in-plane vacancies. Complementing our study by first-principles calculations, we propose that both in-plane vacancies and trans-planar defects can form local magnetic moments, which are responsible for the observed 1/2 paramagnetism. The paramagnetism scales up with increasing the amount of defects, however, magnetic order unlikely can occur in a bulk form in defective graphite.
VI Acknowledgement
The work was financially supported by the Helmholtz-Gemeinschaft Deutscher Forschungszentren (VH-NG-713 and VH-VI-442). Y. Wang thanks the China Scholarship Council (File No. 2010675001) for supporting his stay at HZDR. The authors also acknowledge the support by the International Science and Technology Cooperation Program of China (2012DFA51430). The Advanced Light Source is supported by the U.S. Department of Energy under Contract No. DE-AC02-05CH11231. Calculations were performed using French HPC ressources from the GENCI-CCRT (grant 6194).
References
- Esquinazi et al. (2003) P. Esquinazi, D. Spemann, R. Höhne, A. Setzer, K.-H. Han, and T. Butz, Phys. Rev. Lett. 91, 227201 (2003).
- Talapatra et al. (2005) S. Talapatra, P. G. Ganesan, T. Kim, R. Vajtai, M. Huang, M. Shima, G. Ramanath, D. Srivastava, S. C. Deevi, and P. M. Ajayan, Phys. Rev. Lett. 95, 097201 (2005).
- Lee and Lee (2006) K. W. Lee and C. E. Lee, Phys. Rev. Lett. 97, 137206 (2006).
- Xia et al. (2008) H. Xia, W. Li, Y. Song, X. Yang, X. Liu, M. Zhao, Y. Xia, C. Song, T.-W. Wang, D. Zhu, J. Gong, and Z. Zhu, Adv. Mater. 20, 4679 (2008).
- Červenka et al. (2009) J. Červenka, M. I. Katsnelson, and C. F. J. Flipse, Nat. Phys. 5, 840 (2009).
- Yang et al. (2009) X. Yang, H. Xia, X. Qin, W. Li, Y. Dai, X. Liu, M. Zhao, Y. Xia, S. Yan, and B. Wang, Carbon 47, 1399 (2009).
- Makarova et al. (2011) T. L. Makarova, A. L. Shelankov, I. T. Serenkov, V. I. Sakharov, and D. W. Boukhvalov, Phys. Rev. B 83, 085417 (2011).
- He et al. (2011a) Z. He, X. Yang, H. Xia, X. Zhou, M. Zhao, Y. Song, and T. Wang, Carbon 49, 1931 (2011a).
- Shukla et al. (2012) N. Shukla, M. Sarkar, N. Banerji, A. K. Gupta, and H. C. Verma, Carbon 50, 1817 (2012).
- Makarova et al. (2003) T. Makarova, K.-H. Han, P. Esquinazi, R. da Silva, Y. Kopelevich, I. Zakharova, and B. Sundqvist, Carbon 41, 1575 (2003).
- Han et al. (2003) K.-H. Han, D. Spemann, R. Höhne, A. Setzer, T. Makarova, P. Esquinazi, and T. Butz, Carbon 41, 785 (2003).
- Han et al. (2005) K.-H. Han, A. Talyzin, A. Dzwilewski, T. L. Makarova, R. Höhne, P. Esquinazi, D. Spemann, and L. S. Dubrovinsky, Phys. Rev. B 72, 224424 (2005).
- Mathew et al. (2007) S. Mathew, B. Satpati, B. Joseph, B. N. Dev, R. Nirmala, S. K. Malik, and R. Kesavamoorthy, Phys. Rev. B 75, 075426 (2007).
- Höhne et al. (2007) R. Höhne, P. Esquinazi, V. Heera, and H. Weishart, Diam. Relat. Mater. 16, 1589 (2007).
- Ma et al. (2012) Y. W. Ma, Y. H. Lu, J. B. Yi, Y. P. Feng, T. S. Herng, X. Liu, D. Q. Gao, D. S. Xue, J. M. Xue, J. Y. Ouyang, and J. Ding, Nature Commun. 3, 727 (2012).
- Xing et al. (2009) G. Xing, J. Yi, D. Wang, L. Liao, T. Yu, Z. Shen, C. Huan, T. Sum, J. Ding, and T. Wu, Phys. Rev. B 79, 174406 (2009).
- Zhou et al. (2009) S. Zhou, E. Čižmár, K. Potzger, M. Krause, G. Talut, M. Helm, J. Fassbender, S. A. Zvyagin, J. Wosnitza, and H. Schmidt, Phys. Rev. B 79, 113201 (2009).
- Pan et al. (2007) H. Pan, J. B. Yi, L. Shen, R. Q. Wu, J. H. Yang, J. Y. Lin, Y. P. Feng, J. Ding, L. H. Van, and J. H. Yin, Phys. Rev. Lett. 99, 127201 (2007).
- Yi et al. (2010) J. B. Yi, C. C. Lim, G. Z. Xing, H. M. Fan, L. H. Van, S. L. Huang, K. S. Yang, X. L. Huang, X. B. Qin, B. Y. Wang, T. Wu, L. Wang, H. T. Zhang, X. Y. Gao, T. Liu, A. T. S. Wee, Y. P. Feng, and J. Ding, Phys. Rev. Lett. 104, 137201 (2010).
- Liu et al. (2011) Y. Liu, G. Wang, S. Wang, J. Yang, L. Chen, X. Qin, B. Song, B. Wang, and X. Chen, Phys. Rev. Lett. 106, 087205 (2011).
- Roever et al. (2011) M. Roever, J. Malindretos, A. Bedoya-Pinto, A. Rizzi, C. Rauch, and F. Tuomisto, Phys. Rev. B 84, 081201 (2011).
- Ramos et al. (2010) M. A. Ramos, J. Barzola-Quiquia, P. Esquinazi, A. Muñoz Martin, A. Climent-Font, and M. Garcia-Hernandez, Phys. Rev. B 81, 214404 (2010).
- Ney et al. (2011) A. Ney, P. Papakonstantinou, A. Kumar, N.-G. Shang, and N. Peng, Appl. Phys. Lett. 99, 102504 (2011).
- Nair et al. (2012) R. Nair, M. Sepioni, I.-L. Tsai, O. Lehtinen, J. Keinonen, A. Krasheninnikov, T. Thomson, A. Geim, and I. Grigorieva, Nature Physics 8, 199 (2012).
- Sepioni et al. (2010) M. Sepioni, R. Nair, S. Rablen, J. Narayanan, F. Tuna, R. Winpenny, A. Geim, and I. Grigorieva, Phys. Rev. Lett. 105, 207205 (2010).
- He et al. (2012) Z. He, X. Yang, H. Xia, T. Z. Regier, D. K. Chevrier, X. Zhou, and T. K. Sham, Phys. Rev. B 85, 144406 (2012).
- Li et al. (2011) L. Li, S. Prucnal, S. D. Yao, K. Potzger, W. Anwand, A. Wagner, and S. Zhou, Appl. Phys. Lett. 98, 222508 (2011).
- Zhang et al. (2007) Y. Zhang, S. Talapatra, S. Kar, R. Vajtai, S. K. Nayak, and P. M. Ajayan, Phys. Rev. Lett. 99, 107201 (2007).
- Ugeda et al. (2010) M. M. Ugeda, I. Brihuega, F. Guinea, and J. M. Gomez-Rodriguez, Phys. Rev. Lett. 104, 096804 (2010).
- Ohldag et al. (2010) H. Ohldag, P. Esquinazi, E. Arenholz, D. Spemann, M. Rothermel, A. Setzer, and T. Butz, New J. Phys. 12, 123012 (2010).
- Lehtinen et al. (2004a) P. Lehtinen, A. Foster, Y. Ma, A. Krasheninnikov, and R. Nieminen, Phys. Rev. Lett. 93, 187202 (2004a).
- Esquinazi et al. (2010) P. Esquinazi, J. Barzola-Quiquia, D. Spemann, M. Rothermel, H. Ohldag, N. Garcia, A. Setzer, and T. Butz, J. Magn. Magn. Mater. 322, 1156 (2010).
- Sepioni et al. (2012a) M. Sepioni, R. R. Nair, I.-L. Tsai, A. K. Geim, and I. V. Grigorieva, EPL (Europhysics Letters) 97, 47001 (2012a).
- Spemann et al. (2012) D. Spemann, M. Rothermel, P. Esquinazi, M. A. Ramos, Y. Kopelevich, and H. Ohldag, EPL (Europhysics Letters) 98, 57006 (2012).
- Sepioni et al. (2012b) M. Sepioni, R. Nair, I. Tsai, A. Geim, I. Grigorieva, et al., EPL (Europhysics Letters) 98, 57007 (2012b).
- Spemann et al. (2013) D. Spemann, P. Esquinazi, A. Setzer, and W. Böhlmann, arXiv preprint arXiv:1310.3056 (2013).
- Venkatesan et al. (2013) M. Venkatesan, P. Dunne, Y. Chen, H. Zhang, and J. Coey, Carbon 56, 279 (2013).
- Sawicki et al. (2011) M. Sawicki, W. Stefanowicz, and A. Ney, Semicond. Sci. & Technol. 26, 064006 (2011).
- Pereira et al. (2011) L. M. C. Pereira, J. P. Araújo, M. J. V. Bael, K. Temst, and A. Vantomme, J. Phys. D-Appl. Phys. 44, 215001 (2011).
- Lin et al. (2003) X. Lin, D. Alber, and R. Henkelmann, J. Radioanal. Nucl. Chem. 257, 531 (2003).
- Wendler et al. (2012) E. Wendler, T. Bierschenk, F. Felgenträger, J. Sommerfeld, W. Wesch, D. Alber, G. Bukalis, L. C. Prinsloo, N. van der Berg, E. Friedland, et al., Nucl. Instr. Meth. Phys. Res. B 286, 97 (2012).
- Kelly et al. (2000) B. Kelly, B. Marsden, K. Hall, D. Martin, A. Harper, and A. Blanchard, IAEA Tecdoc 1154 (2000).
- Bode (1996) P. Bode, Instrumental and organizational aspects of a neutron activation analysis laboratory, Ph.D. thesis, Delft University of Technology, Delft (1996).
- Pimenta et al. (2007) M. Pimenta, G. Dresselhaus, M. S. Dresselhaus, L. Cancado, A. Jorio, and R. Saito, Phys. Chem. Chem. Phys. 9, 1276 (2007).
- Gerber et al. (2010) I. C. Gerber, A. V. Krasheninnikov, A. S. Foster, and R. M. Nieminen, New J. Phys. 12, 113021 (2010).
- Arrott (1957) A. Arrott, Phys. Rev. 108, 1394 (1957).
- Wohlfarth (1968) E. Wohlfarth, J. Appl. Phys. 39, 1061 (1968).
- He et al. (2011b) Z. He, H. Xia, X. Zhou, X. Yang, Y. Song, and T. Wang, J. Phys. D: Appl. Phys. 44, 085001 (2011b).
- Elman et al. (1982) B. Elman, M. Shayegan, M. Dresselhaus, H. Mazurek, and G. Dresselhaus, Phys. Rev. B 25, 4142 (1982).
- Xing et al. (2013) T. Xing, L. H. Li, L. Hou, X. Hu, S. Zhou, R. Peter, M. Petravic, and Y. Chen, Carbon 57, 515 (2013).
- Telling and Heggie (2007) R. Telling and M. Heggie, Philosophical Magazine 87, 4797 (2007).
- Makarova et al. (2008) T. Makarova, M. Riccò, D. Pontiroli, M. Mazzani, M. Belli, and A. Goffredi, physica status solidi (b) 245, 2082 (2008).
- Jawhari et al. (1995) T. Jawhari, A. Roid, and J. Casado, Carbon 33, 1561 (1995).
- Ohldag et al. (2007) H. Ohldag, T. Tyliszczak, R. Höhne, D. Spemann, P. Esquinazi, M. Ungureanu, and T. Butz, Phys. Rev. Lett. 98, 187204 (2007).
- Lehtinen et al. (2004b) P. O. Lehtinen, A. S. Foster, Y. Ma, A. V. Krasheninnikov, and R. M. Nieminen, Phys. Rev. Lett. 93, 187202 (2004b).
- Yazyev (2008) O. V. Yazyev, Phys. Rev. Lett. 101, 037203 (2008).
- Telling et al. (2003) R. Telling, C. Ewels, A. El-Barbary, and M. Heggie, Nat. Mater. 2, 333 (2003).
- Machado-Charry et al. (2012) E. Machado-Charry, P. Boulanger, L. Genovese, N. Mousseau, and P. Pochet, Appl. Phys. Lett. 101, 132405 (2012).
- Krishnan et al. (2013) S. Krishnan, G. Brenet, E. Machado-Charry, D. Caliste, L. Genovese, T. Deutsch, and P. Pochet, Appl. Phys. Lett. 103, 251904 (2013).
- Genovese et al. (2008) L. Genovese, A. Neelov, S. Goedecker, T. Deutsch, S. A. Ghasemi, A. Willand, D. Caliste, O. Zilberberg, M. Rayson, A. Bergman, and R. Schneider, J. Chem. Phys. 129 (2008).
- Genovese et al. (2007) L. Genovese, T. Deutsch, and S. Goedecker, J. Chem. Phys. 127 (2007).
- Yazyev and Helm (2007) O. V. Yazyev and L. Helm, Phys. Rev. B 75, 125408 (2007).
- Barzola-Quiquia et al. (2007) J. Barzola-Quiquia, P. Esquinazi, M. Rothermel, D. Spemann, T. Butz, and N. García, Phys. Rev. B 76, 161403 (2007).