Determination of the large scale volume weighted halo velocity bias in simulations
Abstract
A profound assumption in peculiar velocity cosmology is at sufficiently large scales, where is the volume weighted halo(galaxy) velocity bias with respect to the matter velocity field. However, this fundamental assumption has not been robustly verified in numerical simulations. Furthermore, it is challenged by structure formation theory (BBKS, 1986, ApJ; Desjacques and Sheth, 2010, PRD), which predicts the existence of velocity bias (at least for proto-halos) due to the fact that halos reside in special regions (local density peaks). The major obstacle to measure the volume weighted velocity from N-body simulations is an unphysical sampling artifact. It is entangled in the measured velocity statistics and becomes significant for sparse populations. With recently improved understanding of the sampling artifact (Zhang, Zheng and Jing, 2015, PRD; Zheng, Zhang and Jing, 2015, PRD), for the first time we are able to appropriately correct this sampling artifact and then robustly measure the volume weighted halo velocity bias. (1) We verify within model uncertainty at and - for halos of mass -, and, therefore, consolidates a foundation of the peculiar velocity cosmology. (2) We also find statistically significant signs of at . Unfortunately, whether this is real or caused by residual sampling artifact requires further investigation. Nevertheless, cosmology based on velocity data shall be careful this potential velocity bias.
pacs:
98.80.-k; 98.80.Es; 98.80.Bp; 95.36.+xI Introduction
Large scale peculiar velocity is maturing as a powerful probe of cosmology. Peculiar velocity directly responds to the gravitational pull of all clustered matter and energy, making it a precious tool to study dark matter (DM), dark energy, and the nature of gravity (e.g. Peacock et al. (2001); Zhang et al. (2007); Guzzo et al. (2008); Jain and Zhang (2008); Li et al. (2013)). Measuring peculiar velocity at cosmological distances with the conventional method of distance indicators is challenging, albeit improving (e.g., Johnson et al. (2014); Watkins and Feldman (2014)). Alternatively, redshift space distortion (RSD) provides a way of measuring peculiar velocity at cosmological distances, free of the otherwise overwhelming contamination of Hubble flow. It enables accuracy in the velocity power spectrum measurement at (e.g. Fig. 2.3, Schlegel et al. (2011)), through stage IV dark energy surveys such as DESI and Euclid.
A profound assumption in cosmology based on peculiar velocity is that the velocity bias of galaxies vanishes at large scales (), namely, that the galaxy velocity field is statistically identical to that of the matter velocity field at large scales. The strong equivalence principle predicts that galaxies sense the same acceleration as ambient DM particles. Hence, one would naturally expect statistically identical velocity for galaxies and DM particles, at scales where the only operating force is gravity. However, a loop hole in this argument is that galaxies and their host halos only reside in special regions (local density peaks). The same environmental difference is known to cause in proto-halos Bardeen et al. (1986); Desjacques (2008); Desjacques and Sheth (2010); Elia et al. (2012); Baldauf et al. (2014); Biagetti et al. (2014). However, due to the stochastic relation between proto-halos and real halos Colberg et al. (2000), it is non-trivial to extrapolate this prediction to real halos where galaxies reside. Since at large scale, uncertainties in lead to systematic error in all existing measurements Chuang et al. (2013),
| (1) |
Here and is the linear density growth factor. Therefore we have to understand to or better to make the peculiar velocity competitive with other dark energy probes.
A key intermediate step to understand the galaxy velocity bias is to understand the halo velocity bias 111Galaxies in a halo have extra velocities relative to the host halo. The correlation length of this velocity field is , so it does not contribute to velocity at of interest. Therefore the large scale halo velocity and galaxy velocity are identical, statistically speaking. . N-body simulations are ideal to robustly clarify this issue. What is most relevant for cosmology, in particular RSD cosmology, is the volume weighted halo velocity bias at large scales 222For example, the velocity power spectrum determined from RSD is volume weighted in the framework of Zhang et al. (2013). . Unfortunately, measuring the volume weighted velocity statistics through inhomogeneously and sparsely distributed particles/halos is highly challenging, due to a sampling artifact Bernardeau and van de Weygaert (1996); Pueblas and Scoccimarro (2009); Zheng et al. (2013); Zhang et al. (2015); Zheng et al. (2015); Jennings et al. (2014).
This sampling artifact arises from the fact that we only have information of velocities at positions of particles/halos. Therefore the sampling of the volume weighted velocity field is incomplete. Even worse, since the particle/halo velocity field is correlated with the particle/halo distribution, the sampling of volume weighted velocity field is imperfect. Such completeness and imperfection leads to inaccurate measurement of velocity statistics, which we call the “sampling artifact”. For sparse populations, it can cause systematic underestimation of the velocity power spectrum at Zhang et al. (2015); Zheng et al. (2015); Jennings et al. (2014). Even worse, it also depends on the intrinsic LSS (large scale structure) fluctuation in the particle distribution and its correlation with velocity Zheng et al. (2015). This sampling artifact is by itself unphysical, in the sense that it solely arises from the limitation of robustly measuring the volume weighted velocity statistics given the inhomogeneously and sparsely distributed velocity data. Given its existence, the rawly measured velocity bias from simulation is a mixture of the real velocity bias and the sampling artifact in the following form:
| (2) |
Namely, the raw bias measurement is wrong by a multiplicative factor caused by the sampling artifact. Without rigorous correction, the sampling artifact can be misinterpreted as a significant velocity bias and mislead the peculiar velocity cosmology.
Therefore, robustly understanding the sampling artifact is a prerequisite for reliably measuring the true velocity bias. For this purpose, we developed the theory of the sampling artifact in Zhang et al. (2015) and rigorously confirmed the existence of the sampling artifact in simulations Zheng et al. (2015). We further tested the theory against simulations and improved it to accuracy at for populations with number density Zheng et al. (2015). In particular, Zheng et al. (2015) demonstrates the sharp distinction between a real velocity bias and the sampling artifact, for DM samples. It first constructs samples with a fraction of the simulation DM particles randomly selected from all the simulation particles. By construction, the velocity statistics of the random samples shall be statistically identical to those of the sample including all simulation DM particles. Namely . However, the raw measurement shows of high significance Zheng et al. (2015). The fake then clearly demonstrates the sampling artifact (Eq. 2).
In the current paper, we applied this improved understanding of the sampling artifact Zhang et al. (2015); Zheng et al. (2015) to robustly eliminate it in velocity measurement and correctly determine the true volume weighted halo velocity bias for the first time. This differs from existing numerical works on measuring velocity bias Colín et al. (2000); Elia et al. (2012); Baldauf et al. (2014); Jennings et al. (2014), which either focus on proto-halos, the density weighted halo velocity statistics, or the volume weighted halo velocity mixed with the sampling artifact.
II Simulation specifications
We analyze the same J1200 N-body simulation in Zheng et al. (2015), run with a particle-particle-particle-mesh () code Jing et al. (2007). It adopts a CDM cosmology with , , , , and . It has box size, particles and mass resolution of . The halo catalogue is constructed by Friends-of-Friends (FOF) method with a linking length . Gravitationally unbound “halos” have been excluded from the catalogue. In total we have halos with at least 10 simulation particles, at . We choose the mass weighted center as the halo center and the velocity averaged over all member particles as the halo velocity. We try three mass bins detailed in table 1.
| Set ID | mass range | ||||
|---|---|---|---|---|---|
| A1() | - | ||||
| - | 30 | 3.5 | 1.8 | ||
| - | 24 | 2.1 | 2.6 | ||
| - | 19 | 4.3 | |||
| A2() | - | ||||
| - | 2.8 | 31 | 1.1 | ||
| - | 2.7 | 27 | 1.5 | ||
| - | 2.5 | 2.4 | |||
| B() | - |
III Correcting the sampling artifact
We aim to measure the halo velocity bias defined in Fourier space,
| (3) |
The subscript “E” denotes the gradient (irrotational) part of the velocity, which is most relevant for peculiar velocity cosmology. The subscripts“” and “DM” refer to halos and DM simulation particles respectively. Throughout this paper, we restrict ourself to the volume weighted power spectrum. We adopt the NP (Nearest Particle) method Zheng et al. (2013) to sample the velocity field on uniform grids. Before correcting the sampling artifact, the measured velocity power spectrum differs from its true value by a factor . We found that Zheng et al. (2015)
| (4) |
Here, is the deflection field pointing from a particle used for velocity assignment to the corresponding grid point to which the velocity is assigned. Reference Zhang et al. (2015) showed that fully captures the sampling artifact. is the spatial correlation of . For and , agrees with the actual to at Zheng et al. (2015). The subscript “T” denotes that it is our theory prediction. We caution that the theoretically predicted may deviate from the true since the theory prediction is not exact. Furthermore, (or ) of dark matter particles can differ from that of dark matter halos.
We take two steps to correct for the sampling artifact. Step one. We use Eq. 4 to correct for the bulk of the sampling artifact. Step two. There are residual sampling artifact since our theory is not perfect (). We further correct this residual sampling artifact with the aid of DM control samples (DMCs). They are constructed by randomly selecting simulation DM particles from the full simulation sample with the requirement 333For this requirement, DMCs are more sparse than the halo samples.. is the dominant factor determining the sampling artifact Zhang et al. (2015); Zheng et al. (2015). The halo sample and DMCs have identical sampling artifact at the limit and similar sampling artifact elsewhere. Hence to greater accuracy than Eq. 4, we expect . The subscripts “” and“DMC” denote properties of halos and DM control samples, respectively. We then obtain
| (5) |
The terms on the r.h.s. are, respectively, the raw velocity bias measurement without correcting the sampling artifact, the step one correction, and the step two correction. is measured from the full J1200 simulation sample, which is essentially free of sampling artifact due to its high Zheng et al. (2013). All the correction terms (, and ) are directly calculated from the J1200 simulation.
The inaccuracy of Eq. 5 increases with . For peculiar velocity cosmology to be competitive, at least we shall utilize measurement at . So we choose as the pivot scale for quoting the accuracy. Overall we expect accuracy 444For all the investigated halo bins, except , . Based on Zheng et al. (2015), we expect accuracy in the step one correction (Eq. 4). For , the number density is lower (). However Eq. 4 is more accurate at than Zheng et al. (2015). Hence we also expect Eq. 5 to be accurate at level. The step two correction can further improve the accuracy., extrapolating from the DM cases. We caution the readers on this uncertainty in the measured (Figs. 1 & 2). Somewhat arbitrary, we quote the systematic error in the measured as at . Therefore, only if at , are we capable of detecting a non-unity velocity bias. More accurate measurement of velocity bias requires better correction of the sampling artifact to below , either by improved modelling of the sampling artifact, or by improved velocity assignment method (e.g. Yu et al. (2015)).
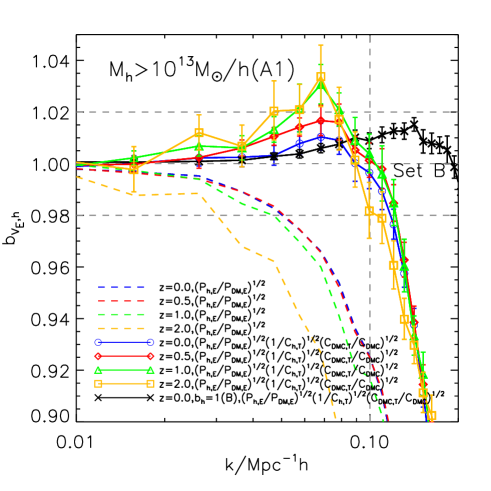
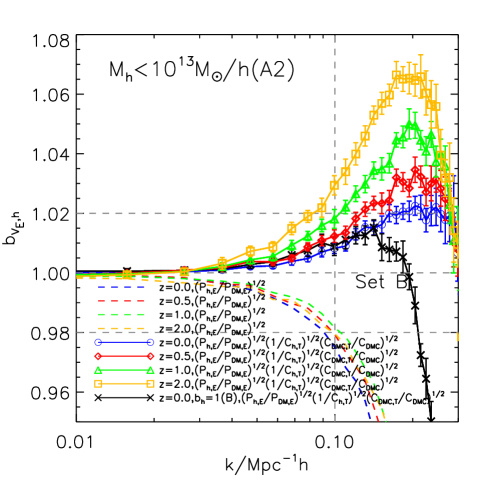
IV No velocity bias at
Figs. 1 & 2 show for all mass bins listed in Table 1. The raw measurements suggest an “anti-bias”, unanimous for all mass bins at all redshifts. This is most significant for the more massive bin , reaching at (Fig. 1). Possibly by coincidence, this “anti-bias” agrees well with theoretical predictions of proto-halos based on linear/Gaussian statistics. However, we have solid evidences that it is essentially an illusion caused by the sampling artifact. The sampling artifact causes systematic suppression of Zhang et al. (2015); Zheng et al. (2015); Jennings et al. (2014), mimicking an anti-bias. In another word, the apparent “anti-bias” is unreal in the sense that is unrelated to the true velocity statistics of halos and is irrelevant for cosmology.
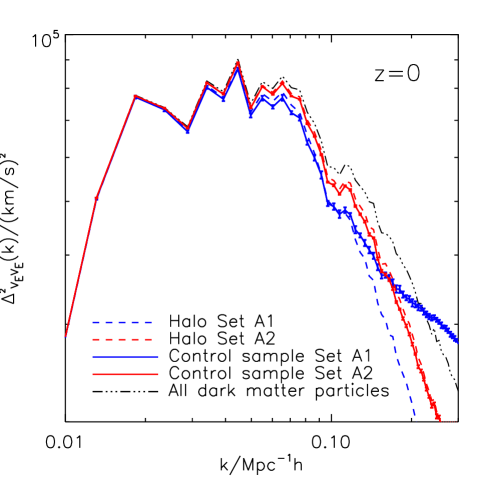
Theoretically, we expect the sampling artifact to exist for any populations of inhomogeneously distributed objects, and its impact to be significant for sparse populations Zhang et al. (2015). It has been robustly detected for the case of DM simulation particles Zheng et al. (2013, 2015). Therefore, it must also exist for DM halos Zhang et al. (2015). Fig. 3 further consolidates this theoretical prediction. It shows that the DM control samples containing a fraction of DM simulation particles have smaller than the full DM sample at . Furthermore, decreases with decreasing number density. If the number densities of these DM control samples match those of halo samples, their match each other closely, especially at . This behavior holds for all three mass bins and four redshifts investigated. The DM control samples are constructed by randomly selecting DM simulation particles, so by construction the difference in to the full DM sample should not exist and any difference must be caused by the sampling artifact. The similarities between DM control samples and halo samples then strongly suggest that the “anti-bias” implied by the raw measurement is merely the sampling artifact and is therefore unrealistic. The bin with is a factor of more sparse than with , so it suffers from a larger sampling artifact, at .
Hence, it is essential to correct for the sampling artifact. After applying the two step corrections (Eq. 5), the “anti-bias” disappears and we find within statistical uncertainty, for the A1 bin at all redshifts. Taking the extra systematic uncertainty into account, we find no evidence on a non-unity velocity bias at for halos bigger than . At , of bin after correcting the sampling artifact shows statistically significant evidence for , opposite to the “anti bias” that raw measurement suggests. However, once the systematic uncertainty is taken into account, again we find no evidence for at (perhaps except ).
How solid are these results? To check it, we construct a mass bin with . It has identical large scale LSS fluctuation as DMCs, so we can better handle its sampling artifact by comparing with DMCs. Thus we treat the measurement of bin as the most accurate halo velocity bias measurement that we can achieve. Again we find at . Therefore we conclude that at within model uncertainty. Settling the issue of whether at greater accuracy requires further improvement over existing understanding of the sampling artifact Zheng et al. (2015) or better velocity assignment method.
The vanishing velocity bias () within model uncertainty at Mpc verifies a fundamental assumption in peculiar velocity cosmology. However, from the theoretical viewpoint, this result is quite surprising, as linear theory predicts for proto-halos (peaks in initial/linearly evolved density field)Bardeen et al. (1986); Desjacques (2008); Desjacques and Sheth (2010); Baldauf et al. (2014); Biagetti et al. (2014). The predicted arises from correlation between density gradient and velocity at initial density peaks. A number of processes may weaken/destroy this correlation and hence make the velocity bias disappear. First is the stochasticity in proto halo-halo relation. A fraction of halos today do not correspond to initial density peaks and a fraction of initial density peaks do not evolve into halos today (e.g. Colberg et al. (2000)). Second, halos move from their initial positions. They tend to move towards each other and, hence, modify their velocity correlation. Third, the density and velocity evolution has non-negligible nonlinearity (e.g. Colberg et al. (2000); Zheng et al. (2013)), and, hence, non-Gaussianity. This alters the predicted velocity bias based on Gaussian statistics.
V Velocity bias at ?
On the other hand, at there are signs of and signs of mass and redshift dependences. (1) For mass bin , the data suggest that and increases with increasing and . The excess is statistically significant at and . (2) In contrast, bin () has at the to level, which is also statistically significant.
Due to the opposite signs of for more and less massive halos, an even more significant behavior is that smaller halos seem to move faster at and the difference reaches at . If this difference is indeed intrinsic, instead of a residual sampling artifact, it could be caused by different environments where different halos reside. Small halos tend to live in filaments and have extra infall velocity with respect to large halos. The infall velocity has a correlation length of typical filament length of tens of Mpc, and, hence, shows up at . Unfortunately, our understanding of the sampling artifact at is considerably poorer Zheng et al. (2015). Therefore we are not able to draw decisive conclusions, other than that cosmology based on the peculiar velocity at must keep caution on this potential velocity bias.
VI Conclusions and discussions
This paper presents the first determination of volume weighted halo velocity bias through N-body simulations. The raw measurements suffer from a severe sampling artifact which could be misinterpreted as a significant “velocity bias.” We are able to appropriately correct the sampling artifact following our previous works Zhang et al. (2015); Zheng et al. (2015) and measure the physical velocity bias. Two major findings are as follows:
-
•
at within model uncertainty. It consolidates the peculiar velocity cosmology;
-
•
Signs of at and signs that depends on redshifts, scales and halo mass. Although we are not able to robustly rule out the possibility of a residual sampling artifact, it raises the alarm of using velocity data to constrain cosmology.
Accurate measurement of the velocity bias in simulations heavily relies on robust correction of the sampling artifact. The sampling artifact depends on not only the halo number density, but also on the intrinsic LSS fluctuation of the halo distribution and its correlation with the halo velocity field Zheng et al. (2015). It is for this reason that our understanding of the sampling artifact at so far is no better than . Therefore, we caution the readers that the measured velocity bias has (or somewhat arbitrarily ) model uncertainty (systematic error). For a similar reason, we cannot fully quantify the accuracy of Eq. 5 and the accuracy in the sampling artifact corrected 555Another reason is that we do not have corresponding halo samples of identical mass and intrinsic LSS clustering, but with halo number density and hence free of sampling artifact. This differs from the case of DM, for which in principle we can increase the simulation mass resolution to reach this limit. . We know it is more accurate than Eq. 4 and have estimated its accuracy by extrapolating from the DM cases Zheng et al. (2015). Nevertheless, this ambiguity prevents us from drawing an unambiguous conclusion on whether the found at is real, or whether deviates from unity by less than at . Therefore a major future work will be to improve understanding of the sampling artifact (e.g., discussions in the Appendix of Zheng et al. (2015)). Furthermore, we will explore other velocity assignment methods which may alleviate the problem of the sampling artifact. We will also extend to galaxy velocity bias with mock galaxy catalogues, where the sampling artifact should also be corrected.
Finally, we address that the RSD determines velocity indirectly through the galaxy number density distribution and, therefore, the RSD inferred velocity statistics can be free of the sampling artifact. This is another advantage of RSD over conventional velocity measurement methods. It is only when comparing the RSD determined velocity power spectrum with that measured in simulations that we must worry about the sampling artifact in the simulation part.
Acknowledgement.— We thank Cris Sabiu’s for his help in proofreading this paper. This work was supported by the National Science Foundation of China (Grants No. 11025316, No. 11121062, No. 11033006, No. 11320101002, and No. 11433001), the National Basic Research Program of China (973 Program 2015CB857001), the Strategic Priority Research Program “The Emergence of Cosmological Structures” of the Chinese Academy of Sciences (Grant No. XDB09000000), and the key laboratory grant from the Office of Science and Technology, Shanghai Municipal Government (No. 11DZ2260700).
References
- Peacock et al. (2001) J. A. Peacock, S. Cole, P. Norberg, C. M. Baugh, J. Bland-Hawthorn, T. Bridges, R. D. Cannon, M. Colless, C. Collins, W. Couch, et al., Nature (London) 410, 169 (2001), eprint arXiv:astro-ph/0103143.
- Zhang et al. (2007) P. Zhang, M. Liguori, R. Bean, and S. Dodelson, Physical Review Letters 99, 141302 (2007), eprint 0704.1932.
- Guzzo et al. (2008) L. Guzzo, M. Pierleoni, B. Meneux, E. Branchini, O. Le Fèvre, C. Marinoni, B. Garilli, J. Blaizot, G. De Lucia, A. Pollo, et al., Nature (London) 451, 541 (2008), eprint 0802.1944.
- Jain and Zhang (2008) B. Jain and P. Zhang, Phys. Rev. D 78, 063503 (2008), eprint 0709.2375.
- Li et al. (2013) B. Li, W. A. Hellwing, K. Koyama, G.-B. Zhao, E. Jennings, and C. M. Baugh, MNRAS 428, 743 (2013), eprint 1206.4317.
- Johnson et al. (2014) A. Johnson, C. Blake, J. Koda, Y.-Z. Ma, M. Colless, M. Crocce, T. M. Davis, H. Jones, J. R. Lucey, C. Magoulas, et al., ArXiv e-prints (2014), eprint 1404.3799.
- Watkins and Feldman (2014) R. Watkins and H. A. Feldman, ArXiv e-prints (2014), eprint 1407.6940.
- Schlegel et al. (2011) D. Schlegel, F. Abdalla, T. Abraham, C. Ahn, C. Allende Prieto, J. Annis, E. Aubourg, M. Azzaro, S. B. C. Baltay, C. Baugh, et al., ArXiv e-prints (2011), eprint 1106.1706.
- Bardeen et al. (1986) J. M. Bardeen, J. R. Bond, N. Kaiser, and A. S. Szalay, Astrophys. J. 304, 15 (1986).
- Desjacques (2008) V. Desjacques, Phys. Rev. D 78, 103503 (2008), eprint 0806.0007.
- Desjacques and Sheth (2010) V. Desjacques and R. K. Sheth, Phys. Rev. D 81, 023526 (2010), eprint 0909.4544.
- Elia et al. (2012) A. Elia, A. D. Ludlow, and C. Porciani, MNRAS 421, 3472 (2012), eprint 1111.4211.
- Baldauf et al. (2014) T. Baldauf, V. Desjacques, and U. Seljak, ArXiv e-prints (2014), eprint 1405.5885.
- Biagetti et al. (2014) M. Biagetti, V. Desjacques, A. Kehagias, and A. Riotto, Phys. Rev. D 90, 103529 (2014), eprint 1408.0293.
- Colberg et al. (2000) J. M. Colberg, S. D. M. White, T. J. MacFarland, A. Jenkins, F. R. Pearce, C. S. Frenk, P. A. Thomas, and H. M. P. Couchman, MNRAS 313, 229 (2000).
- Chuang et al. (2013) C.-H. Chuang, F. Prada, F. Beutler, D. J. Eisenstein, S. Escoffier, S. Ho, J.-P. Kneib, M. Manera, S. E. Nuza, D. J. Schlegel, et al., ArXiv e-prints (2013), eprint 1312.4889.
- Bernardeau and van de Weygaert (1996) F. Bernardeau and R. van de Weygaert, MNRAS 279, 693 (1996).
- Pueblas and Scoccimarro (2009) S. Pueblas and R. Scoccimarro, Phys. Rev. D 80, 043504 (2009), eprint 0809.4606.
- Zheng et al. (2013) Y. Zheng, P. Zhang, Y. Jing, W. Lin, and J. Pan, Phys. Rev. D 88, 103510 (2013), eprint 1308.0886.
- Zhang et al. (2015) P. Zhang, Y. Zheng, and Y. Jing, Phys. Rev. D 91, 043522 (2015), eprint 1405.7125.
- Zheng et al. (2015) Y. Zheng, P. Zhang, and Y. Jing, Phys. Rev. D 91, 043523 (2015), eprint 1409.6809.
- Jennings et al. (2014) E. Jennings, C. M. Baugh, and D. Hatt, ArXiv e-prints (2014), eprint 1407.7296.
- Colín et al. (2000) P. Colín, A. A. Klypin, and A. V. Kravtsov, Astrophys. J. 539, 561 (2000), eprint astro-ph/9907337.
- Jing et al. (2007) Y. P. Jing, Y. Suto, and H. J. Mo, Astrophys. J. 657, 664 (2007), eprint arXiv:astro-ph/0610099.
- Yu et al. (2015) Y. Yu, J. Zhang, Y. Jing, and P. Zhang, ArXiv e-prints (2015), eprint 1505.06827.
- Zhang et al. (2013) P. Zhang, J. Pan, and Y. Zheng, Phys. Rev. D 87, 063526 (2013), eprint 1207.2722.