The Grism Lens-Amplified Survey from Space (GLASS). II. Gas-phase metallicity and radial gradients in an interacting system at
Abstract
We present spatially resolved gas-phase metallicity for a system of three galaxies at detected in the Grism Lensed-Amplified Survey from Space (GLASS). The combination of HST’s diffraction limit and strong gravitational lensing by the cluster MACS J0717+3745 results in a spatial resolution of pc, enabling good spatial sampling despite the intrinsically small galaxy sizes. The galaxies in this system are separated by kpc in projection and are likely in an early stage of interaction, evidenced by relatively high specific star formation rates. Their gas-phase metallicities are consistent with larger samples at similar redshift, star formation rate, and stellar mass. We obtain a precise measurement of the metallicity gradient for one galaxy and find a shallow slope compared to isolated galaxies at high redshift, consistent with a flattening of the gradient due to gravitational interaction. An alternative explanation for the shallow metallicity gradient and elevated star formation rate is rapid recycling of metal-enriched gas, but we find no evidence for enhanced gas-phase metallicities which should result from this effect. Notably, the measured stellar masses probe to an order of magnitude below previous mass-metallicity studies at this redshift. The lowest mass galaxy has properties similar to those expected for Fornax at this redshift, indicating that GLASS is able to directly study the progenitors of local group dwarf galaxies on spatially resolved scales. Larger samples from the full GLASS survey will be ideal for studying the effects of feedback, and the time evolution of metallicity gradients. These initial results demonstrate the utility of HST spectroscopy combined with gravitational lensing for characterizing resolved physical properties of galaxies at high redshift.
Subject headings:
galaxies: evolution — galaxies: ISM1. Introduction
Galaxy gas-phase metallicities encode information about the history of gas accretion, star formation, and gaseous outflows. Measurements of metallicity combined with accumulated stellar mass and gas content therefore provide stringent constraints on the baryonic processes relevant to galaxy formation. Current observations show that essentially all galaxies have low gas-phase metallicities compared to estimated chemical yields from star formation, with greater discrepancy at lower stellar masses (the mass-metallicity relation, e.g., Tremonti et al., 2004; Lequeux et al., 1979). This is commonly attributed to outflows of metal-enriched gas driven by intense star formation, supported by observations that such feedback is ubiquitous among galaxies with high densities of star formation (Heckman, 2001; Newman et al., 2012). The spatial distribution of metallicity within a galaxy further constrains the baryonic assembly history, in particular the effects of outflows and dynamical evolution. Star-forming disk galaxies in the local universe have negative radial metallicity gradients (higher metallicity in the central regions; see Sánchez et al. 2014 and Vila-Costas & Edmunds 1992 for large samples). This has been explained by models of chemical evolution in which galaxies grow inside-out such that outer regions have younger characteristic ages (e.g., Nelson et al., 2012). Gradients typically flatten at large radii indicating efficient mixing in those regions, possibly due to secular dynamical evolution or recycling of metal-enriched gas which was previously ejected in outflows (so-called ”galactic fountains”; e.g. Werk et al., 2011; Bresolin et al., 2012). Notably, galaxies which are undergoing mergers or strong interactions have significantly shallower metallicity gradients than isolated disks, which is understood numerically in terms of radial gas flows induced by tidal forces (most notably metal-poor inflows; Rupke et al., 2010a, b; Sánchez et al., 2014; Rich et al., 2012).
This work is concerned with using time evolution of metallicity gradients as a probe of galaxy formation. We seek to measure how gradients evolve, and to understand what processes drive that evolution. A variety of predictions have been made based on numerical models of inside-out growth, ranging from steeper to flatter to inverted (positive) gradients at higher redshifts (e.g., Prantzos & Boissier, 2000; Chiappini et al., 2001; Magrini et al., 2007; Fu et al., 2009). Cosmological simulations have recently begun to address this issue, with several groups arguing that gradient evolution depends strongly on star formation feedback: stronger feedback is predicted to cause flatter gradients due to rapid gas recycling (Pilkington et al., 2012; Gibson et al., 2013; Anglés-Alcázar et al., 2014). Meanwhile the observational results at high redshift have grown in number but comprise a variety of conclusions for the evolution of gradients. Data reaching kpc resolution with adaptive optics (and up to 100 pc in the case of lensed galaxies) have revealed negative radial gradients with slopes often steeper than local descendants, suggesting that gradients flatten as galaxies grow with time (Jones et al., 2010, 2013; Yuan et al., 2011; Swinbank et al., 2012). Larger surveys with seeing-limited resolution of 5 kpc have reported mostly flat gradients with a significant fraction of positive slopes (Cresci et al., 2010; Queyrel et al., 2012; Stott et al., 2014; Troncoso et al., 2014). These have been interpreted as evidence for predicted ”cold flows” of pristine gas (e.g., Dekel et al., 2009; Kereš et al., 2009; Faucher-Giguère et al., 2011), but these results are in contrast with high-resolution measurements.
The discrepancy in metallicity gradient measurements at high redshift must be addressed in order to reliably understand the role of gas and metal transport in galaxy evolution. High spatial resolution is clearly an advantage; Yuan et al. (2013) demonstrate how degraded resolution can dramatically bias gradient measurements. For typical-size galaxies at high redshift, kpc resolution is essential to sample the scale radius and reliably measure gradient slopes. The use of single strong-line metallicity indicators such as [N ii]H (e.g., Pettini & Pagel, 2004) is another potential problem. Multiple emission line diagnostics are necessary to confirm variations in metallicity (e.g., Jones et al., 2013) and to distinguish H ii regions from AGN or shock excitation, which in many cases are non-negligible (Wright et al., 2010; Yuan et al., 2012; Newman et al., 2014) and would bias the inferred gradients. In essence we require larger samples with high spatial resolution and a reliable suite of metallicity and excitation diagnostics in order to resolve the discrepancy in existing measurements. Here we present initial results from the Grism Lensed-Amplified Survey from Space (GLASS) in which we measure metallicities at based on 5 nebular emission lines with resolution as fine as 200 pc. As with Jones et al. (2013) this is enabled by a combination of strong gravitational lensing, broad wavelength coverage, and diffraction-limited data. These results demonstrate the potential of the full GLASS survey to obtain dozens of such measurements at and thus reliably determine the average evolution of metallicity gradients over the past 11 Gyr.
Throughout this paper we adopt a flat CDM cosmology with , , and H km s-1 Mpc-1. At , 3.5 Gyr has elapsed since the big bang and 1 arcsecond corresponds to 8.4 kpc (c.f. 3.5 Gyr and 8.7 kpc/arcsecond for the Planck Collaboration 2014 cosmology). All stellar masses (M∗) and star formation rates (SFR) correspond to a Chabrier (2003) initial mass function. Unless stated otherwise, ”metallicity” refers to the gas-phase oxygen abundance.
2. A triple galaxy system at
The first GLASS observations of MACS J0717+3745 (hereafter J0717) revealed three different strongly lensed sources at the same redshift (arc systems 3, 4, and 14 in Schmidt et al. 2014). The grism observations cover three magnified images of each galaxy (e.g., arcs 3.1, 3.2, and 3.3 are multiple images of the same source) and the details of each image are given in Schmidt et al. (2014). The gravitational lensing model discussed in Section 4 indicates projected galaxy separations of 50 kpc for pairs 4–14, 150 kpc for 3–14, and 200 kpc for 3–4. Although the grism redshifts cannot constrain their line-of-sight separation to better than a few Mpc, Keck/LRIS spectra of arcs 3.2 and 14.1 (Limousin et al., 2012) and a Keck/MOSFIRE spectrum of arc 4.1 (Schmidt et al., 2014) indicate consistent redshifts, corresponding to Mpc in the Hubble flow. Therefore all three galaxies appear to be physically associated. We argue in Section 6 that arcs 4 and 14 are likely affected by significant forces from gravitational interaction on the basis of their physical properties, however we caution that their true 3-D separation is uncertain. The fortuitous inclusion of these systems within HST’s field of view, and the availability of several strong emission lines in the grism spectra, provide a laboratory for studying how gas and heavy elements cycle within galaxies and their surrounding medium in an overdense environment.
3. Observations and data analysis
Details of the GLASS survey design and grism spectroscopy are given in Schmidt et al. (2014). Briefly, J0717 was observed at two different position angles separated by approximately 100 degrees. The total exposure time is 10 orbits in the G102 grism and 4 orbits in the G141 grism. Data from each position angle are interlaced to produce 2D grism spectra and direct images with a scale of 0065 per pixel, Nyquist sampling the point spread function. Direct images are used to estimate continuum spectra by dispersing each pixel from individual objects detected in SExtractor (Bertin & Arnouts, 1996) segmentation maps; these are used to guide the extraction of individual object spectra and to subtract an estimate of the contamination from nearby objects.
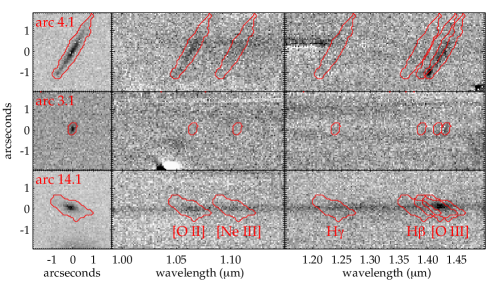
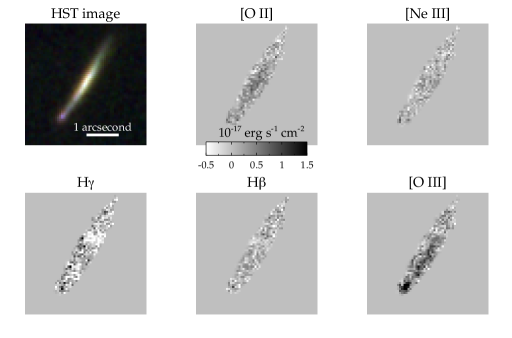
The critical analysis method for this work is extraction of emission line maps. For each object of interest, we use the direct image to construct a segmentation map and shift this to the expected wavelength of strong emission lines using spectroscopic redshifts from the grism data (Figure 1). We extract two-dimensional maps of emission line flux and uncertainty for the region defined by the segmentation map, and correct for residual background structure by subtracting a corresponding map at a nearby line-free wavelength (e.g., a rest-frame 4750 Å map is typically used to correct H for imperfect continuum and contamination estimates). Data affected by strong contamination are masked and treated as missing. We align the emission line maps extracted from both position angles using bilinear interpolation, and combine them with an inverse-variance weighting. Example emission line maps are shown for arc 4.1 in Figure 2.
The H and [O iii] emission lines require special treatment in cases where the spatial extent is sufficiently large that these lines overlap. In all cases there is a region of pure [O iii] 5007 emission at the rightmost edge of the blend (of pixels or in the dispersion direction for ). We use the intrinsic flux ratio to subtract the corresponding [O iii] 4959 flux, which leaves another region of pure [O iii] 5007 emission. We iterate this process to completely de-blend the [O iii] doublet, resulting in separate 4959 and 5007 emission line maps. Additionally we de-blend [O iii] 4959 and H, although we cannot completely de-blend the lines in cases where [O iii] 5007 and H overlap. For this occurs whenever the source size is in the dispersion direction (for example, the spectrum of arc 14.1 shown in Figure 1). In such cases we treat the region where [O iii] 5007 and H overlap as missing data.
4. Gravitational lensing model
An accurate gravitational lensing model is essential for reconstructing the source plane morphology of lensed galaxies, and for combining the information from the multiple images. As one of the Frontier Fields, the gravitational lensing potential of J0717 has been modeled by several groups using a variety of techniques, and the results are publicly available111http://www.stsci.edu/hst/campaigns/frontier-fields/. We compared the results of all models for which we could derive deflection angle maps at the redshift of interest (those of Bradač, CATS, Sharon, and Zitrin) to assess which is best suited to the purposes of this work. We note that those models are aimed at producing a global description of the cluster and therefore their accuracy in the vicinity of the lensed images of interest is expected to vary significantly between them. The Sharon version 2 model (Johnson et al., 2014) produced the best results for our images, yielding the most precise inversion. The precision of the inversion was evaluated by comparing for each set of multiple images the promixity of the inferred source position, and the agreement beetween source plane flux and morphology. However, even the best global model produced significant residual differences between the reconstructed sources, requiring an additional step, as described in the next paragraph.
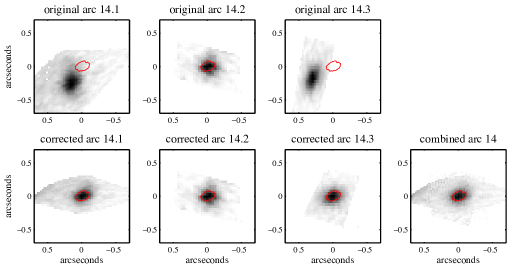
In order to take full advantage of the multiple images of each arc system, we have developed a novel technique to align all images in the source plane. This allows us to reduce the lensing-related uncertainties and combine the data from multiple images to increase the signal-to-noise ratio of emission line maps. The full details of our methodology will be presented by Wang et al. (2014, in prep); here we give only a brief overview. Essentially, we are considering the global cluster model as an approximate first solution and we are seeking corrections to the potential to improve the reconstruction. We assume that the corrections are small and can thus be described by a local correction to the lensing potential up to the first two orders of derivatives. The first order term consists of a correction to the deflection angle for each image. The second order term yields corrections to the shear and convergence. The procedure has thus five free parameters per image. The optimal parameters are found by requiring the source plane reconstructions of each set of multiple images to be as similar to each other as possible. We note that a direct byproduct of this formalism is a correction to the magnification of each image.
We have applied this method to the arc systems 3, 4, and 14, using the least distorted (i.e., least magnified) image of each system as a reference. Figure 3 shows multiple images of arc 14 reconstructed with and without the lens model corrections to illustrate the advantage. The source plane positions are offset by kpc using the original model, while the model corrections produce consistent positions and morphologies for all three reconstructed images. The second order correction is thus sufficient for our purposes. In all cases the correction is relatively small, amounting to % of the total lensing deflection angle.
In the following analysis we combine emission line maps from multiple images in the source plane in order to increase the measurement precision. However, including less highly magnified images provides a marginal improvement at the cost of degraded spatial resolution. We therefore use arcs 3.13.2, arc 4.1 only, and arcs 14.114.3 to optimize resolution and sensitivity. Final results are consistent with measurements from individual images, as well as with results derived from the original lens model. Combining multiple images improves the precision in metallicity gradients by an impressive factor of for arcs 3 and 14 by enabling finer spatial sampling and detection of more extended low surface brightness emission. We derive a conservative uncertainty of 13% RMS in the magnification factors (prior to second order correction) by comparing measured flux ratios of multiple images with model-predicted magnification ratios. This error is not propagated in the following analysis, however it is small compared to other sources of uncertainty and has no effect on the results.
5. Physical properties
5.1. Stellar mass
We use the stellar population synthesis code FAST version 1.0 (Kriek et al., 2009) to fit the resolved spectral energy density (SED) of each galaxy of interest. For , the rest-frame UV through optical SEDs are well constrained by broad-band HST photometry taken as part of the CLASH survey (Postman et al., 2012). We utilize the ACS/F435W, ACS/F606W, ACS/F814W, and WFC3/F125W filters which sample nearly the full rest-frame wavelength range from 1250–4900 Å. This set of filters is chosen to provide the widest possible wavelength coverage while avoiding contamination from the strong emission lines Ly, [O ii], and [O iii] which can significantly affect the broad-band photometry and derived stellar population properties. In particular, [O iii] emission accounts for 25% of the total WFC3/F160W flux (an increase of 0.3 magnitudes) and [O ii] significantly affects the WFC3/F105W flux for the galaxies discussed here.
Our methodology is as follows. We first align all images with the GLASS F105W direct image and smooth to a common point spread function of 02 FWHM. The broad-band fluxes in each pixel are fit with a Bruzual & Charlot (2003) stellar population library, Chabrier (2003) initial mass function, Milky Way dust attenuation law, stellar ages between 5 Myr and the age of the universe at the galaxy’s redshift, and an exponentially declining star formation history with yr. The quantity of greatest interest is the derived stellar mass surface density, which is the most robust parameter. Other stellar population parameters (SFR, age, extinction, etc.) are obtained simultaneously albeit with larger uncertainty. We have repeated the SED analysis using additional broad-band filters corrected for emission line contamination using the flux maps described in Section 3, verifying that this produces consistent results. Total stellar masses derived from integrated photometry and corrected for magnification are listed in Table 1.
5.2. Morphology
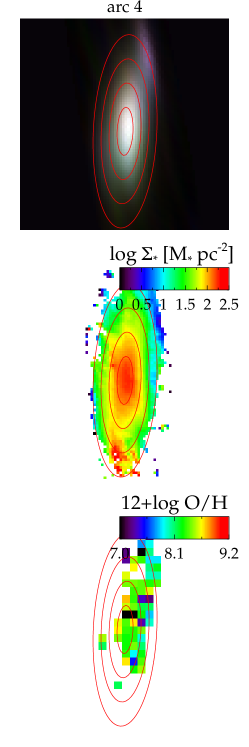
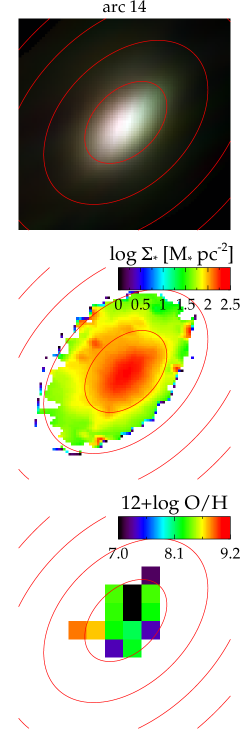
Morphological information is critical for measuring accurate metallicity gradients, as the radial coordinate depends on a galaxy’s central position and inclination. Ideally the dynamical center, major axis orientation, and inclination would be constrained from kinematics as has been done for previous work (e.g., Jones et al., 2013), but we lack kinematic data. Instead we derive estimates of these quantities by assuming that the stellar mass surface density derived in Section 5.1, , is elliptically symmetric. We reconstruct using the lens model (Section 4) and fit for the centroid, orientation, and axis ratio. Only the most highly magnified image in each arc system is used in order to maximize the spatial resolution. In the following analysis we adopt the galaxy center and inclination such that contours of trace contours of constant de-projected radius.
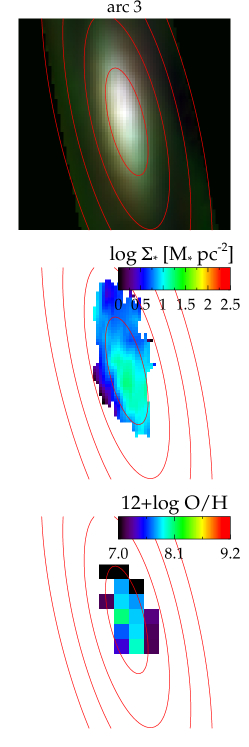
Source plane distributions and best-fit ellipses are shown in Figure 4. All galaxies exhibit smooth, centrally peaked stellar mass profiles with contours that are fit by ellipsoids. Within the stellar mass uncertainty, we find no evidence for ongoing late-stage major mergers which could manifest as a secondary peak in the stellar mass density.
5.3. Metallicity and nebular extinction
We use the strong line ratio calibrations presented by Maiolino et al. (2008) to estimate gas-phase oxygen abundance (expressed as ) and nebular extinction A(V) from measured [O ii], [Ne iii], H, H, and [O iii] fluxes. An advantage of these lines is that they directly trace the oxygen abundance, as opposed to [N ii]-based diagnostics which may suffer from redshift-dependent systematic errors arising from evolution in the N/O ratio or other effects (e.g., Shapley et al., 2014; Steidel et al., 2014). We use a Cardelli, Clayton, & Mathis (1989) extinction curve with R, noting that the choice of RV has no significant effect on the derived metallicity (typically dex for ). To further constrain A(V), we impose as expected for Case B recombination and typical H ii region conditions (e.g., Hummer & Storey, 1987). Metallicity and extinction are derived from a statistic constructed from all available diagnostics:
Here is the difference between predicted and observed de-reddened flux ratios at a given A(V) and , and the uncertainty includes RMS scatter in each calibration added in quadrature with measurement uncertainty. The diagnostic ratios used are R23 ([O ii]+[O iii])/Hb, [O iii]/[O ii], [O iii]/Hb, [O ii]/Hb, [Ne iii]/[O ii], and H/H. We adopt the best fit as the values that minimize , and 1 uncertainty from the extrema at which differs by 1 from the minimum value. This is slightly smaller than the formal uncertainty because of covariance between various metallicity diagnostics; we have checked that a more careful treatment does not affect the conclusions. We limit the solutions to A(V) and (equivalent to the solar abundance of ; Allende Prieto et al., 2001). While the formal best-fit solutions are occasionally beyond this range, all such cases are poorly constrained and we view such extreme conditions as highly unlikely. Although the extinction is poorly constrained for most individual pixels, SED fitting (Section 5.1) and averaged HH ratios indicate relatively low extinction toward both the stars and H ii regions, with best-fit A(V) and permitted A(V) (1) in the dustiest case. Fortunately, uncertainty in extinction has little effect on the derived metallicity since many diagnostic line ratios are relatively insensitive to reddening.
Maps of the source plane gas-phase metallicity are shown in Figure 4. The emission line maps are binned to spatial scales of pc and the metallicity is fit for all such pixels where at least one emission line is detected at significance. All sources are well resolved with measurements extending over resolution elements for arc 3, and resolution elements for the others. The metallicity is typically sub-solar with most pixels having best-fit in the range 7.58.5, corresponding to flux ratios and . Figure 4 also shows several pixels for which the best-fit metallicity is at the extreme ends of the permitted range; these usually correspond to noise artifacts and/or single-line detections and are therefore unreliable.
In addition to the spatially resolved analysis, we calculate galaxy-averaged metallicity and extinction by applying the same analysis to total emission line fluxes measured from integrated 1-D spectra. The results agree with the average of individual pixel values (Table 1), providing a valuable sanity check. The slightly lower average metallicity of individual pixels c.f. integrated flux is likely due to the requirement of a 5 detection of [O iii] (the brightest emission line), which induces a bias toward lower metallicity. Extinction-corrected Balmer line fluxes derived from this analysis are used to determine star formation rates in Section 5.5.
5.4. Metallicity gradient
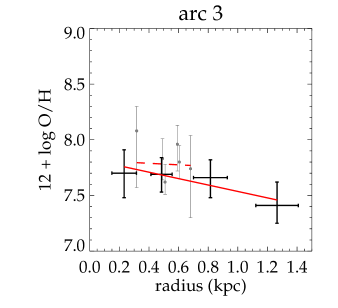
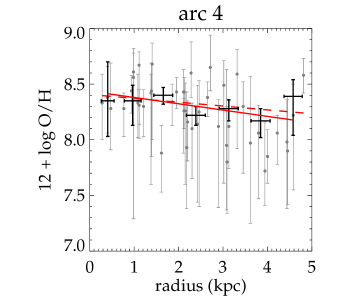
Gas-phase metallicity gradients are derived from the morphology and metallicity analyses described in Sections 5.2 and 5.3, respectively. In essence we measure the mean metallicity as a function of galactocentric radius in the source plane, utilizing knowledge of the major axis and inclination of each galaxy. We consider two approaches based on (1) individual pixels and (2) radial binning. For the first method, we compute the gradient from a linear fit to the metallicity vs. de-projected radius of individual pixels (those shown in Figure 4):
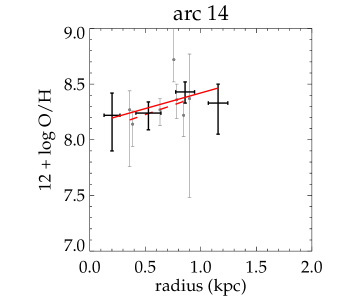
= Z_0 + ΔZΔR R. This functional form is a good fit to the data and we are unable to distinguish more complex behavior given the measurement uncertainties. Pixels for which the allowed (1) range of extends to or are excluded from the fit as these are generally unreliable and have large uncertainty ( dex), although including these data gives consistent results. For the second method we bin the emission line flux in annular apertures for each source, calculate metallicity from the total flux in each aperture, and compute the gradient using Equation 5.4. The range of radii for each annulus is chosen to provide a detection of [O iii], which is uniformly the strongest emission line. We show the data and best-fit gradients in Figure 5 and list the results in Table 1. Uncertainty in inclination and magnification are not included in these error estimates, but these effects are small (% combined) compared to uncertainty in the metallicities. Both methods of calculating the metallicity gradient use the same diagnostics applied to the same data set and give consistent results. The pixelated approach is similar to local galaxy measurements which are based on individual H ii regions (e.g., Vila-Costas & Edmunds, 1992), and the radial binning method is equivalent to most measurements reported for high redshift galaxies (Yuan et al., 2011; Swinbank et al., 2012; Queyrel et al., 2012; Stott et al., 2014). The primary differences are that the annular binning method is higher signal to noise ratio and is spatially complete, whereas low surface brightness regions are either noisy or excluded from the pixelated method. We therefore consider the annular binning method to be more robust.
5.5. Star formation rate
Star formation rates are derived from Balmer emission using standard methods. We convert the extinction-corrected total H flux (Section 5.3) to SFR following Kennicutt (1998), divide by 1.7 to convert to a Chabrier (2003) IMF, and divide by the lensing magnification to recover the intrinsic SFR of each galaxy. Results are given in Table 1 including uncertainty from measurement noise and extinction. Additional uncertainties associated with the choice of and underlying stellar absorption (for which we make no correction) are negligible.
5.6. AGN contamination
In calculating metallicities and SFR we have assumed that all nebular emission arises in H ii regions. The presence of shocks or AGN can bias these results even for very weak nuclear sources and we therefore check for any possible contamination. The global flux ratios of each galaxy, as well as the individual annular bins shown in Figure 5, are consistent with H ii regions. However in all cases the line ratios fall in the region occupied by both H ii and AGN excitation (for example in the ”blue” diagnostic diagram of [O iii]/Hb vs. [O ii]/Hb, e.g., Lamareille, 2010), and we lack a low-excitation line such as [N ii] or [S ii] which would permit more reliable classification (e.g., Jones et al., 2013). Publicly available Chandra/ACIS data222Available at http://cxc.cfa.harvard.edu/cda/ show no X-ray detection for any of the arcs, and all three arcs have moderate-resolution Keck spectra which show no sign of AGN features (Schmidt et al., 2014; Limousin et al., 2012). We note that the central resolution element of arc 14 shows marginal evidence () of an elevated [O iii]H ratio as expected for AGN (e.g., Wright et al., 2010; Newman et al., 2014). Trump et al. (2011) have associated this signal with a significant AGN fraction in stacks of galaxies of similar stellar mass and redshift whose individual X-ray luminosities are below the detection threshold, although it is not a reliable indicator of AGN in individual galaxies. To summarize, we find no conclusive evidence of AGN but cannot rule out a possible low-level contribution to the emission line flux from a nuclear source. The expected effect of such activity would be to lower the derived central metallicity, with no significant effect on SFR or stellar masses.
| ID | log M∗ | SFR | 11Average and RMS scatter of individual pixels | 22Best fit and 1 uncertainty derived from integrated spectrum | 33Derived from individual pixels | 44Derived from total flux in radial apertures | |
|---|---|---|---|---|---|---|---|
| [log ] | [] | [dex kpc-1] | [dex kpc-1] | ||||
| arc 3 | 1.855 | 7.20.4 | 1.8 | 7.560.37 | 7.75 | -0.071.06 | -0.290.25 |
| arc 4 | 1.855 | 9.1 | 29 | 8.200.34 | 8.35 | -0.030.03 | -0.050.05 |
| arc 14 | 1.855 | 8.8 | 3.3 | 8.110.31 | 8.30 | 0.340.41 | 0.280.29 |
6. Results and discussion
6.1. Global properties
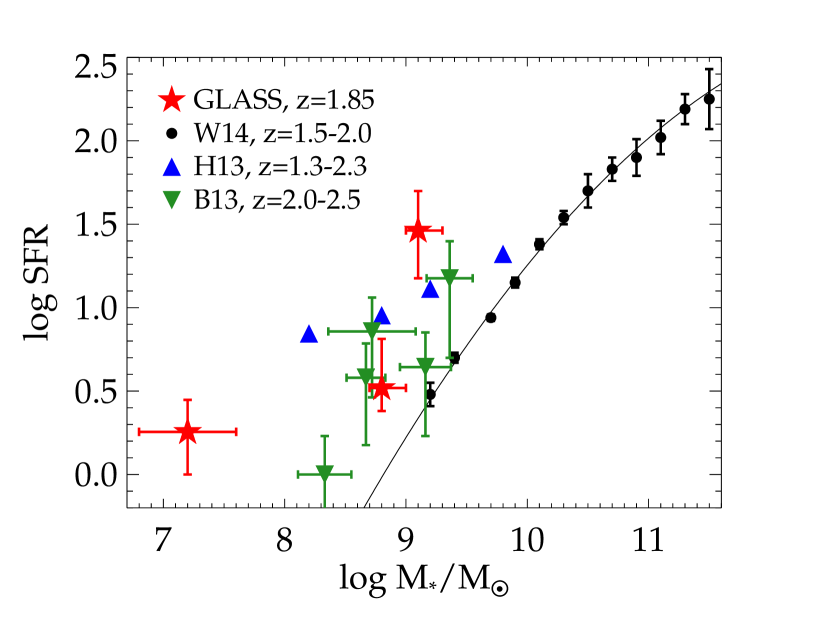
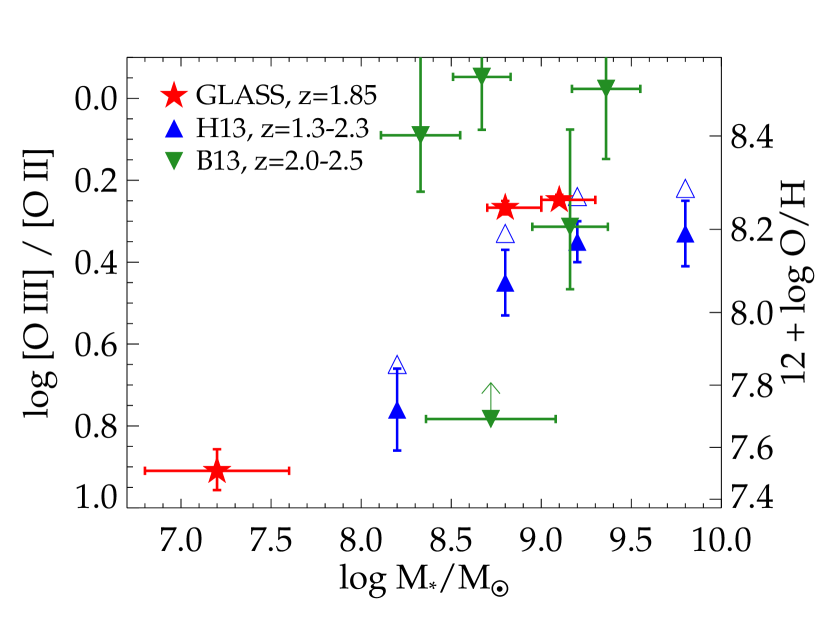
In this section we examine the GLASS sample studied here in the context of the general galaxy population, as a prelude to discussing the implications of our results for galaxy evolution. Figure 6 summarizes the demographic properties compared to larger published samples at similar redshift. Comparison samples are carefully chosen to minimize systematic effects: the narrow range of redshift mitigates any evolutionary trends, all data points are calculated with the same IMF and stellar population templates, and all stellar masses account for the contribution of emission lines to broad-band photometry. Ignoring this last effect would result in higher stellar masses by dex for arcs 4 and 14 and dex for arc 3, in excellent agreement with the mass-dependent estimates by Whitaker et al. (2014). In lieu of metallicity, we use [O iii][O ii] flux ratios for a clear comparison of observable properties. While this ratio is sensitive to metallicity, ionization parameter, and reddening, all of these quantities are intrinsically correlated and vary monotonically with [O iii][O ii] (e.g., Maiolino et al., 2008; Dopita et al., 2013). Furthermore, this ratio offers the lowest statistical uncertainty and the greatest sensitivity to metallicity of the available strong-line diagnostics in the sub-solar regime. We can therefore directly compare relative oxygen abundances between different samples, noting that secondary parameter dependences result in dex RMS scatter between metallicity and [O iii][O ii]. In comparison to the overall population, the galaxies studied here have SFRs which are a factor of above the ”main sequence” locus of SFR and M∗ (Figure 6). Such high relative SFRs are often induced by gravitational interactions, and indeed Stott et al. (2013) show that % of sources at this SFR, M∗, and are merger events. The metallicities inferred from [O iii][O ii] are consistent with comparison samples of similar SFR and M∗, as are the nebular extinction values. The GLASS data are also consistent with a steep mass-metallicity relation as found by Henry et al. (2013), although the scatter in Figure 6 is large. To summarize, the global properties are typical of low-mass starbursts at which are frequently associated with galaxy interactions.
6.2. Metallicity gradient evolution
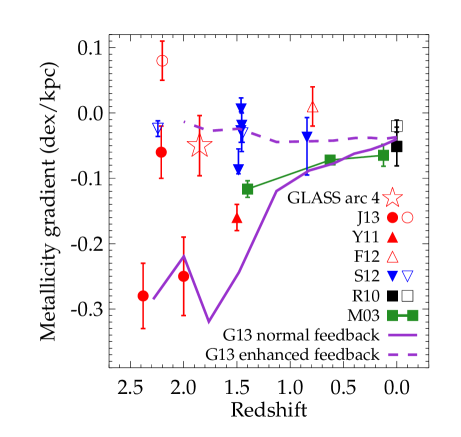
We now turn to a discussion of the metallicity gradient of arc 4 and its evolution with redshift. Figure 7 compares the GLASS data with similar measurements as a function of redshift. Arcs 3 and 14 are not included because their gradients are poorly constrained, due to their small physical sizes and lower signal to noise ratio. In all three cases the gradients are consistent with zero at the level. We restrict the comparison sample to measurements with kpc resolution, noting that even kpc resolution results in artificially flat inferred gradients for typical high redshift galaxies (e.g., Yuan et al., 2013; Stott et al., 2014). We show original published values for all comparison data with the caveat that they are derived using different strong-line calibrations; this has minimal effect on our conclusions since metallicity gradients are relatively insensitive to the choice of calibration (Jones et al., 2013). The lensed source described by Frye et al. (2012) is also included with a previously unpublished gradient slope of dex kpc-1 (B. Frye, private communication). However none of the comparison data include scatter in metallicity in the formal uncertainty, hence the error bar on arc 4 is the most conservative of those shown in Figure 7. Ideally we would construct a sample which corresponds to approximately the same galaxy population (as was done in Jones et al., 2013), but we are presently limited by the available data at high redshift. The result is that arc 4 is expected to have dex lower stellar masses at a given redshift than average sources in Figure 7, which are approximately Milky Way analogs (based on abundance matching; e.g., Behroozi et al., 2013). Nonetheless this provides a useful comparison. Figure 7 demonstrates that interacting galaxies (shown as open symbols) have flatter gradients than isolated counterparts. This is most evident in the lensed and samples which have the best spatial resolution. Here we include arc 4 as an interacting system on the basis of its proximity to arc 14 and its enhanced SFR. Measurements of nearby galaxies have shown dramatically flattened gradients in pairs with the same projected separation as arcs 4–14 (Rich et al., 2012, and references therein) which further motivates this classification. The relatively shallow metallicity gradient of arc 4 is therefore fully consistent with expected gravitational interaction. The gradient of arc 14 is also consistent with a near-zero value expected in this scenario. Arc 3 may have a shallow gradient as well, although this is not necessarily expected given its larger projected distance. An alternative cause for shallow gradients measured in the GLASS data is metal mixing by strong feedback. To illustrate this, Figure 7 shows evolutionary tracks for two simulations with different sub-grid feedback prescriptions of an otherwise identical Milky Way-like galaxy discussed by Gibson et al. (2013), and we now briefly summarize their findings. The ”normal” feedback simulation (MUGS; Stinson et al., 2010) results in relatively steep metallicity gradients of 0.2–0.3 dex kpc-1 at which flatten at later times. The MaGICC simulation (Brook et al., 2011) employs an enhanced feedback scheme, in which galactic outflows are more effective at removing metal-enriched ISM material which is re-accreted preferentially in outer regions. This mixing of the ISM results in shallower gradients of dex kpc-1 which become marginally steeper with time. Other groups have found essentially identical behavior with various feedback mechanisms which act to redistribute energy and ISM material throughout galactic disks (e.g., Yang & Krumholz, 2012; Anglés-Alcázar et al., 2014). The enhanced feedback results in Figure 7 are in excellent agreement with the shallow gradient measured for arc 4 as well as for arc 14. Arc 3 is expected to have a steeper negative gradient than shown by these models due to its lower mass (e.g., Few et al., 2012), but we are unable to distinguish between a shallow and steep negative gradient within the uncertainty. The overall metallicity can in principle help to identify the cause of shallow gradients: rapidly recycled outflows should produce a signature of higher metallicity, whereas gravitational interactions should have an opposite effect (e.g., Rich et al., 2012). We note that Kulas et al. (2013) report evidence for rapid recycling in a protocluster at based on stacked spectra, and we might expect a similar observational signature in the overdense region studied here. However, the expected differences are small ( dex; Torrey et al., 2012; Kulas et al., 2013) compared to measurement uncertainties so we are unable to distinguish these scenarios without additional complementary data. In any case the shallow gradient in arc 4 suggests that metals are efficiently mixed throughout the ISM on scales of several kpc.
6.3. A starbursting dwarf galaxy at
One of the most striking aspects of Figure 6 is the low stellar mass of arc 3, M. This is an order of magnitude below previous metallicity studies at and extends into the regime of Milky Way dwarf satellites. Since such galaxies have rarely been studied directly at high redshift (Christensen et al., 2012; Stark et al., 2014; Atek et al., 2014), we briefly consider the properties of arc 3 in the context of recent cosmological simulations and local group analogs. Both simulations and observations of nearby dwarf galaxies suggest that in the mass regime of arc 3, 50% of its present-day stellar mass has already formed by (Shen et al., 2014; Weisz et al., 2011). In terms of mass it is therefore roughly analogous to the ”Doc” simulation of Shen et al. (2014), and to the Milky Way dwarf spheroidal Fornax (e.g., Coleman & de Jong, 2008). This is supported by the overall oxygen abundance (equivalent to [O/H] ) which is in excellent agreement with the stellar -element abundance distribution of Fornax (Kirby et al., 2011). Figure 5 indicates a gas-phase metallicity gradient of which is also compatible with Fornax’s present-day stellar metallicity gradient ( dex kpc-1; Hendricks et al., 2014). However the uncertainty is large, and these two quantities need not be identical if there is significant radial growth or dynamical evolution of stellar orbits. Such a steep gradient would imply that any dynamical interaction in arc 3 is insufficient for strong radial mixing, and this is consistent with Rich et al. (2012) given that the nearest detected neighbor (arc 14) is separated by 150 kpc in projection. We measure an instantaneous specific star formation rate of for arc 3, i.e., a mass doubling time of only yr. However we caution that this is calculated assuming constant SFR over the previous Myr, which is likely not the case: such a high value, as well as the high ratio of Balmer line flux to UV luminosity and the stellar population modeling described in Section 5.1, suggests a short duty cycle for the current burst of star formation. Such intense short starbursts are predicted by several simulations of dwarf galaxies (e.g., Governato et al., 2012; Zolotov et al., 2012; Brooks & Zolotov, 2014; Shen et al., 2014), and may be triggered by interactions or by gradual accumulation of a large gas reservoir. Bursty star formation histories are of particular interest in light of observations that the central regions of local group dwarf galaxies are less dense than predicted for CDM cosmology in the absence of baryonic feedback (the ”too big to fail” problem; Boylan-Kolchin et al., 2011). These simulations have found that repeated bursts of star formation and strong feedback in dwarf galaxies can affect the gravitational potential, transforming dark matter density profiles from cusps to cores, and have been postulated to reconcile CDM with observations of local group substructure (although see also Garrison-Kimmel et al., 2013). The high SFR surface density of arc 3 is sufficient to drive outflows with high mass loading factors (Newman et al., 2012) as required by these simulations. However we do not directly constrain the outflow properties, and direct measurements of outflowing gas are extremely challenging for the luminosity of arc 3. One means of making progress is to measure the mass-metallicity relation slope which is sensitive to the properties of stellar feedback. The data shown in Figure 6 are consistent with feedback in the form of strong energy-driven galactic winds (Henry et al., 2013), but of course a larger sample will be required to better constrain the mass-metallicity relation at M. We expect to find several dozen such low-mass sources in the full GLASS survey, which will represent the first statistical constraint of chemical enrichment and feedback at high redshift in the mass regime where galaxies are in tension with CDM. The present data for arc 3 are generally consistent with simulations in which bursty star formation and strong feedback significantly lower the central density of dwarf galaxies.
7. Conclusions
This work presents a case study of galaxy evolution in a dense environment at from the GLASS survey, utilizing the spatial resolution of HST aided by gravitational lensing. We study three galaxies in close physical proximity (50–200 kpc projected separations) and measure their spatially resolved metallicities from HST grism spectra. Our main results are as follows:
-
•
All three galaxies appear to be affected by interaction-induced gas flows, evidenced by their close proximity and specific star formation rates which are above the median value for their M∗ and redshift.
-
•
We measure a precise metallicity gradient for one galaxy and find a shallow slope compared to other sources at similar redshift, as expected from gravitational interactions. The gradients are also consistent with strong stellar feedback resulting in higher metallicity of accreted (recycled) gas, although we find no evidence of enhanced metallicity which should result from this effect.
-
•
The stellar mass range extends an order of magnitude below previous metallicity surveys at . The data are consistent with a steep mass-metallicity relation found in previous work, and the full GLASS survey should yield a sufficient sample to measure metallicity trends in the range M.
-
•
We present the first spatially resolved spectrophotometric analysis of a bona-fide dwarf galaxy at with stellar mass M. It is analogous to Fornax in terms of its stellar mass, metallicity, and metallicity gradient. Its extremely high SSFR indicates a violent starburst, likely with a low duty cycle, consistent with the hypothesis that successive starbursts with strong feedback are responsible for flattening the central density profiles of dwarf galaxies.
Measuring accurate metallicity gradients at high redshift is a significant observational challenge which, when overcome, is expected to elucidate various aspects of the galaxy formation process. Observing lensed galaxies at resolution is the best way to obtain the requisite spatial sampling (Yuan et al., 2013). Previously only 5 such gradient measurements have been reported in the literature (Jones et al., 2010, 2013; Yuan et al., 2011), although we note that improvements to the Keck/OSIRIS spectrograph and adaptive optics system have enabled recent observations of a significantly larger sample (Leethochawalit et al. in prep). Our analysis of HST data provides further support for a scenario in which gravitational interactions and mergers cause a temporary flattening of gradients, while isolated galaxies at high redshift have steep negative metallicity gradients consistent with standard feedback models. More importantly, our results constitute a proof-of-concept that HST grism spectra obtained with the GLASS survey yield precise gradient slope measurements with conservative uncertainty dex kpc-1 in good cases. This is enabled by the combination of broad wavelength coverage and high spatial resolution aided by gravitational lensing. We note that similar previous work has shown the benefits of this approach, including several studies of lensed galaxies observed with HST grisms (Brammer et al., 2012; Frye et al., 2012; Whitaker et al., 2014). This paper presents the complete methodology developed for such measurements, including a significant improvement over previous lensing studies by combining data from multiple strongly lensed images (Section 4; Wang et al. in prep). From visual inspection of the current GLASS data, we identify galaxies per cluster at with multiple bright emission lines suitable for resolved metallicity analysis. We expect the full survey to yield high-quality gradient measurements (comparable to arc 4) for approximately 20 of these galaxies. (This metallicity gradient sample will most likely be composed of relatively massive galaxies with M, while at the same time we expect to characterize the properties of a larger sample of low-mass galaxies with modest spatial information). We anticipate that such a large sample will conclusively establish whether metallicity gradient slopes are steeper or shallower at compared to local descendants, and more generally how metallicity gradients evolve over time. This will have significant implications for sub-grid feedback prescriptions used in cosmological simulations (e.g., Gibson et al., 2013; Anglés-Alcázar et al., 2014), which in turn inform our understanding of baryon cycling and chemical enrichment of the circum- and inter-galactic media, and the role of this baryon cycle in galaxy formation.
References
- Allende Prieto et al. (2001) Allende Prieto, C., Lambert, D. L., & Asplund, M. 2001, ApJ, 556, L63
- Anglés-Alcázar et al. (2014) Anglés-Alcázar, D., Davé, R., Özel, F., & Oppenheimer, B. D. 2014, ApJ, 782, 84
- Atek et al. (2014) Atek, H., et al. 2014, ApJ, 789, 96
- Behroozi et al. (2013) Behroozi, P. S., Wechsler, R. H., & Conroy, C. 2013, ApJ, 770, 57
- Belli et al. (2013) Belli, S., Jones, T., Ellis, R. S., & Richard, J. 2013, ApJ, 772, 141
- Bertin & Arnouts (1996) Bertin, E., & Arnouts, S. 1996, A&AS, 117, 393
- Boylan-Kolchin et al. (2011) Boylan-Kolchin, M., Bullock, J. S., & Kaplinghat, M. 2011, MNRAS, 415, L40
- Brammer et al. (2012) Brammer, G. B., et al. 2012, ApJ, 758, LL17
- Bresolin et al. (2012) Bresolin, F., Kennicutt, R. C., & Ryan-Weber, E. 2012, ApJ, 750, 122
- Brook et al. (2011) Brook, C. B., et al. 2011, MNRAS, 415, 1051
- Brooks & Zolotov (2014) Brooks, A. M., & Zolotov, A. 2014, ApJ, 786, 87
- Bruzual & Charlot (2003) Bruzual, G., & Charlot, S. 2003, MNRAS, 344, 1000
- Cardelli, Clayton, & Mathis (1989) Cardelli, J. A., Clayton, G. C., & Mathis, J. S. 1989, ApJ, 345, 245
- Chabrier (2003) Chabrier, G. 2003, ApJ, 586, L133
- Chiappini et al. (2001) Chiappini, C., Matteucci, F., & Romano, D. 2001, ApJ, 554, 1044
- Christensen et al. (2012) Christensen, L., et al. 2012, MNRAS, 427, 1953
- Coleman & de Jong (2008) Coleman, M. G., & de Jong, J. T. A. 2008, ApJ, 685, 933
- Cresci et al. (2010) Cresci, G., Mannucci, F., Maiolino, R., et al. 2010, Nature, 467, 811
- Davé et al. (2011) Davé, R., Finlator, K., & Oppenheimer, B. D. 2011, MNRAS, 416, 1354
- Dekel et al. (2009) Dekel, A., Sari, R., & Ceverino, D. 2009, ApJ, 703, 785
- Dopita et al. (2013) Dopita, M. A., Sutherland, R. S., Nicholls, D. C., Kewley, L. J., & Vogt, F. P. A. 2013, ApJS, 208, 10
- Faucher-Giguère et al. (2011) Faucher-Giguère, C.-A., Kereš, D., & Ma, C.-P. 2011, MNRAS, 417, 2982
- Few et al. (2012) Few, C. G., Gibson, B. K., Courty, S., et al. 2012, A&A, 547, A63
- Frye et al. (2012) Frye, B. L., et al. 2012, ApJ, 754, 17
- Fu et al. (2009) Fu, J., Hou, J. L., Yin, J., & Chang, R. X. 2009, ApJ, 696, 668
- Garrison-Kimmel et al. (2013) Garrison-Kimmel, S., Rocha, M., Boylan-Kolchin, M., Bullock, J. S., & Lally, J. 2013, MNRAS, 433, 3539
- Gibson et al. (2013) Gibson, B. K., Pilkington, K., Brook, C. B., Stinson, G. S., & Bailin, J. 2013, A&A, 554, A47
- Governato et al. (2012) Governato, F., et al. 2012, MNRAS, 422, 1231
- Heckman (2001) Heckman, T. M. 2001, Gas and Galaxy Evolution, 240, 345
- Hendricks et al. (2014) Hendricks, B., Koch, A., Walker, M., Johnson, C. I., Peñarrubia, J., & Gilmore, G. 2014, A&A, 572, AA82
- Henry et al. (2013) Henry, A., et al. 2013, ApJ, 776, L27
- Hummer & Storey (1987) Hummer, D. G., & Storey, P. J. 1987, MNRAS, 224, 801
- Johnson et al. (2014) Johnson, T. L., Sharon, K., Bayliss, M. B., Gladders, M. D., Coe, D., & Ebeling, H. 2014, ApJ, 797, 48
- Jones et al. (2010) Jones, T., Ellis, R., Jullo, E., & Richard, J. 2010, ApJ, 725, L176
- Jones et al. (2013) Jones, T., Ellis, R. S., Richard, J., & Jullo, E. 2013, ApJ, 765, 48
- Kennicutt (1998) Kennicutt, R. C., Jr. 1998, ARA&A, 36, 189
- Kereš et al. (2009) Kereš, D., Katz, N., Fardal, M., Davé, R., & Weinberg, D. H. 2009, MNRAS, 395, 160
- Kirby et al. (2011) Kirby, E. N., Cohen, J. G., Smith, G. H., Majewski, S. R., Sohn, S. T., & Guhathakurta, P. 2011, ApJ, 727, 79
- Kriek et al. (2009) Kriek, M., van Dokkum, P. G., Labbé, I., Franx, M., Illingworth, G. D., Marchesini, D., & Quadri, R. F. 2009, ApJ, 700, 221
- Kulas et al. (2013) Kulas, K. R., et al. 2013, ApJ, 774, 130
- Lamareille (2010) Lamareille, F. 2010, A&A, 509, A53
- Lequeux et al. (1979) Lequeux, J., Peimbert, M., Rayo, J. F., Serrano, A., & Torres-Peimbert, S. 1979, A&A, 80, 155
- Limousin et al. (2012) Limousin, M., et al. 2012, A&A, 544, A71
- Maciel et al. (2003) Maciel, W. J., Costa, R. D. D., & Uchida, M. M. M. 2003, A&A, 397, 667
- Magrini et al. (2007) Magrini, L., Corbelli, E., & Galli, D. 2007, A&A, 470, 843
- Maiolino et al. (2008) Maiolino, R., et al. 2008, A&A, 488, 463
- Nelson et al. (2012) Nelson, E. J., et al. 2012, ApJ, 747, L28
- Newman et al. (2012) Newman, S. F., et al. 2012, ApJ, 761, 43
- Newman et al. (2014) Newman, S. F., et al. 2014, ApJ, 781, 21
- Pettini & Pagel (2004) Pettini, M., & Pagel, B. E. J. 2004, MNRAS, 348, L59
- Pilkington et al. (2012) Pilkington, K., et al. 2012, A&A, 540, A56
- Planck Collaboration (2014) Planck Collaboration: Ade, P. A. R., et al. 2014, A&A, 571, AA16
- Postman et al. (2012) Postman, M., et al. 2012, ApJS, 199, 25
- Prantzos & Boissier (2000) Prantzos, N., & Boissier, S. 2000, MNRAS, 313, 338
- Queyrel et al. (2012) Queyrel, J., Contini, T., Kissler-Patig, M., et al. 2012, A&A, 539, A93
- Rich et al. (2012) Rich, J. A., Torrey, P., Kewley, L. J., Dopita, M. A., & Rupke, D. S. N. 2012, ApJ, 753, 5
- Rupke et al. (2010a) Rupke, D. S. N., Kewley, L. J., & Barnes, J. E. 2010, ApJ, 710, L156
- Rupke et al. (2010b) Rupke, D. S. N., Kewley, L. J., & Chien, L.-H. 2010, ApJ, 723, 1255
- Sánchez et al. (2014) Sánchez, S. F., et al. 2014, A&A, 563, A49
- Schmidt et al. (2014) Schmidt, K. B., et al. 2014, ApJ, 782, L36
- Shapley et al. (2014) Shapley, A. E., Reddy, N. A., Kriek, M., et al. 2014, arXiv:1409.7071
- Shen et al. (2014) Shen, S., Madau, P., Conroy, C., Governato, F., & Mayer, L. 2014, ApJ, 792, 99
- Stark et al. (2014) Stark, D. P., et al. 2014, MNRAS, 445, 3200
- Steidel et al. (2014) Steidel, C. C., et al. 2014, ApJ, 795, 165
- Stinson et al. (2010) Stinson, G. S., Bailin, J., Couchman, H., Wadsley, J., Shen, S., Nickerson, S., Brook, C., & Quinn, T. 2010, MNRAS, 408, 812
- Stott et al. (2013) Stott, J. P., Sobral, D., Smail, I., Bower, R., Best, P. N., & Geach, J. E. 2013, MNRAS, 430, 1158
- Stott et al. (2014) Stott, J. P., et al. 2014, MNRAS, 443, 2695
- Swinbank et al. (2012) Swinbank, A. M., Sobral, D., Smail, I., Geach, J. E., Best, P. N., McCarthy, I. G., Crain, R. A., & Theuns, T. 2012, MNRAS, 426, 935
- Torrey et al. (2012) Torrey, P., Cox, T. J., Kewley, L., & Hernquist, L. 2012, ApJ, 746, 108
- Tremonti et al. (2004) Tremonti, C. A., et al. 2004, ApJ, 613, 898
- Troncoso et al. (2014) Troncoso, P., et al. 2014, A&A, 563, A58
- Trump et al. (2011) Trump, J. R., et al. 2011, ApJ, 743, 144
- Vila-Costas & Edmunds (1992) Vila-Costas, M. B., & Edmunds, M. G. 1992, MNRAS, 259, 121
- Weisz et al. (2011) Weisz, D. R., et al. 2011, ApJ, 739, 5
- Werk et al. (2011) Werk, J. K., Putman, M. E., Meurer, G. R., & Santiago-Figueroa, N. 2011, ApJ, 735, 71
- Whitaker et al. (2014) Whitaker, K. E., Rigby, J. R., Brammer, G. B., Gladders, M. D., Sharon, K., Teng, S. H., & Wuyts, E. 2014, ApJ, 790, 143
- Whitaker et al. (2014) Whitaker, K. E., et al. 2014, ApJ, 795, 104
- Wright et al. (2010) Wright, S. A., Larkin, J. E., Graham, J. R., & Ma, C.-P. 2010, ApJ, 711, 1291
- Yang & Krumholz (2012) Yang, C.-C., & Krumholz, M. 2012, ApJ, 758, 48
- Yuan et al. (2011) Yuan, T.-T., Kewley, L. J., Swinbank, A. M., Richard, J., & Livermore, R. C. 2011, ApJ, 732, L14
- Yuan et al. (2012) Yuan, T.-T., Kewley, L. J., Swinbank, A. M., & Richard, J. 2012, ApJ, 759, 66
- Yuan et al. (2013) Yuan, T.-T., Kewley, L. J., & Rich, J. 2013, ApJ, 767, 106
- Zolotov et al. (2012) Zolotov, A., et al. 2012, ApJ, 761, 71