Brightest Fermi-LAT Flares of PKS 1222+216: Implications on Emission and Acceleration Processes
Abstract
We present a high time resolution study of the two brightest -ray outbursts from a blazar PKS 1222+216 observed by the Fermi Large Area Telescope (LAT) in 2010. The -ray light-curves obtained in four different energy bands: 0.1–3, 0.1–0.3, 0.3–1 and 1–3 GeV, with time bin of 6 hr, show asymmetric profiles with a similar rise time in all the bands but a rapid decline during the April flare and a gradual one during the June. The light-curves during the April flare show days long plateau in 0.1–0.3 GeV emission, erratic variations in 0.3–1 GeV emission, and a daily recurring feature in 1–3 GeV emission until the rapid rise and decline within a day. The June flare shows a monotonic rise until the peak, followed by a gradual decline powered mainly by the multi-peak 0.1–0.3 GeV emission. The peak fluxes during both the flares are similar except in the 1–3 GeV band in April which is twice the corresponding flux during the June flare. Hardness ratios during the April flare indicate spectral hardening in the rising phase followed by softening during the decay. We attribute this behavior to the development of a shock associated with an increase in acceleration efficiency followed by its decay leading to spectral softening. The June flare suggests hardening during the rise followed by a complicated energy dependent behavior during the decay. Observed features during the June flare favor multiple emission regions while the overall flaring episode can be related to jet dynamics.
1 INTRODUCTION
The rapid, complex, high amplitude and broadband (radio to -rays) variability is a defining characteristic of a class of radio-loud active galactic nuclei (AGN) called blazars. These observed properties are believed to be a result of relativistic motion of non-thermal plasma along the jet, oriented at small angles to the observer’s line of sight (Urry & Padovani, 1995). The erratic variability combined with the complexity of organizing simultaneous multi-band observations and limitations of modern telescopes to resolve the emitting region makes multi-band variability studies and correlations as important tools to infer the underlying physical processes and the environment of AGNs. A detailed and systematic study of temporal and spectral features in different energy bands can offer a potential diagnostic for understanding the radiation mechanisms and underlying physical processes (Kirk et al., 1998; Kusunose et al., 2000; Bhattacharyya et al., 2005). For -ray bright AGNs with good photon statistics, the broadband energy coverage and continuous operation of Fermi-LAT offer a unique opportunity to extract multi-waveband light-curves down to scanning timescale of hours (see Vasileiou (2013) for more details), making such a study feasible at -ray energies.
The radiative output of high luminosity blazars, particularly the flat spectrum radio quasars (FSRQs) is mostly dominated by -ray emission in the GeV regime and beyond in some cases (Begelman et al., 2008). This emission is generally explained as a result of inverse Compton (IC) scattering of photons external to the jet by non-thermal electrons (Nalewajko et al., 2012; Sikora et al., 2013), commonly referred as external Compton (EC). Two sites– one at sub-parsec scales and another at parsec scales, have been suggested for dominant -ray emission/contribution (Agudo et al., 2013; Dotson et al., 2012). On sub-parsec scales ( 1 pc), -ray emission is due to the EC scattering of photons from broad line region (BLR) and/or accretion-disk (Finke & Dermer, 2010), while on parsec scales the EC scattering of infrared (IR) photons from the putative molecular/dusty torus can be dominant. The sub-parsec scenario has been very successful in explaining the observed SED and short time -ray variability of blazars until very recently. However, the latest radio and -ray correlation studies (Agudo et al., 2013; Fuhrmann et al., 2014) favor parsec scenario in most cases with further support from the detection of FSRQs at very high energies (VHE; MAGIC Collaboration et al., 2008; Wagner & H.E.S.S. Collaboration, 2010; Aleksić et al., 2011). In the parsec scale scenario; however, particle acceleration, bulk velocity, and emission regions associated with short time variability of few minutes to hours are matters of ongoing debate due to its larger distance from the central engine (Nalewajko et al., 2012; Agudo et al., 2013; Kushwaha et al., 2014).
Most of the studies till date have relied on spectral features (Abdo et al., 2011; Tanaka et al., 2011) and constraints from -ray opacity to infer the underlying mechanisms, seed photons and hence the location of emission sites in blazars (Aleksić et al., 2011; Tanaka et al., 2011; Nalewajko et al., 2012; Sahayanathan & Godambe, 2012; Kushwaha et al., 2014). However, spectral information from -ray emission is subject to Klein-Nishina (KN) softening, pair production and presence of intrinsic features in the particle spectra, making GeV emission and underlying processes hard to disentangle (Dotson et al., 2012). Moreover, if the underlying physical processes (particle acceleration and injection) are evolving faster than the cooling timescales, as suggested by the observations in cases of high luminosity blazars (Kushwaha et al., 2014), spectral information averaged over a longer duration data may lead to false inferences regarding these processes. High time resolution study of spectral, timing and variability features though, can be used to infer these timescales and their relative dominance, at least for bright sources. This, in fact, can also differentiate between multiple injections/emission-regions which on larger timescales seem coherent otherwise (Saito et al., 2013; Brown, 2013). However, only a truly simultaneous multi-band study holds the key to gain further insight into these enigmatic processes (Kirk et al., 1998; Chiaberge & Ghisellini, 1999).
PKS 1222+216 (4C +21.35111PKS 1222+21, PKS B1222+216; ) is a lobe dominated FSRQ at long radio wavelengths (cm onwards) and a known -ray emitter (Tanaka et al., 2011; Ackermann et al., 2014, and references therein). In high resolution radio maps, it shows a strong jet bending (Saikia et al., 1993; Cooper et al., 2007) and superluminal knots with complex 3D trajectories suggesting non-radial accelerations (Homan, 2012; Ackermann et al., 2014). Increased -ray activity from the source was reported by Fermi-LAT during April 2009 (Longo et al., 2009). Since December 2009 till mid 2010, it has been particularly active at -ray energies undergoing frequent and rapid flux variations (Ciprini, 2009). Enhancements were also seen by other observatories operating at similar/different energy-bands (Verrecchia et al., 2009; Bulgarelli et al., 2010; Carrasco et al., 2010). During this period the source showed two prominent -ray flares (ph cm-2 s-1): one in April 2010 (Donato, 2010) and another in June 2010 (Iafrate et al., 2010), the brightest so far in LAT band from this source222http ://fermi.gsfc.nasa.gov/FTP/glast/data/lat/catalogs/asp/current/lightcurves/PKSB1222+216_86400.png. A detailed investigation of LAT data during April flare confirmed VHE emission (129 GeV photon; Neronov et al., 2010; Neronov et al., 2011) leading to the inclusion of PKS 1222+216 in the LAT VHE catalog (Neronov et al., 2011). During this high -ray activity period, two VHE excesses were detected by the MAGIC observatory– one immediately after the end of the April flare on MJD 55319.97 (Ackermann et al., 2014) and other one during the rising part of the June 2010 flare (Mose Mariotti, 2010; Aleksić et al., 2011) establishing PKS 1222+216 as a potential VHE FSRQ.
First two years of Fermi-LAT observations of PKS 1222 + 216 have been analyzed by Tanaka et al. (2011) by dividing the LAT light-curve in different activity states based on the observed -ray variability of the source. They have further performed a detailed investigation of the LAT data for the time period considered in this paper (the Active state of Tanaka et al. (2011)), focusing particularly on the spectral evolution, -ray emission and energetics of the source during its different activity states. Based on the spectral fit of LAT spectral energy distribution (SED) and the stability of the break energy during its various activity states, the authors argued that the break can be well explained by recombination in the BLR as suggested by Poutanen & Stern (2010). However, EC scattering of BLR photons (Lyman-) to VHE lies in the KN regime, making VHE emission extremely inefficient with a significant emission only up to few 10s of GeV (Nalewajko et al., 2012; Kushwaha et al., 2014). Detection of VHE photons during both the prominent flares in 2010 and a hard VHE spectra during the June 2010 flare (Aleksić et al., 2011) contradict the BLR origin (Tavecchio et al., 2011; Sahayanathan & Godambe, 2012; Nalewajko et al., 2012), though it can contribute significantly at GeV energies.
In this paper, we present a detailed systematic analysis of variability during the two brightest -ray flares of PKS 1222+216 mentioned above. The continuous broadband observation of Fermi-LAT and the strong fluence allowed us to extract -ray light-curves down to a timescale of 6 hours in four different LAT energy bands: 0.1–3 GeV, 0.1–0.3 GeV, 0.3–1 GeV and 1–3 GeV. Details of Fermi-LAT data and its reduction procedures are discussed in Section 2. In Section 3, we present the main results obtained from the LAT analysis, with its implications on blazar emission and underlying physical processes being discussed in Section 4. Finally we summarize our finding in Section 5. A standard CDM cosmology has been assumed throughout this paper with , and km s-1 Mpc-1.
2 DATA REDUCTION
The pair conversion detector known as Large Area Telescope (LAT) on board Fermi Gamma-ray Space Telescope is sensitive to -ray photons with energies MeV to GeV (Atwood et al., 2009). It operates mostly in survey mode scanning the entire sky every hours, thereby offering a unique capability for studying short time evolution of -ray sources. Here, we have analyzed the LAT data of PKS 1222+216 from April-June 2010 (see Table 1) when it was undergoing intense -ray activity and had emitted two brightest GeV flares of intensity ph cm-2 s-1 with -ray emission extending up to VHEs.
| Start Date (MJD) | End Date (MJD) | State |
|---|---|---|
| April 14, 2010 (55300) | June 27, 2010 (55375) | Active |
| April 27, 2010 (55313) | May 01, 2010 (55318) | Flare 1 |
| June 16, 2010 (55363) | June 22, 2010 (55370) | Flare 2 |
LAT data studied here (see Table 1) were analyzed using Fermi-LAT Science tool version v9r27p1 following the recommended analysis procedure333http://fermi.gsfc.nasa.gov/ssc/data/analysis/scitools/python_tutorial.html. Only events classified as “evclass=2”, energy MeV and zenith angles 100∘ from a region of interest (ROI) of centered around the source were considered during our analysis to avoid calibration uncertainties and the earth’s limb. Good time intervals associated with the selected events were calculated using the recommended selection “(DATA_QUAL==1)&&(LAT_CONFIG==1) &&ABS(ROCK_ANGLE)”. Effects of various cuts on data and sources outside the ROI were taken into account by calculating exposure map on ROI and an additional annulus of around ROI. The selected events were then analyzed using “unbinned maximum likelihood” method (Mattox et al., 1996, PYTHON implementation of gtlike). Sources within the angular field of exposure map were selected and modeled using 2nd LAT catalog (2FGL – gll_psc_v08.fit; Nolan et al., 2012) and the Pass 7 instrument response function (P7SOURCE_V6). Galactic diffuse emission and isotropic background were taken into account by using the respective template (gal_2yearp7v6_v0.fits, iso_p7v6source.txt).
The daily 0.1–300 GeV LAT -ray light-curve during the entire episode was extracted following the above procedures and assuming a log-parabola model [] for the source (Nolan et al., 2012). We have used a logarithmically equi-spaced, twenty energy grids, per energy decade for the spectral fit. Point sources with test statistic (TS) (equivalent of standard deviation ) were removed from the source model files during each analysis. The 6 hr light-curves in four different LAT energy bands: 0.1 – 3 GeV, 0.1 – 0.3 GeV, 0.3 – 1 GeV and 1 – 3 GeV, during Flare 1 and Flare 2 were extracted using the best fit model files from the longer duration analysis as input model. A TS value of was used as a detection criteria for the source. The systematic uncertainties associated with the derived fluxes are 10% at 0.1 GeV and 5% between 0.316 GeV to 10 GeV.
3 ANALYSIS AND RESULTS

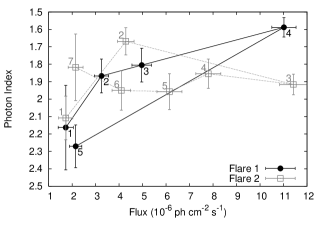
The 0.1–300 GeV LAT -ray light-curve of the source extracted on a day timescale during the time interval analyzed here (see Table 1) is shown in the left panel of Figure 1. The period is characterized by a rapid and frequent flux variations at -ray energies, and five major flares of fluxes ph cm-2 s-1 are observed. Two of these, recorded respectively in April and June 2010 have similar amplitudes ( ph cm-2 s-1). The two flares, marked by dotted lines with labels Flare 1 and Flare 2 respectively in the left panel of Fig. 1 are also the brightest -ray flares from this source in the history of Fermi-LAT operation till date. The right panel of Fig. 1 shows the daily variation of spectral index as a function of the observed flux (index-flux hysteresis) with numbers indicating the day from the onset of the respective flare. A clear clockwise (CW) evolution of index-flux hysteresis can be seen during both the flares. Interestingly, both the flares were preceded by a relatively smaller amplitude ( of Flare 1 peak) and similar duration flares. Despite their similar flux, CW evolution of index-flux hysteresis, and the preceding history, both Flare 1 and Flare 2 reveal a characteristically different temporal patterns during the flaring episodes. The LAT flux during Flare 1 reaches its peak in 4 days and falls rapidly within a day. On the contrary, Flare 2 reaches its peak within 3 days and shows a gradual fall lasting 4 days. Gamma-ray emission extending up to VHE (Flare 1: GeV, Flare 2: GeV) was detected just before the LAT peak during both these flares. The vertical arrow in Fig. 1 (left panel) shows the time when VHE emission was detected in LAT during Flare 1 (129 GeV, Neronov et al., 2010) while the solid line during Flare 2 marks the VHE detection by the MAGIC observatory (Mose Mariotti, 2010; Aleksić et al., 2011). Another VHE detection has been claimed on MJD 55320 in the MAGIC data, and is shown by a vertical solid line in Fig. 1 during the -ray active period of the source (Ackermann et al., 2014).
3.1 Flux Variability
LAT -ray light-curves of PKS 1222+216 during Flare 1 and Flare 2 in four different energy bands: 0.1 – 3 GeV, 0.1 – 0.3 GeV, 0.3 – 1 GeV and 1 – 3 GeV at 6 hr timescale are shown respectively in the left and right panel of Figure 2. Except for the 1–3 GeV emission, both flares have similar peak fluxes in respective energy bands, but present a different case with respect to temporal features, variability and sub-structures.


To access the asymmetry of rise and decay of the flares, we have fitted an exponential rising and falling profile
where and are rise and fall time in days with C, A and being a constant (quiescent flux), normalization (half of peak flux) and the instant of the flare peak respectively. First, the quiescent flux was derived by fitting a constant to a selected range of the 6 hr light-curve in each energy band. Fit was then performed on the 0.1 – 3 GeV light-curves restricting the quiescent flux (C) to vary within its best fit limits. The subsequent fitting in the other three energy bands was then performed by fixing the peak position to this best fit value. The results from the fits and associated errors are given in Table 2. The fitted profiles, plotted only for data considered during the fitting, are shown in the left and right panel of Figure 2.
| Energy Band | No. of | C | A | Rise time () | Fall time () | (dof) | |
| (GeV) | time bins | (10-6 ph cm-2 s-1) | (MJD) | (days) | (days) | ||
| Flare 1 | |||||||
| 0.1–3.0 | 20 | 30.9 (15) | |||||
| 0.1–0.3 | 16 | – | 9.5 (12) | ||||
| 0.3–1.0 | 18 | – | 19.7 (14) | ||||
| 1.0–3.0 | 11 | – | 11.3 (7) | ||||
| Flare 2 | |||||||
| 0.1–3.0 | 28 | 49.2 (23) | |||||
| 0.1–0.3 | 28 | – | 34.4 (24) | ||||
| 0.3–1.0 | 26 | – | 15.2 (22) | ||||
| 1.0–3.0 | 27 | – | 21.5 (23) | ||||
3.2 Hardness Ratios
The left and right panel of Fig. 3 show the daily 0.1-300 GeV -ray light-curve along with the corresponding hardness ratios (HRs) during Flare 1 and Flare 2. We have derived two hardness ratios, HR1 and HR2, defined as the ratio of flux in 0.3–1 GeV to the corresponding flux in the 0.1–0.3 GeV band, and the ratio of 1–3 GeV flux to the corresponding 0.3–1 GeV flux, respectively. Though the peak fluxes are similar, the hardness ratios show very different evolution during the rise, at the peak and during the decay phase of the flares. Both HR1 and HR2, during Flare 1, show a consistent hardening until the peak followed by a softening to quiescent level during the flare decay. HR1 and HR2 during Flare 2, on the other hand, suggest a hardening during the rising phase but a reverse trend at the peak and a different evolution behavior during the decay phase. HR1 at peak is consistent with hardening seen during the rising phase and softens during the decay but not to the quiescent level. HR2, on the contrary, softens to quiescent level at the peak and remains at the same level throughout the decay phase of Flare 2.


3.3 Time Delay/Lag
It is interesting to note that VHE photons (Neronov et al., 2010; Mose Mariotti, 2010; Aleksić et al., 2011) precede the LAT peak during both the flaring episodes suggesting a soft lag444A clear peak in VHE was detected during Flare 2 by the MAGIC observatory on but not during Flare 1. In general, the origin of flares in BLR (torus) is expected to have absence (presence) of time lag between the MeV and GeV emission (Dotson et al., 2012). Motivated by this, we performed a lag analysis to look for a possible hint, if any, between the extracted LAT light-curves in different energy bands. The analysis is, however, limited by closely separated energy bands and best available time resolution of 6 hr. The lag analysis was performed using z-transformed Discrete Correlation Function (ZDCF) method of Alexander (2013) (also see Alexander (1997)). It works on data pairs sorted according to their time lag and binned into equal population bins of at least 11 pairs after discarding multiple occurrences of the same data pair in a bin. Correlation coefficients of the bins are calculated and then z-transformed to estimate the error in z-space which are then transformed back in the correlation space. DCF errors are estimated using Monte Carlo simulations by adding a random error at each step to each data from the errors in the light-curves fluxes (see Alexander, 2013, for more details).
The time lag analysis was carried out on a continuous set of uniformly sampled data points during both the flares, though the method used is also applicable in the case of non-uniformly sampled light-curves555lag study using non-uniformly sampled 6 hr data is also consistent with quoted results. The results of the lag analysis derived from 1000 simulations of each pair, and the associated uncertainties are given in Table 3. The corresponding DCFs for Flare 1 and Flare 2 are presented in the left and right panel of Fig. 4 respectively where the time ordering is “T(2nd light-curve:LC2) – T(1st light-curve:LC1)”. Our analysis suggests a soft lag between the lowest and the highest energy light-curves during Flare 2 while Flare 1 is consistent with no lag. Considering the low significance of the inferred soft lag during Flare 2, it has to be understood as an upper-limit only. Further, there may be a lag among all the three light-curves but the limited time resolution provided by the LAT light-curves and the closeness of energy bands makes it hard to ascertain.


| LC1 Energy Band | LC2 Energy Band | Flare 1 lag | Flare 2 lag |
|---|---|---|---|
| (GeV) | (GeV) | (days) | ( days) |
| 0.1–0.3 | 0.3–1.0 | 0.0 | 0.0 |
| 0.3–1.0 | 1.0–3.0 | 0.0 | 0.0 |
| 1.0–3.0 | 0.1–0.3 | 0.0 | 0.25 |
| ∗ T(LC2) – T(LC1) as given in columns 1 and 2 | |||
4 DISCUSSION
In this work, we have performed a detailed study of the two brightest -ray flares of PKS 1222+216 observed in Fermi-LAT in April and June 2010. The daily 0.1–300 GeV light-curve during these two flares has been systematically studied by dividing it into multiple energy bands (0.1–3, 0.1–0.3, 0.3–1 and 1–3 GeV) and using the shortest possible time binning (6 hr) allowed by the photon statistics. Contrary to a smooth rise followed by a rapid (Flare 1) or gradual (Flare 2) fall observed in the daily 0.1 – 300 GeV LAT -ray light-curves (top panel, Fig. 3), the 6 hr light-curves present a different case (Fig. 2). These 6 hr light-curves reveal a complex temporal behavior and variability patterns in different energy bands during the flaring episodes. Flare 1 begins with a day long plateau in the 0.1–0.3 GeV light-curve and enhanced variations at high energies with an apparent daily recurring pattern in 1–3 GeV light-curve. After this phase, a sharp increase in the flux is observed in all the LAT bands, followed by a rapid descent. To our knowledge, a plateau phase before flare has been a characteristic property of blazar 3C 454.3 (Abdo et al., 2011) but has not been seen in any other blazar during a flare. The absence of the plateau phase in the total energy integrated ( GeV) daily light curve during Flare 1, suggests the rise may be governed primarily by GeV photons (top panel, Fig. 3). In addition, presence of a plateau phase at lower energies is also reflected as the slow rise of daily binned 0.1-300 GeV -ray light curve during Flare 1 (Figs. 1 & 3–top panel, §3). An exponential fit during the rising phase of the time and energy resolved light curves indicate a similar rise in all the bands except 0.3–1 GeV (Table 2, Fig. 2). If we consider a situation where a short lived acceleration mechanism (or a shock) is initiated in a turbulent jet, then the plateau phase may correspond to a case where the jet is becoming turbulent followed by the sudden rise probably due to a short lived acceleration. When the jet becomes turbulent, the electrons are accelerated via second order Fermi mechanism on a characteristic timescale, , with acceleration rate (Rieger et al., 2007; Protheroe & Clay, 2004; Bhattacharyya et al., 2005). Here, is the electron gyro-radius and is the Alfven speed. On the other hand, shock acceleration is a first order Fermi mechanism with acceleration timescale , where is the speed of shock (Kirk & Dendy, 2001; Protheroe & Clay, 2004; Rieger et al., 2007). Hence, the turbulent acceleration rate lags the shock acceleration by a factor and the latter dominates the emission mechanism, once initiated.
In the case of Flare 2, the time and energy resolved light curves show a monotonic exponential rise from the beginning followed by a gradual descent with signatures of multiple peaks of decreasing strength from lower to higher energies (Fig. 2). The rate of rise of flux in all the energy bands are similar and also consistent with that of Flare 1 (Table 2). The peak fluxes, during both the flares, are also similar in the respective energy bands except in the 1–3 GeV band during Flare 1, where the peak reaches approximately twice the corresponding peak flux during the Flare 2. This is, however, consistent with the observed “harder when brighter” trend seen during Flare 1 (right panel, Fig. 1). Though the rate of rise are similar, the monotonic rise, lacking a plateau phase, probably causes the faster rise of the total energy integrated ( GeV) daily-light curve compared to Flare 1. On the other hand, the slow decline of the daily, energy integrated 0.1–300 GeV light-curve is mainly due to the dominant contribution of 0.1–0.3 GeV emission with multiple peaks structures. This may be due to the contribution from multiple emission regions and their relative locations (Nalewajko, 2013; Giannios, 2013) in addition to the standard flaring region contributing across the spectrum.
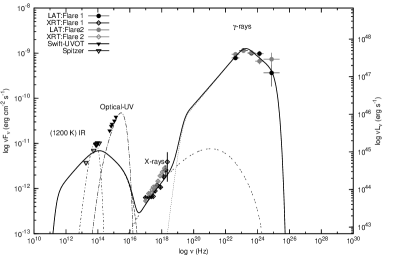
In contrast to the rising phase, the descent of the flux is faster in case of Flare 1 but rather gradual in case of Flare 2 (see Section §3). To further investigate the flare decay we obtained the physical parameters of the source by modeling the broadband SED using one zone leptonic model (Kushwaha et al., 2013; Sahayanathan & Godambe, 2012). We used simultaneous/contemporaneous time averaged X-ray and LAT spectrum over the LAT flaring duration. The X-ray emission is reproduced considering SSC process whereas the -ray spectrum is reproduced considering external Compton scattering of the IR photons from a 1200 K dusty torus. The observed fluxes in X-rays and -rays during both the flares are similar and hence we assume that same set of physical parameters describe the source SED during the flares. The size of the emission region is constrained via the fastest observed rise time ( day) while the particle indices are deduced from the X-ray and -ray spectra (Kushwaha et al., 2013). The final model spectrum along with the observed fluxes are shown in Fig. 5 and the corresponding parameters are given in Table 4. Based on these parameters, one can estimate the cooling timescale of the electrons emitting -rays in the observer’s frame as (Kushwaha et al., 2013, 2014; Saito et al., 2013)
| (1) |
where () is the IR covering fraction with as the disk luminosity (Kushwaha et al., 2013), me is the rest mass of an electron, c is the speed of light and is the Thomson scattering cross-section. The IR photon energy density in the emission frame, is related to the corresponding AGN frame energy density () as . The estimated cooling time scale (equation 4) is much smaller than the decay time of the flares obtained through the exponential fit of the light curves (Table 2) and hence we can conclude that decay of both the flares cannot be attributed to radiative cooling processes alone. If the decline is due to light travel time effects then one expects a similar decay times in all the energy bands, contrary to the one obtained (see Table 2). Alternatively, the flare decay can also be associated with the weakening of the acceleration process. In this case, one expects a steepening of spectral indices (Kirk et al., 1998). Both HR1 and HR2 during Flare 1 show hardening during the rise followed by a softening to quiescent level (left panel, Fig. 3) during the decay. Relating this feature to the efficiency of particle acceleration process, we interpret the hardening of spectrum during rise as growth of shock acceleration process followed by its weakening, thereby softening the spectra during the flare decay. Contrary to the trend seen in Flare 1, the hardness ratios of Flare 2 exhibit complex behavior. Here HR1 seems to harden till peak followed by a milder softening during decay whereas HR2 softens to its quiescent level at the peak and remains consistent with it throughout the decay (right panel, Fig. 3). Hence, unlike Flare 1, Flare 2 cannot be interpreted as a result of single acceleration process but probably include other dynamical effects. The decay of Flare 2 on daily timescales has been explained satisfactorily by considering the effects of jet dynamics. A decelerating jet interpretation can successfully reproduce the overall observed light-curves and SED (Kushwaha et al., 2014), though it seems that this model alone is not sufficient to explain the observed complex temporal behavior presented here. Nevertheless, this interpretation is supported by non-detection of significant lags within various energy bands during the flare. The hr lag observed in high energy during Flare 2 can be a manifestation of different cooling processes (Dotson et al., 2012) and/or blob dynamics. Similar lags have also been found during the bright flares of FSRQ PKS 1510-089 (Brown, 2013). However, the inferred lag is hard one contrary to soft lag found in our study. The absence of lag during Flare 1 might be due to shorter duration of significant variation and averaging of data in the analysis of the same (see §3.2).
| Parameters | Numerical values (CGS units) |
| Particle index before break (p) | 2.15 |
| Particle index after break (q) | 3.6 |
| Magnetic field (B) | 0.35 G |
| Equipartition factor () | 40 |
| Doppler factor () | 23 |
| Angle to the line of sight () | 2.5∘ |
| Particle break energy∗ () | |
| Emission region size (R′) | |
| IR Torus temperature (T∗) | 1200 K |
| Jet power () | |
| Minimum particle energy∗ () | 25 |
| Maximum particle energy∗ () | |
| ∗in electron rest-mass units |
Based on lag and correlated-variability, both homogeneous and inhomogeneous model have been suggested for blazars’ emission and have been successful in reproducing the observed SED and light-curves of the sources (Tavecchio et al., 2011; Brown, 2013; Kushwaha et al., 2013, 2014). Simple one-zone models have been found to satisfactorily reproduce the broadband SED during both the flares (Tavecchio et al., 2011; Ackermann et al., 2014; Kushwaha et al., 2014). However, the rise and fall within a day, during Flare 1, suggests that it probably arises from a day long emission region as suggested by a similar rise time in all the LAT energy bands666This is different from the minutes variability considered by Ackermann et al. (2014) based on the VHE variability observed during Flare 2. An indication of this daily variation is also apparent in the 1–3 GeV emission before rise. Moreover, contrary to this variation in 1–3 GeV emission, the 0.3–1 GeV emission suggests faster variation and has slowest rise and fall compared to the other two energy bands (Table 2). For Flare 2, various models including leptonic scenarios e.g. jet-in-jet/minijet (Tavecchio et al., 2011; Giannios, 2013), recollimation (Aleksić et al., 2011; Tavecchio et al., 2011; Nalewajko et al., 2012; Kushwaha et al., 2014) and multiple emission zones (Tavecchio et al., 2011) along with hadronic scenario of ultra-relativistic neutral beams (Dermer et al., 2012) have been proposed. However, the temporal features seen in the systematic time and energy resolved study performed here demand scenarios beyond simple one zone homogeneous models where minor fluctuations are embedded within the region contributing to the major flare (H.E.S.S. Collaboration et al., 2012; Giannios, 2013).
The two flares considered here have been studied earlier by Tanaka et al. (2011) and Nalewajko (2013). Both the previous studies focus on the spectral and temporal features in the 0.1–300 GeV energy band employing different time binning method. In this work, however, we have a performed a more detailed and systematic time and energy resolved study. We have shown that all the features/patterns observed during Flare 2 by Nalewajko (2013) are mainly due to features present at lower energies. Tanaka et al. (2011), on the other hand have termed these two flares as the highest possible -ray fluxes from PKS 1222+216, supposedly fueled by feeding the entire accretion power to the jet. However, the observed peak luminosity () which reaches erg s-1 during the peak corresponds to an emitted power of erg s-1 (Sikora et al., 1997) in the rest frame of the emission region, assuming a bulk Lorentz factor () of 20 (Homan, 2012; Ackermann et al., 2014). This is of the accretion disk luminosity erg s-1 (Malmrose et al., 2011) and is in contrast to derived by Tanaka et al. (2011), who assumed a comparatively lower value for the accretion disk luminosity erg s-1 (assuming a BLR covering fraction ) and jet bulk Lorentz factor . A black hole of mass (Farina et al., 2012), however, can produce an Eddington luminosity of erg s-1 which in turn suggests a very high accretion power and disk radiative efficiency. Apart from the asymmetry observed in the light-curves of the flares, Tanaka et al. (2011) found a hint of “harder-when-brighter” during Flare 1 and a clockwise evolution in spectral index vs flux during Flare 2. Our analysis also reproduces these results but we found a clockwise trend during Flare 1 as well, which is present in the study of Tanaka et al. (2011) but was probably suppressed due to the inclusion of a flare preceding the Flare 1.
5 CONCLUSIONS
We have performed an in-depth time and energy resolved study of the two brightest -ray flares from FSRQ PKS 1222+216 observed by the Fermi-LAT during April (Flare 1) and June (Flare 2) 2010. Our study reveals a large variety of temporal features and variability patterns in different energy bands (0.1–3, 0.1–0.3, 0.3-1.0 and 1–3 GeV) binned on 6 hr timescales apart from a clearly asymmetric profile in both the flares. This includes a day plateau in 0.1–0.3 GeV band, hint of variation on daily timescale in 1–3 GeV emission, faster fluctuation ( days) at 0.3–1 GeV energy and a rapid decline during Flare 1. Flare 2, on the contrary, shows a monotonic rise followed by a gradual decline at all energies with prominent substructures in 0.1–0.3 GeV emission. Though the rise time are similar in all energy bands during both the flares, the slower rise of daily integrated 0.1–300 GeV light-curve during Flare 1 is probably due to the presence of plateau in the 0.1–0.3 GeV emission with GeV photons driving the initial rise. Further, the slower decline of 0.1–300 GeV light-curve during Flare 2 is mainly due to contribution from the multiple peaked sub-structures in the 0.1–0.3 GeV light-curve resulting in a coherent single flare at daily timescales.
SED during both the flares can be well reproduced by a simple one zone model considering synchrotron, SSC and EC of IR emission mechanisms with similar parameters. The radiative cooling timescale of min suggest that the observed duration and profiles of flares are not solely due to radiative cooling. The decline of flares also cannot be explained by considering light travel time effect which results in a similar decline rate at all energies, contrary to observations.
Study of hardness ratios during both the flares suggest that Flare 1 can result from a variation in the efficiency of underlying acceleration process whereas for Flare 2, one need to consider the effect of jet dynamics and small scale inhomogeneities. The former contribute to overall flaring while the latter is responsible for the intrinsic feature observed in the time and energy resolved light-curves presented here. Based on these features we suggest that both flares are probably result of two different underlying mechanisms that are equally efficient in producing luminous -ray flares.
The Fermi-LAT Collaboration acknowledges generous ongoing support from a number of agencies and institutes that have supported both the development and the operation of the LAT as well as scientific data analysis. These include the National Aeronautics and Space Administration and the Department of Energy in the United States, the Commissariat l’Energie Atomique and the Centre National de la Recherche Scientifique/Institut National de Physique Nuclaire et de Physique des Particules in France, the Agenzia Spaziale Italiana and the Istituto Nazionale di Fisica Nucleare in Italy, the Ministry of Education, Culture, Sports, Science and Technology (MEXT), High Energy Accelerator Research Organization (KEK) and Japan Aeros pace Exploration Agency (JAXA) in Japan, and the K. A. Wallenberg Foundation, the Swedish Research Council and the Swedish National Space Board in Sweden.
Additional support for science analysis during the operations phase from the following agencies is a lso gratefully acknowledged: the Istituto Nazionale di Astrofisica in Italy and and the Centre National d’Etudes Spatiales in France.
References
- Abdo et al. (2011) Abdo, A. A., Ackermann, M., Ajello, M., et al. 2011, ApJ, 733, L26
- Ackermann et al. (2014) Ackermann, M., Ajello, M., Allafort, A., et al. 2014, ApJ, 786, 157
- Agudo et al. (2013) Agudo, I., Marscher, A., Jorstad, S. G., & Gómez, J. L. 2013, Highlights of Spanish Astrophysics VII, 152
- Aleksić et al. (2011) Aleksić, J., Antonelli, L. A., Antoranz, P., et al. 2011, ApJ, 730, L8
- Alexander (2013) Alexander, T. 2013, arXiv:1302.1508
- Alexander (1997) Alexander, T. 1997, Astronomical Time Series, 218, 163
- Atwood et al. (2009) Atwood, W. B., Abdo, A. A., Ackermann, M., et al. 2009, ApJ, 697, 1071
- Begelman et al. (2008) Begelman, M. C., Fabian, A. C., & Rees, M. J. 2008, MNRAS, 384, L19
- Bhattacharyya et al. (2005) Bhattacharyya, S., Sahayanathan, S., & Bhatt, N. 2005, New A, 11, 17
- Brown (2013) Brown, A. M. 2013, MNRAS, 431, 824
- Bulgarelli et al. (2010) Bulgarelli, A., Gianotti, F., Trifoglio, M., et al. 2010, The Astronomer’s Telegram, 2641, 1
- Carrasco et al. (2010) Carrasco, L., Carramiñana, A., Recillas, E., Porras, A., & Mayya, D. Y. 2010, The Astronomer’s Telegram, 2626, 1
- Chiaberge & Ghisellini (1999) Chiaberge, M., & Ghisellini, G. 1999, MNRAS, 306, 551
- Ciprini (2009) Ciprini, S. 2009, The Astronomer’s Telegram, 2349, 1
- Cooper et al. (2007) Cooper, N. J., Lister, M. L., & Kochanczyk, M. D. 2007, ApJS, 171, 376
- Dermer et al. (2012) Dermer, C. D., Murase, K., & Takami, H. 2012, ApJ, 755, 147
- Donato (2010) Donato, D. 2010, The Astronomer’s Telegram, 2584, 1
- Dotson et al. (2012) Dotson, A., Georganopoulos, M., Kazanas, D., & Perlman, E. S. 2012, ApJ, 758, L15
- Farina et al. (2012) Farina, E. P., Decarli, R., Falomo, R., Treves, A., & Raiteri, C. M. 2012, MNRAS, 424, 393
- Finke & Dermer (2010) Finke, J. D., & Dermer, C. D. 2010, ApJ, 714, L303
- Fuhrmann et al. (2014) Fuhrmann, L., Larsson, S., Chiang, J., et al. 2014, MNRAS, 441, 1899
- Georganopoulos et al. (2001) Georganopoulos, M., Kirk, J. G., & Mastichiadis, A. 2001, ApJ, 561, 111
- Giannios (2013) Giannios, D. 2013, MNRAS, 431, 355
- H.E.S.S. Collaboration et al. (2012) H.E.S.S. Collaboration, Abramowski, A., Acero, F., et al. 2012, A&A, 539, A149
- Homan (2012) Homan D. C., 2012, IJMPS, 8, 163
- Iafrate et al. (2010) Iafrate, G., Longo, F., & D’Ammando, F. 2010, The Astronomer’s Telegram, 2687, 1
- Kirk et al. (1998) Kirk, J. G., Rieger, F. M., & Mastichiadis, A. 1998, A&A, 333, 452
- Kirk & Dendy (2001) Kirk, J. G., & Dendy, R. O. 2001, Journal of Physics G Nuclear Physics, 27, 1589
- Kushwaha et al. (2013) Kushwaha, P., Sahayanathan, S., & Singh, K. P. 2013, MNRAS, 433, 2380
- Kushwaha et al. (2014) Kushwaha, P., Sahayanathan, S., Lekshmi, R., et al. 2014, MNRAS, 442, 131
- Kusunose et al. (2000) Kusunose, M., Takahara, F., & Li, H. 2000, ApJ, 536, 299
- Longo et al. (2009) Longo, F., Giroletti, M., & Iafrate, G. 2009, The Astronomer’s Telegram, 2021, 1
- MAGIC Collaboration et al. (2008) MAGIC Collaboration, Albert, J., Aliu, E., et al. 2008, Science, 320, 1752
- Malmrose et al. (2011) Malmrose, M. P., Marscher, A. P., Jorstad, S. G., Nikutta, R., & Elitzur, M. 2011, ApJ, 732, 116
- Marscher (2014) Marscher, A. P. 2014, ApJ, 780, 87
- Mose Mariotti (2010) Mose Mariotti, M. 2010, The Astronomer’s Telegram, 2684, 1
- Mattox et al. (1996) Mattox, J. R., Bertsch, D. L., Chiang, J., et al. 1996, ApJ, 461, 396
- Nalewajko (2013) Nalewajko, K. 2013, MNRAS, 430, 1324
- Nalewajko et al. (2012) Nalewajko, K., Begelman, M. C., Cerutti, B., Uzdensky, D. A., & Sikora, M. 2012, MNRAS, 425, 2519
- Neronov et al. (2010) Neronov, A., Semikoz, D., & Vovk, I. 2010, The Astronomer’s Telegram, 2617, 1
- Neronov et al. (2011) Neronov, A., Semikoz, D., & Vovk, I. 2011, A&A, 529, A59
- Nolan et al. (2012) Nolan, P. L., Abdo, A. A., Ackermann, M., et al. 2012, ApJS, 199, 31
- Poutanen & Stern (2010) Poutanen, J., & Stern, B. 2010, ApJ, 717, L118
- Protheroe & Clay (2004) Protheroe, R. J., & Clay, R. W. 2004, PASA, 21, 1
- Pushkarev et al. (2009) Pushkarev, A. B., Kovalev, Y. Y., Lister, M. L., & Savolainen, T. 2009, A&A, 507, L33
- Rieger et al. (2007) Rieger, F. M., Bosch-Ramon, V., & Duffy, P. 2007, Ap&SS, 309, 119
- Sahayanathan & Godambe (2012) Sahayanathan, S., & Godambe, S. 2012, MNRAS, 419, 1660
- Saikia et al. (1993) Saikia, D. J., Wiita, P. J., & Muxlow, T. W. B. 1993, AJ, 105, 1658
- Saito et al. (2013) Saito, S., Stawarz, Ł., Tanaka, Y. T., et al. 2013, ApJ, 766, L11
- Sikora et al. (2013) Sikora, M., Janiak, M., Nalewajko, K., Madejski, G. M., & Moderski, R. 2013, ApJ, 779, 68
- Sikora et al. (1997) Sikora, M., Madejski, G., Moderski, R., & Poutanen, J. 1997, ApJ, 484, 108
- Striani et al. (2010) Striani, E., Verrecchia, F., Donnarumma, I., et al. 2010, The Astronomer’s Telegram, 2686, 1
- Tanaka et al. (2011) Tanaka, Y. T., Stawarz, Ł., Thompson, D. J., et al. 2011, ApJ, 733, 19
- Tavecchio et al. (2011) Tavecchio, F., Becerra-Gonzalez, J., Ghisellini, G., et al. 2011, A&A, 534, A86
- Urry & Padovani (1995) Urry, C. M., & Padovani, P. 1995, PASP, 107, 803
- Vasileiou (2013) Vasileiou, V. 2013, Astroparticle Physics, 48, 61
- Verrecchia et al. (2009) Verrecchia, F., Striani, E., Tavani, M., et al. 2009, The Astronomer’s Telegram, 2348, 1
- Wagner & H.E.S.S. Collaboration (2010) Wagner, S. J., & H.E.S.S. Collaboration 2010, AAS/High Energy Astrophysics Division #11, 11, #27.06