Present address:] Department of Physics, Meiji University, Kawasaki 214-8571, Japan
Unconventional magnetism in the layered oxide LaSrRhO4
Abstract
We have prepared polycrystalline samples of LaSrRh1-xGaxO4 and LaSr1-xCaxRhO4, and have measured the x-ray diffraction, resistivity, Seebeck coefficient, magnetization and electron spin resonance in order to evaluate their electronic states. The energy gap evaluated from the resistivity and the Seebeck coefficient systematically changes with the Ga concentration, and suggests that the system changes from a small polaron insulator to a band insulator. We find that all the samples show Curie-Weiss-like susceptibility with a small Weiss temperature of the order of 1 K, which is seriously incompatible with the collective wisdom that a trivalent rhodium ion is nonmagnetic. We have determined the factor to be =2.3 from the electron spin resonance, and the spin number to be =1 from the magnetization-field curves by fitting with a modified Brillouin function. The fraction of the =1 spins is 2–5%, which depends on the degree of disorder in the La/Sr/Ca-site, which implies that disorder near the apical oxygen is related to the magnetism of this system. A possible origin for the magnetic Rh3+ ions is discussed.
pacs:
75.20.Hr, 75.30.Wx, 72.20.-iI Introduction
The 3d transition-metal oxides have been extensively studied as a gold mine for functional materials, which is exemplified by the ferroelectricity in titanium oxides, the magnetoresistivity and multiferroelectricity in manganese oxides, the thermoelectricity in cobalt oxides, and the high-temperature superconductivity in copper oxides. In contrast, the 4d transition metal oxides have been less investigated as functional materials. While magnetism is a fertile source for the functions in the transition-metal oxides, the transition-metal oxides are often paramagnetic except for some insulating ruthenium oxides.subramanian1983 ; battle1984 ; nakatsuji1997 This comes from different spin states between and elements.
The spin state is a fundamental concept in transition-metal compounds/complexes sugano1970 . In a transition-metal ion surrounded with octahedrally-coordinated oxygen anions, the five-fold degenerate orbitals in vacuum are split into the triply degenerate (, and ) orbitals and the doubly degenerate ( and ) orbitals, and the energy gap between the and levels called the ligand-field gap often competes with the Hund coupling. When the ligand field gap is larger, the electrons first occupy the states to minimize the total spin number. On the other hand, when the Hund coupling is strong, the total spin number is maximized. The former state is called the low spin state, and the latter the high spin state.
Rhodium is located below cobalt in the periodic table, and thus is expected to have similar chemical properties. In fact, many cobalt oxides have their isomorphic rhodium oxides, and similar transport properties are reported. okada2005 ; okada2005jpsj ; klein2006 ; okamoto2006 ; shibasaki2006 ; maignan2009 We have studied the Rh substitution effects on LaCoO3, and found that LaCo0.8Rh0.2O3 exhibits a ferromagnetic transition below 18 K.asai2011 The substituted Rh ions tend to stabilize high-spin state Co3+ ions in the samples,knizek2012 ; asai2012 and such high-spin state Co3+ ions interact with each other at low temperatures to cause the ferromagnetic order. This clearly indicates that the Rh3+ ion is not a simple nonmagnetic element.
In this paper, we focus on the layered rhodium oxide LaSrRhO4. This oxide crystallizes in the K2NiF4-type (O4-type) structure, where 50% La and 50% Sr make a solid solution in the site. The corner-shared RhO6 octahedra form the RhO2 plane along the plane, and alternately stack with the (La/Sr)2O2 layer. Shimura et al. shimura1994 measured the physical properties of Sr2-xLaxRhO4 , and found that a small amount of paramagnetic contribution, although the formal valence of Rh was . This is highly unusual, because Rh3+ is believed to be highly stable in the low-spin state (). Here we present measurements and analyses of the transport and magnetic properties of LaSrRh1-xGaxO4 and LaSr1-xCaxRhO4, and show that 2–5% of the Rh3+ ions act as . We discuss a possible mechanism to create the magnetic Rh3+ ions based on the experimental results.
II experimental
Polycrystalline samples of LaSrRh1-xGaxO4 (0, 0.1, 0.2, 0.3, 0.4, 0.5, 0.6, 0.7, 0.8 and 0.9) and LaSr1-xCaxRhO4 (0.1, 0.2 and 0.3) were prepared by a conventional solid state reaction method. High-purity (99.9%) oxide powders of Rh2O3, Ga2O3, La2O3, SrCO3 and CaCO3 were used as raw materials. Stoichiometric mixtures of these powders were ground, and were calcined for 24 h at 1200∘C in air. The calcined powder was then ground, pressed into pellet, and sintered 48 h at 1300∘C in air.
X-ray diffraction was measured with a Rigaku Geigerflex (Cu K radiation). Synchrotron x-ray diffraction was taken for a powder sample of with a wave length of 0.6887 Å at BL-8A, KEK-PF, Japan. Rietveld refinement was conducted using Rietan 2000 code.izumi2007 Resistivity was measured in a four probe configuration in a constant voltage applied across a series circuit of a sample and a standard resistance. The Seebeck coefficient was measured in a two-probe configuration in a steady state technique with a typical temperature gradient of 1 K/cm. A contribution of the voltage leads was carefully subtracted. Magnetization was measured using a superconducting quantum interference device magnetometer (Quantum Design MPMS) from 5 to 300 K. External magnetic field was chosen to be from 1 to 5 T, depending on the magnetization of the samples. The field dependence of the magnetization was measured for LaSrRhO4 at 2, 5 and 10 K in sweeping from 0 to 7 T. Electron spin resonance (ESR) was measured in static magnetic fields from 0 to 14 T in the frequency range from 90 to 200 GHz, and non-resonant transmission signal was detected using a vector network analyzer in sweeping magnetic fields. For frequencies of 27.5 and 34 GHz, a cavity perturbation technique was employed.
III results and discussion
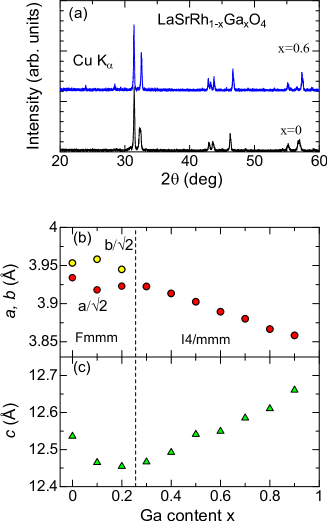
Figure 1(a) shows typical x-ray diffraction patterns for the prepared samples. We find that LaSrRhO4 () and LaSrGaO4 () make a solid solution in the whole range of . All the peaks for are indexed as the orthorhombic structure with the space group Fmmm, as is consistent with preceding papers.blasse1965 ; shimura1994 With increasing Ga content , the symmetry changes from orthorhombic to tetragonal around , as is evidenced by the small peaks around =23 and 28 deg for . This tetragonal structure is consistent with the other end phase of LaSrGaO4 with the space group of I4/mmm.britten1995 Possibly owing to the symmetry change, the axis length shown in Fig. 1(c) takes a minimum around , while the and axis lengths shown in Fig. 1(b) rather smoothly decrease with . Since a Ga3+ ion has a smaller ionic radius than a Rh3+ ion, the lattice volume smoothly decreases with (not shown).
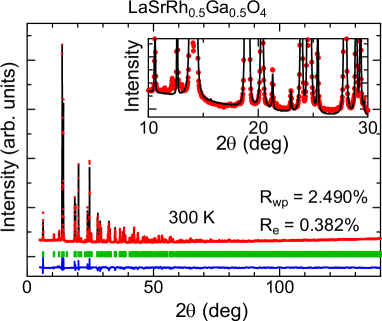
The title compound belongs to the Ruddlesden-Popper series of (La,Sr)n+1(Rh,Ga)nO3n+1, and phases often grow as a secondary phase. In the present case, (La,Sr)(Rh,Ga)O3 ()can grow in the same preparation conditions, and a small amount of such impurity may change the valence of the rhodium ion from . In order to check this possibility, we have measured synchrotron x-ray diffraction for the sample. Figure 2 shows the synchrotron x-ray diffraction pattern at room temperature. There are some unindexed reflections around 12 deg, but their intensity is less than 0.6% of the main peak. We performed the Rietveld refinement, and find that the resultant fitting is reasonably well. Thus we safely conclude that the prepared powder samples are stoichiometric and in single phase within an uncertainty of less than 0.6%.
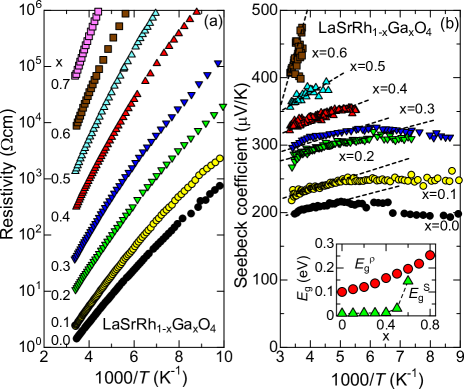
Next we evaluate the valence of the rhodium ion from the transport properties. Figure 3(a) shows the resistivity of LaSrRh1-xGaxO4 plotted as a function of inverse temperature. The room-temperature resistivity is 1 cm for , which is higher than the previously reported data by Shimura et al.shimura1994 Figure 3(b) shows the Seebeck coefficient of LaSrRh1-xGaxO4 plotted as a function of inverse temperature. Again, the room-temperature thermopower for is larger than the data by Shimura et al.shimura1994 These results indicate that the carrier concentration of our sample is lower than that of their samples. The positive sign of the Seebeck coefficient indicates that the valence of the rhodium ion is larger than 3. Considering the fraction of the impurity phase is less than 0.6%, the valence of the rhodium ions ranges from 3.00 to 3.02. Note that the Heikes formula chaikin1976 is not valid in the present case because of significant temperature variation. The isostructual LaSrCoO4 shows nearly the same value of 200 V/K at 300 K with strong temperature variation. chichev2006
Let us have a closer look at the compositional dependence of the transport data. The resistivity increases with increasing Ga content, and the slope in the Arrhenius plot increases concomitantly. The energy gap () determined by the slope is plotted in the inset of Fig. 3(b); the magnitude is 0.1–0.3 eV, which is typical for insulating transition-metal oxides. Since the sample has a band gap larger than 3 eV, the increase in indicates a systematic evolution of the electronic states. The Seebeck coefficient increases with decreasing temperature around room temperature, suggesting an activation-type transport. By evaluating the slope of the Seebeck coefficient against shown by the dotted lines, we determine the energy gap () as is also plotted in the inset of Fig. 3(b). for indicates that the activation energy predominantly comes from the mobility, and the system is well described in terms of small polaron.palstra1997 On the contrary, for indicates that the activation energy comes from the energy gap in the density of states. This indicates that the system continuously evolves from a small polaron insulator to a band insulator. We further note that the unwanted holes are negligible for at low temperatures because of the gap in the density of states.
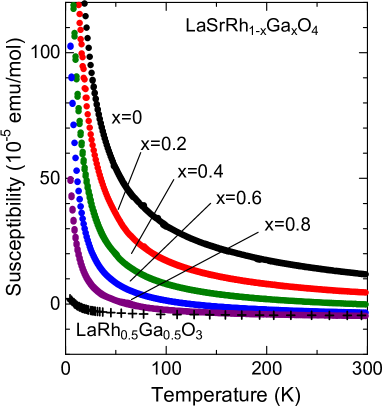
Now we focus on the magnetism of our samples. Figure 4 shows the susceptibility of LaSrRh1-xGaxO4. A first thing to note is that all the samples are paramagnetic. Considering that Sr2+, La3+ and Ga3+ ions are diamagnetic, we have come to the conclusion that Rh3+ is magnetic, which is seriously incompatible with our collective wisdom. A second feature is that all the data are roughly inversely proportional to temperature, suggesting that the magnetic moment on the Rh3+ ion is independent from each other. A third feature is that the temperature-independent susceptibility is significant, and changes its sign with . We also emphasize that the susceptibility of the cubic Rh3+ oxide LaRh0.5Ga0.5O3 shows a much smaller paramagnetic signal. This indicates that the paramagnetic response of LaSrRh1-xGaxO4 is inherent in the layered structure of O4, and does not come from impurities in the raw powdered oxides of Rh2O3, La2O3, and Ga2O3.
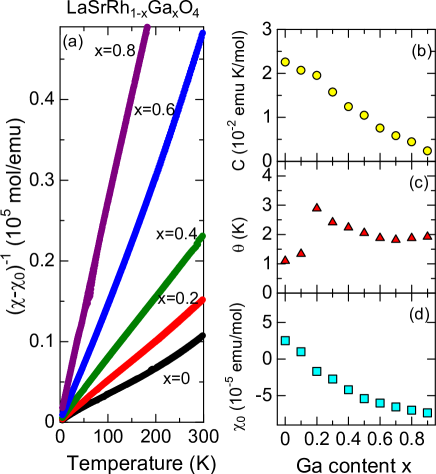
Considering the above features, we fit the experimental data with a modified Curie-Weiss law given by
| (1) |
where , and are the Curie constant, the Weiss temperature, and the temperature-independent susceptibility, respectively. As shown in Fig. 5(a), the inverse susceptibility is found to be linear in down to the lowest temperature measured. Figures 5(b)-5(d) show the fitting parameters. As expected, the Weiss temperature is determined to be a small value of the order of 1 K. Thus, except for low temperatures, the spin-spin interaction can be neglected. The Curie constant is 0.02 emu K/mol for , which is 3% of that observed in LaSrCoO4.chichev2006 ; moritomo1997 ; shimada2006 ; ang2008 This implies that only 3% of the Rh ions are magnetic. It should be emphasized that all the Curie constants decrease almost linearly with [Fig. 5(b)], which implies that the Ga substitution simply causes a dilution effect, and the magnetic Rh ions are always 3% of the Rh ions for all the samples. We should emphasize that the fraction of 3% is much larger than the purity of the raw-material powders and the volume fraction of impurity phases evaluated above. In addition, we can neglect thermally activated Rh4+ ions for at low temperature because of the finite energy gap in the density of states (the inset of Fig. 3), and yet observe the Curie-Weiss behavior.
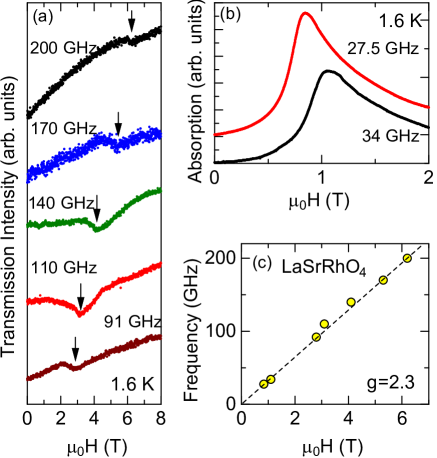
Figure 6(a) shows the millimeter-wave transmission intensity of LaSrRhO4 plotted as a function of external field at 1.6 K. As indicated by the arrows, all the transmission curves have a broad dip, which corresponds to electron spin resonance at the field. The field at which the dip is observed increases with increasing frequency. The dip width is as large as 1 T, suggesting a short spin-lattice relaxation time in this system. Figure 6(b) shows the absorption curve measured with resonant cavities for 27.5 and 34 GHz at 1.6 K. An absorption peak is clearly visible near 1 T with a broad width of 1 T. We should note that the shape of the absorption curve is not symmetric to the resonance field. Such an asymmetric shape has been analysed with a Dysonian function,dysonian but the fitting was not satisfactory for the present data (not shown). At present, we do not understand the origin for the absorption asymmetry, but we speculate that the resonance condition seems to change with increasing external fields, which implies that the dielectric constant may depend on magnetic field.
Figure 6(c) shows the resonance frequency plotted as a function of resonance field. As is clearly seen, the frequency is linear in magnetic field within experimental errors. This is indeed what is expected in electron spin resonance for a noninteracting spin system, and is consistent with the very small in Fig. 5(c). We obtain the value from the proportionality constant expressed by to be 2.3. This value indicates that orbital angular moment is quenching. The perovskite oxide LaCoO3 shows a value of 3.35, nojiri2002 which is explained in terms of in orbitals. Thus the value of =2.3 excludes the possibility that the Rh3+ is in the high-spin state.
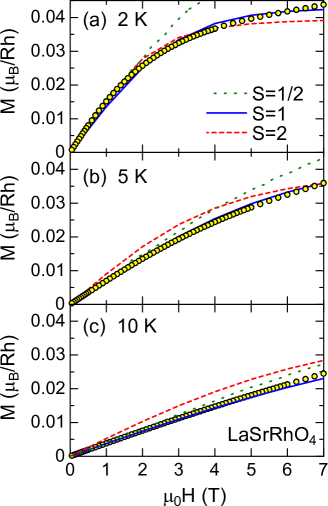
Next let us examine the spin state of the Rh ions responsible from the field dependence of the magnetization. Since the electron configuration of Rh3+ is , a possible magnetic state is the intermediate-spin state (=1) or the high-spin state (=2). Thanks to the weak spin-spin interaction, we can employ the Brillouin function for the fitting, with which we can distinguish from . Figure 7 shows the magnetization-field curves of LaSrRhO4 taken at 2, 5 and 10 K. The magnetization shows saturation behaviour in high fields, which is more significant at lower temperature. This is qualitatively the same as is expected from the Brillouin function. Considering the small value of , we slightly modify the Brillouin function to include the magnetization from the spin-spin interaction, and propose a following function given by
| (2) |
where is the molecular field coefficient given by , and is the inverse temperature . Thus the magnetization is determined by the following self consistent equation expressed as
| (3) |
where is the fraction of the magnetic Rh3+ ions. We take and from the data in Fig. 5, and from Fig. 6. Consequently, the fraction is left as the only one adjustable parameter. The solid, broken and dotted curves in Fig. 7 represent the calculations for , , and respectively. The adjustable parameter is taken to be 1.9 % for , 0.85% for , and 4.7% for , in order to fit low-field magnetization at 2 K. As is clearly seen in Fig. 7, the curves consistently explain the measured magnetization. The large deviation of the calculated curve clearly excludes a possibility that some Rh3+ ions may be disproportionated as Rh and Rh4+ to work as .
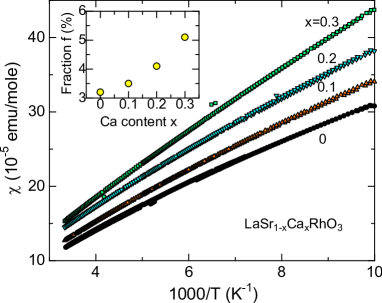
In order to examine the -site disorder effect, we prepared a set of samples of LaSr1-xCaxRhO4. Figure 8 shows the inverse susceptibility of LaSr1-xCaxRhO4 plotted as a function of temperature. The temperature-independent susceptibility is 1.8, 1.5, 1.3 and 0.810-5 emu/mol for 0, 0.1, 0.2 and 0.3, respectively. Unlike the susceptibility of LaSrRh1-xGaxO4, the slope of the susceptibility increases with the Ca content . By fitting the susceptibility with Eq. (1), we obtain the Curie constant , from which we evaluate the fraction of the magnetic Rh3+ through the relation as
| (4) |
By putting =2.3 and =1, we get the fraction as shown in the inset of Fig. 8. We notice that for =0, the fraction of 3.1 % evaluated from Eq. (4) is slightly larger than 1.9 % evaluated from Eq. (3). Normally, the value is determined by ESR accurately, but the distorted signal makes it impossible this time. Since the value is determined to be 2.30.1, the disagreement in the fraction may come from the ambiguity in the value. An important feature is that the fraction increases with the Ca content , which implies that the magnetic Rh3+ ions are related to the degree of the -site disorder.
Finally let us discuss a possible origin of the magnetic Rh3+ ions distributed with a fraction of 2-5%. A first point is that their magnetic moment is stable at all temperature measured, and the number of the magnetic ions is independent of temperature, for the susceptibility obeys the Curie-Weiss law with a small Weiss temperature in a wide range of temperature. A second point is that the magnetic Rh3+ is local, just like a magnetic impurity, and the fraction is almost independent of the -site disorder, but depends on the -site disorder. A third point is that such magnetic signal is related to the layered structure, possibly related to the tetragonal distortion of the RhO6 octahedron. Note that the susceptibility of LaRh0.5Ga0.5O3, has a negligibly small Curie tail as shown in Fig. 4.
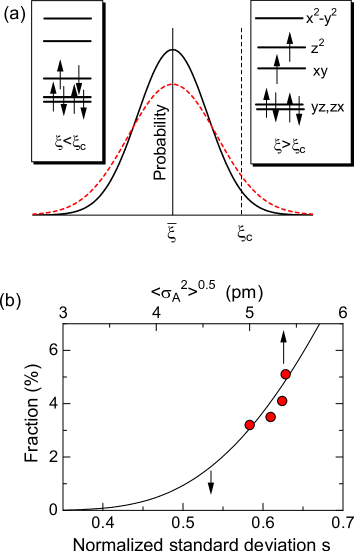
Attfield et al. have discovered that the -site disorder seriously affects the superconducting transition temperature in the doped La2CuO4.attfield1998 Since the transition temperature is sensitive to the bond length of Cu2+ and apical O2- ions,ohta1991 the variance in the out-of-plane Cu-O distance may deteriorate the superconducting properties. We apply a similar story to the title compound. When the Rh-O bond length along the axis direction is sufficiently short, we can regard RhO6 as a regular octahedron, where the low spin state is stable (the left schematic in Fig. 9(a)). On the other hand, when exceeds a critical value of , a long largely splits the energy level between and , and eventually shifts the level downwards. Likewise, it also largely splits the energy level between and , and raises the level. As a result, a small energy gap between the and levels will favor the spin state shown in the right schematic in Fig. 9(a). This configuration is identical to the intermediate spin state proposed for LaSrCoO4.wang2005
We will roughly estimate how the fraction of the magnetic moment is related to the disorderness of the A-site cation. Assuming a Gaussian distribution with the mean value and the variance , equals to the probability for given by
| (5) |
By replacing the variable , we get
| (6) | |||||
| (7) |
where erfc is the complementary error function, and . If we assume to be independent of the Ca concentration in LaSr1-xCaxCoO4, we find is the only parameter, and the fraction is described simply as
| (8) |
Figure 9(b) depicts such relationship, where the fraction is plotted from 0.35 to 0.7. One can see that is a monotonically increasing function of , and the faction increases with the variance in the Rh-O bond. We also plot the standard deviation in the A-site ionic radius as in the same graph. Although this quantity does not equal the standard deviation in the Rh-O distance, one can see that roughly follows the curve given by Eq. (8).
IV summary
We have prepared a set of polycrystalline samples of LaSrRh1-xGaxO4 and LaSr1-xCaxRhO4, and have measured the resistivity, Seebeck coefficient, magnetization and electron spin resonance in order to evaluate the magnetic properties and spin states of the layered rhodium oxides. We find that all the samples show Curie-Weiss-like susceptibility with a small Weiss temperature of the order of 1 K, which is seriously incompatible with the collective wisdom that a trivalent rhodium ion is nonmagnetic. The factor is determined to be 2.3 from the electron spin resonance, and the spin number is determined as from the magnetization-field curves by fitting with a modified Brillouin function. The fraction of the spins is 2-5%, and the disorder in the La/Sr/Ca-site determines the spin fraction.
This work was partially supported by the collaboration with NGK Insulators Ltd., and by ALCA, Japan Science and Technology Agency. The synchrotron x-ray diffraction was performed under the approval of the Photon Factory Program Advisory Committee (Proposal No. 2009S2-S008).
References
- (1) M. Subramanian, G. Aravamudan, and G. S. Rao, Prog. Solid State Chem. 15, 55 (1983)
- (2) P. Battle and W. Macklin, J. Solid State Chem. 52, 138 (1984)
- (3) S. Nakatsuji, S. Ikeda, and Y. Maeno, J. Phys. Soc. Jpn. 66, 1868 (1997)
- (4) S. Sugano, Y. Tanabe, and H. Kamimura, Multiplets of transition-metal ions in crystals (Academic Press, New York, 1970)
- (5) S. Okada and I. Terasaki, Jpn. J. Appl. Phys. 44, 1834 (2005)
- (6) S. Okada, I. Terasaki, H. Okabe, and M. Matoba, J. Phys. Soc. Jpn. 74, 1525 (2005)
- (7) Y. Klein, S. Hébert, D. Pelloquin, V. Hardy, and A. Maignan, Phys. Rev. B 73, 165121 (2006)
- (8) Y. Okamoto, M. Nohara, F. Sakai, and H. Takagi, J. Phys. Soc. Jpn. 75, 023704 (2006)
- (9) S. Shibasaki, W. Kobayashi, and I. Terasaki, Phys. Rev. B 74, 235110 (2006)
- (10) A. Maignan, V. Eyert, C. Martin, S. Kremer, R. Frésard, and D. Pelloquin, Phys. Rev. B 80, 115103 (2009)
- (11) S. Asai, N. Furuta, Y. Yasui, and I. Terasaki, J. Phys. Soc. Jpn. 80, 104705 (2011)
- (12) K. Knizek, J. Hejtmánek, M. Marysko, Z. Jirák, and J. Bursik, Phys. Rev. B 85, 134401 (2012)
- (13) S. Asai, N. Furuta, R. Okazaki, Y. Yasui, and I. Terasaki, Phys. Rev. B 86, 014421 (2012)
- (14) T. Shimura, M. Itoh, Y. Inaguma, and T. Nakamura, Phys. Rev. B 49, 5591 (1994)
- (15) F. Izum and K. Momma, Solid State Phenom. 130, 15 (2007)
- (16) G. Blasse, J. Inorg. Nucl. Chem. 27, 2683 (1965)
- (17) J. F. Britten, H. A. Dabkowska, A. B. Dabkowski, J. E. Greedan, J. L. Campbell, and W. J. Teesdale, Acta Cryst. C 51, 1975 (1995)
- (18) P. M. Chaikin and G. Beni, Phys. Rev. B 13, 647 (1976)
- (19) A. V. Chichev, M. Dlouhá, S. Vratislav, K. Knźek, J. Hejtmánek, M. Marysko, M. Veverka, Z. Jirák, N. O. Golosova, D. P. Kozlenko, and B. N. Savenko, Phys. Rev. B 74, 134414 (2006)
- (20) T. T. M. Palstra, A. P. Ramirez, S. W. Cheong, B. R. Zegarski, P. Schiffer, and J. Zaanen, Phys. Rev. B 56, 5104 (1997)
- (21) Y. Moritomo, K. Higashi, K. Matsuda, and A. Nakamura, Phys. Rev. B 55, R14725 (1997)
- (22) Y. Shimada, S. Miyasaka, R. Kumai, and Y. Tokura, Phys. Rev. B 73, 134424 (2006)
- (23) R. Ang, Y. P. Sun, X. Luo, C. Y. Hao, and W. H. Song, J. Phys. D: Appl. Phys. 41, 045404 (2008)
- (24) J. P. Joshi and S. V. Bhat, J. Magn. Reson. 168, 284 (2004)
- (25) S. Noguchi, S. Kawamata, K. Okuda, H. Nojiri, and M. Motokawa, Phys. Rev. B 66, 094404 (2002)
- (26) J. P. Attfield, A. L. Kharlanov, and J. A. McAllister, Nature 394, 157 (1998)
- (27) Y. Ohta, T. Tohyama, and S. Maekawa, Phys. Rev. B 43, 2968 (1991)
- (28) X. L. Wang and E. Takayama-Muromachi, Phys. Rev. B 72, 064401 (2005)