chenm8@rpi.edu, jichang@buaa.edu.cn, {liangxiao, kexu}@nlsde.buaa.edu.cn
Weighted Shortest Path Models: A Revisit to the Simulation of Internet Routing
Abstract
Understanding how packets are routed in Internet is significantly important to Internet measurement and modeling. The conventional solution for route simulation is based on the assumption of unweighted shortest path. However, it has been found and widely accepted that a packet in Internet is usually not transmitted along the unweighted shortest path between its source and destination. To better simulate the routing behavior of a packet, we thoroughly explore the real-world Internet routes and present a novel local information based simulation model, with a tuning parameter, which assigns weights to links based on local information and then simulates the Internet route with weighted shortest path. Comparisons with baseline approaches show its capability in well replicating the route length distribution and other structural properties of the Internet topology. Meanwhile, the optimal parameter of this model locates in the range of , which implies that a packet inside the Internet inclines to move to nodes with small degrees. This behavior actually reflects the design philosophy of Internet routing, balancing between network efficiency and traffic congestion.
Keywords:
Internet Routing, Shortest Path, Internet Measurement, Traceroute, Local Information1 Introduction
It is very important to track how a packet is routed inside Internet, which is of great help to Internet measurement and modeling. Specifically, it could assist the deployment of sources and destinations for traceroute which is a generally employed tool to sample Internet [2, 1, 3, 19, 14, 22, 6, 7]. However, the realistic routing process in Internet is complicated, which makes the simulation of the Internet routes be a significant challenge. For simplicity, almost all previous approaches assumed that a route in Internet is just an unweighted shortest path between the source and the destination [12, 16, 8, 15, 4]. Based on this assumption, [12] proposed three mechanisms for the exploration process of traceroute: USP (Unique Shortest Path), RSP (Random Shortest Path), and ASP (All Shortest Path). While USP model, also called (k,m)-traceroute, is the most widely used one. Namely, the classical approach to simulate the Internet routing is to consider it as an unweighted shortest path model (USPM). However, generally, real routes do not have the same properties as the unweighted shortest path model assumes, which has already been pointed out in [21, 18, 25] and could be learned from their route length distribution difference in Subsection 3.1. Instead, the real routes are impacted by many factors, including commercial agreements, traffic congestion, and administrative routing policies [23].
To improve the route simulation, recently a node degree model (NDM) [18] was proposed, whose idea is as follows. Two paths are calculated initially, one starting from the source and the other from the destination, where the next selected node on the path is always the highest degree neighbor of the current node. The computation terminates when it reaches a situation where a node is the highest degree neighbor of its own highest degree neighbor. Then, one of two cases applies: either the two paths have met at a node, or they have not. In the first case, the route produced by the model is the discovered path. In the second case, the model tries to find a shortest path between the two paths, and then obtains the route by merging the two paths and the shortest path. However, there is still a large gap between this model and the real Internet routing. It is still somewhat based on the unweighted shortest path method and has no physical senses for its omitting the principles of link dynamic [24], traffic dynamic [26], etc. For instance, it does not take the path attributes, such as delay, loss rate, and available bandwidth, into account. Also, it always routes to the large degree nodes, that is to say, routes to the core of the network, without considering the traffic load balance [5, 11]. Imagining that there is a link between two nodes at the border of Internet, it is unnecessary and unreasonable for one of them via the backbone of the network in order to reach the other.
Thus, a new and more accurate model with physical meanings is still needed. In this paper, we thoroughly investigate the real-world traceroute traces and propose two new simulation models, Local Information Based Model (LIM) and Path Feature Based Model (PFM) both with tunable parameters , which weigh links flexibly and then simulate the Internet routing with weighted shortest path. The weights to links that our models assign are intent to mimic the link dynamic [24], traffic dynamic [26], etc. The comparison of our two models with USPM and NDM shows that our two models, especially LIM, could more accurately simulate the real Internet routes. In addition, the optimal parameter of LIM locates in the range of , which implies that a packet in Internet tends to move to small degree nodes. This behavior reflects the trade-off between network efficiency and traffic load balance in the design philosophy of Internet routing.
The rest of this paper is organized as follows. First, in Section 2 we provide the preliminaries. Then we present the motivation of this work and give an introduction to our new models in Section 3. Section 4 evaluates our models and analyzes the underlying mechanisms for optimal parameters. Finally, we conclude this work briefly in Section 5.
2 Preliminaries
The mapping of the topological structure is greatly important for a better understanding of Internet. Current explorations still rely on the extensive use of traceroute: one collects routes from a limited set of sources to a large set of destinations, and then merges the obtained paths into a graph. This method has been adopted by many influential network topology discovery projects [2, 1, 3, 19, 14, 22, 6]. In order to better simulate the Internet routes, we deeply study the real traceroute traces of two network topology datasets: iPlane [19] and skitter [2]. The routes of both datasets are undirected and unweighted. Also, we evaluate our two models and compare them with other models on these two datasets.
iPlane: The Information Plane performs traceroutes from about two hundreds vantage points every day to map the worldwide IPv4 network topology, and uses the structural information to predict path properties between arbitrary end-hosts. The dataset we use was collected on June, 30, 2011. However, the set of destinations varies among the sources. Therefore, for the convenience of comparison, we obtain a set of 140 sources to a common set of 20,419 destinations. The resulting graph has 266,317 nodes and 1,663,170 edges.
skitter: skitter has deployed more than 30 vantage points around the world to map the IPv4 network topology. The dataset we use was collected on October, 15, 2005. Yet, the set of destinations varies among the sources. Similarly, we obtain a set of 21 sources to a common set of 157,290 destinations. The final graph has 771,312 nodes and 1,785,922 edges.
The Internet topology can be naturally modeled as an undirected graph , where denotes the set of nodes and is the set of edges. The number of links of a node is defined as its degree. Then, the average degree of a network can be defined as . The degree distribution of a graph is denoted as . For Internet, follows a power-law distribution [13]. In such case, the exponent could be considered as an indicator of how heterogeneous this distribution is. Heterogeneity of a network, defined as , is usually used to characterize the nonuniformity of degrees. The clustering coefficient of a graph is the probability that two nodes are connected, given that they are both linked to a same third node , where denotes the number of triangles (set of three nodes with three edges) and is the number of connected triples (set of three nodes with at least two edges) in the graph.
3 New Simulation Models
In this section, we first describe the motivation that propels us to propose better simulating models for the realistic Internet routing. Then, we give an introduction to our two weighted based shortest path models.
3.1 Motivation
In this subsection, we deeply analyze the real traceroute traces of the two real datasets and the corresponding unweighted shortest paths from all the sources to all the destinations. Unfortunately, there are large differences in the routes length distribution and the node degrees visited probabilities distribution between the real traces and the corresponding unweighted shortest paths.
3.1.1 Routes Length Distribution
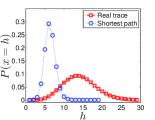
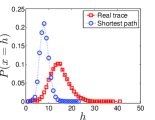
Fig. 1 shows the routes length distributions of the real traces and the corresponding unweighted shortest paths of the two datasets, respectively. As can be seen, the two distributions have large difference with each other. Also, the real traceroute traces have a mean route length of 14.11 hops and 14.57 hops, while the unweighted shortest paths have an average route length of 6.36 hops and 7.39 hops on iPlane and skitter datasets, respectively. The former is almost two times longer than the latter. It strongly indicates that USPM is an improper method to simulate the real Internet routes.
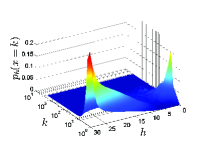
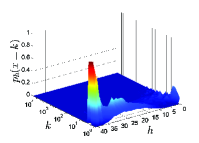
3.1.2 Node Degree Visited Probability Distribution
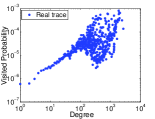
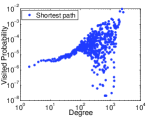
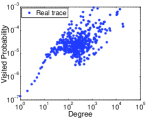
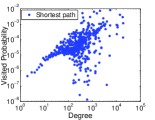
The node degrees visited probabilities distributions of the real traces and the unweighted shortest paths of the two datasets are shown in Figures 2 and 3, respectively. It is interesting to note that in Figures 2(a) and 3(a), for some nodes with high degrees, they might be rarely visited in the real routes, which in another way implies that the assumption NDM has made is unsatisfactory. It is also worthy noting that for some high degree nodes in unweighted shortest paths, their visiting possibilities are as large as (a magnitude larger than the real traces with probabilities being ), which indicates that USPM is prone to visit high degree nodes more. In addition, Figures 2 and 3 show that when the node degrees are large, their visited probabilities observed from unweighted shortest paths, from to , fluctuate more severely than those observed from the real traces, from to . Hence, USPM differs significantly from the real case.
The above two phenomena motivate us to put forward better simulating models to more accurately characterize the two kinds of distributions above, especially the routes length distribution.
3.2 Local Information Based Model (LIM)
In scale-free networks with degree distributions following power-law, previous researches [26, 27] have pointed out that unweighted shortest path based routing strategy, that is USPM, would reduce the communication efficiency of networks. The reason is that such kind of strategy inclines to transmit traffic to the hubs with large degrees, which would easily introduce traffic jam to these hubs thereby inducing the decrease of the network communication capability. The situation would be severer if using NDM since it always routes packets to the highest degree neighbors of nodes. To avoid this issue and so forth to better simulate the Internet routing, we propose a new model that uses the local information
| (1) |
to assign weight to the edge between nodes and with the current node and the next routing node, where the sum runs over the neighbors of , is the degree of node , and is a tunable parameter. We regard the graphs as bidirectional ones and the weights of the bidirectional edges between two nodes are different, which accords to the different path features of up and down links in reality. After weighing, we carry out weighted shortest path method to simulate the real routes. In this model, we could intuitively learn that here means the links connected to the neighbors with higher degrees might be preferentially introduced into the shortest path, while , the situation would be reversed to choose the links connected to the lower degree neighbors with higher priority.
3.3 Path Feature Based Model (PFM)
In this subsection, we describe PFM which uses the path features to add weights to the corresponding edges and then simulates the real Internet routes by conducting weighted shortest path algorithm. Also, the weights of the bidirectional edges between each pair of connected nodes are different. Weights of links () are assigned based on the bounded Pareto distribution, which is the simplest heavy-tailed distribution with the probability density function
| (2) |
where determines the shape, denotes the minimal value, and denotes the maximal value.
This model is mainly driven by the fact that in Internet heavy-tailed distributions have been observed in the context of traffic characterization, known as the self-similar nature of traffic [20, 10, 17]. In addition, [21] observed high variability in path features, such as round-trip time, loss rate, and bandwidth, and wide variability is one of the characteristics of heavy-tailed distributions. Consequently, in this model, we allocate weights to edges according to the Pareto distribution of the corresponding path attributes, such as delay, loss rate, available bandwidth, and traffic load, and then simulate the real routes by performing weighted shortest path method. It is consistent with the real-world scenario that a packet is routed to the link with smaller delay, smaller loss rate, lighter traffic load, larger available bandwidth, and so on, in order to reach the target more efficiently and with a higher delivery success rate.
In summary, we present two new models with tunable parameters , which makes our models much more flexible than other models. In fact, different values of the parameter would generate different weights for the edges and stand for diverse physical link situations in real Internet routes. In the next section, we evaluate these models and determine the best configuration of our models.
4 Evaluation and Discussion
This section first evaluates our models, i.e., compares the performance of LIM, PFM, NDM [18], and USPM on the estimated accuracy of the structural properties of the real network datasets. Then, we explain why our models are better than other existing models and discuss the implications of optimal parameters.
4.1 Evaluation
In this subsection, we evaluate our models on the two real datasets: iPlane and skitter. The evaluation examines their accuracies of simulating the routes length distribution and estimating the other network topological properties, including average degree, degree distribution power-law exponent, clustering coefficient, and heterogeneity. The simulation experiments of all the four models are conducted from 140 sources to common 20,419 destinations on iPlane dataset and from 21 sources to a common set of 157,290 destinations on skitter dataset as described in Section 2. For parameter configuration, we set for LIM and we configure , , and for PFM. We adopt the mean of 100 independent experiments as the final result for each .
4.1.1 Routes Length Distribution
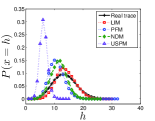
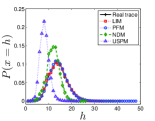
Figure 4 presents the routes length distribution of the real traces and the four models on the two real datasets, respectively. The routes length distributions of LIM and PFM are their optimal ones obtained by tuning the parameter . On iPlane, the best for LIM and PFM is and , respectively; when on skitter dataset, and is the best for LIM and PFM, respectively. It can be seen that the routes length distributions of LIM on iPlane and skitter datasets are almost the same with those of the real trace. While, with regard to the other three models, there is still a considerable gap as compared to the real one, especially for NDM and USPM. Consequently, it can be concluded that LIM is the best model to simulate the routes length distribution of the real routes. Note that we will not consider USPM in the following evaluation for its extremely bad simulation of the routes length distribution of the real Internet routes.
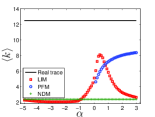
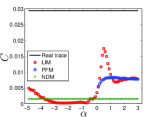
4.1.2 Average Degree
Fig. 5 shows the average degree of and those of the sampled graphs by adopting the three models: LIM, PFM, and NDM. It indicates that our two models, in most cases, are much better than NDM. LIM reaches its peaks on the two datasets when and , respectively; PFM reaches its peaks on both datasets when . Besides, PFM is always better than NDM; LIM is much better than NDM on the two datasets when and , respectively. Hence, our two models are more effective than NDM on sampling the average degree of the underlying network.
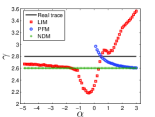
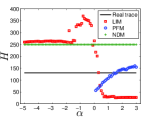
4.1.3 Power-law Degree Exponent
Fig. 6 presents the degree distribution power-law exponent , which is calculated with the least square method [9], of and those of the sampled graphs by adopting the three models. It can be observed that our models could achieve the same values with the real trace. LIM obtains the same values with on both iPlane and skitter datasets when ; PFM gets the same values with on the two datasets when and , respectively. Moreover, PFM is, in most cases, better than NDM; LIM is better than NDM on the two network datasets when and , respectively. Consequently, we can infer that our two models perform much better than NDM on simulating the degree distribution.
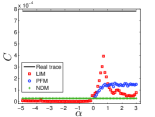
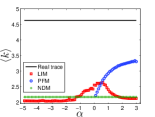
4.1.4 Clustering Coefficient
Fig. 7 shows the clustering coefficient of and those of the sampled graphs by adopting the three models. It indicates that our two models, in most cases, are much better than NDM. LIM reaches its peaks on the two datasets, iPlane and skitter, when and , respectively; PFM reaches its peaks on both datasets when . Further, PFM is always better than NDM and LIM is much more effective than NDM on both datasets when . Therefore, our two models could obtain a more accurate estimation of the clustering coefficient of the underlying network.
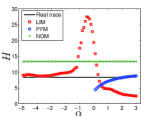
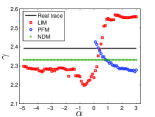
4.1.5 Heterogeneity
Fig. 8 presents the heterogeneity of and those of the sampled graphs by adopting the three models. It can be found that our models could achieve almost the same values with the real trace. LIM obtains the same values with on both datasets when ; PFM gets the same values with on iPlane and skitter datasets when and , respectively. Besides, PFM is always better than NDM; LIM is better than NDM on iPlane dataset when and , and it is better than NDM on skitter dataset when . Consequently, it could be concluded that our models could sample the heterogeneity of the network with a convincing fidelity.
4.2 Evaluation Conclusion
In previous subsection, we evaluate our models both on routes length distribution and on the other network topological properties, such as average degree, degree distribution, clustering coefficient, and heterogeneity, on the two real datasets: iPlane and skitter. The evaluation implies that our two models are more effective than NDM not only on the simulating of routes length distribution, but also on the sampling of the other structural properties. In addition, our models do not give rise to more consuming time and have the similar computing complexity as NDM and USPM. However, PFM is much worse than LIM on modeling the routes length distribution. Particularly, it has been found in reality that for self-similar traffic, for PFM should be in the region of [17], which is not overlapped with the proper range we find above. Therefore, for a better simulation of the real Internet routes, we recommend LIM instead of PFM. But it is also important to point out that one has to choose different proper for LIM in order to achieve the best sampling of different network properties, which is shown in Table 1. However, it is interesting to observe from Table 1 and also from previous subsection that when setting , almost all of the topological properties could be under accurate estimation. Thus, to better model the Internet routing, LIM with is recommended; in addition, researchers could set to be around 0.5 to more accurately estimate the other network structural properties except the routes length distribution.
| Dataset | Topological property | LIM() |
|---|---|---|
| Routes length distribution | 1.6 | |
| 0.4 | ||
| iPlane | 0.5 | |
| 0.5 | ||
| 0.4 | ||
| Routes length distribution | 0.9 | |
| 0.6 | ||
| skitter | 0.5 | |
| 0.7 | ||
| 0.4 |
4.3 Discussion
In this subsection, we explain why the proper value of for LIM should be in the range of and the implications of such range.
As stated in [26, 27] that when in Eq. 1 is positive, the traffic load on each node and also the packet traveling time would follow power-law distributions, which indicates the highly heterogeneous status; when , the traffic load on each node and the packet traveling time would display as Poisson distribution and exponential distribution, respectively, which represents a homogeneous state. Additionally, a positive in [26, 27] represents that packets tend to be routed to the nodes with large degrees, which induces the hubs easily turn to be jammed and then decreases the communication capability of the networks. While, a negative in [26, 27] illustrates that the communication networks, in some cases, try to shunt some traffic from the hubs to the nodes with small degrees in order to reduce the loads of those hubs. Therefore, in those research work, a negative is better than a positive . While the negative in [26, 27] is corresponding to the positive in our research because we adopt the values of Eq. 1 as the weights of the edges and then perform the weighted shortest path algorithm. There is also an interesting phenomenon that in the real Internet routes, packets incline to move to nodes with small degrees, which could be seen from Fig. 9 that presents the degree distribution of routes in each hop extracted from the real traceroute traces of iPlane and skitter datasets, respectively. It shows that, in most cases, routes with their routing at each hop tend to move to the small degree nodes, especially the nodes with degrees from 1 to 10. This phenomenon surprisingly justifies that the route strategy with in [26, 27] and LIM with in our work reflect the realistic situation in the Internet routes. Meanwhile, it could be used to explain the poor performance of USPM and NDM, which are their intents of targeting the large degree nodes.
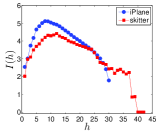
Moreover, [26, 27] declared that the packet traveling time increases as the decrease of the negative in their route strategy. It is the cost that the network should pay for reducing the burdens of hubs by transferring some traffic to low degree nodes, which, in purpose, enhances the communication capability of the network. This fact also reflects the phenomenon that the increase of the average length of the routes as the increase of the positive in LIM. However, it is also stated in [26, 27] that is far from the larger the better, because too large may sharply increase the packet traveling time, which would in turn decrease the network’s communication capability too. In addition, as shown in Fig. 9, especially in Fig. 9(b), the node degree (from 1 to 100) distributes relatively evenly for some small hops (from 5 to 15), which indicates that the low degree nodes are relatively less dominant in these hops as compared to other large ones. Moreover, we define the entropy of each hop as
| (3) |
where is the hop, is the node degree that appears in this hop, and is its probability. It is worthy noting that here we omit the with . According to the definition, larger means in that hop , each node degree distributes relatively evenly, while lower means some node degrees are dominant in this hop. Fig. 10 shows that on both iPlane and skitter datasets, when the hop is in the range of , different node degrees distribute somewhat evenly, while in other hops, mainly the low node degrees dominate. It tells us that for many small hops, the nodes with intermediate degrees (from 10 to 100) would be considered in the routing, while too large for LIM would indeed ignore them entirely. Consequently, in LIM should be in the range of instead of exceeding 2.
To sum up, our simulating model LIM, with in the range of , represents the real situation of the Internet routes. It actually reflects the design philosophy of Internet, trying to achieve a trade-off between network communication efficiency (packet traveling time) and traffic load balance among nodes. The range for LIM would reach a win-win situation on both aspects. Thus, LIM is a better model to simulate the routes in the Internet.
5 Conclusion
In this paper, we deeply study the real Internet routes and propose two novel models to well simulate the Internet routing. Through thoroughly comparison with existing models, we find that one of our models, LIM, could outstandingly simulate the routes length distribution and better estimate the other topological properties of the Internet topology with proper configurations of the parameter . Besides, we recommend research community using LIM with in the range of to achieve better estimation on the overall properties of the real routes in Internet, more specifically with around 0.5 to more accurately estimate the other network structural properties except the routes length distribution.
References
- [1] CAIDA Scamper tool, http://www.caida.org/tools/measurement/scamper/
- [2] CAIDA Skitter tool, http://www.caida.org/tools/measurement/skitter/
- [3] DIMES@home project, http://www.netdimes.org/new/
- [4] Achlioptas, D., Clauset, A., Kempe, D., Moore, C.: On the bias of traceroute sampling: Or, power-law degree distributions in regular graphs. J. ACM 56, 21:1–21:28 (Jul 2009)
- [5] Augustin, B., Friedman, T., Teixeira, R.: Measuring load-balanced paths in the Internet. In: Proceedings of IMC. pp. 149–160. ACM, New York, NY, USA (2007)
- [6] Bourgeau, T., Friedman, T.: Efficient IP-level network topology capture. In: Passive and Active Measurement, vol. 7799, pp. 11–20 (2013)
- [7] Brownlee, N.: On searching for patterns in traceroute responses. In: Passive and Active Measurement, vol. 8362, pp. 67–76 (2014)
- [8] Clauset, A., Moore, C.: Accuracy and scaling phenomena in Internet mapping. Phys. Rev. Lett. 94(1), 018701 (Jan 2005)
- [9] Clauset, A., Shalizi, C.R., Newman, M.E.J.: Power-law distributions in empirical data. SIAM Review 51, 661–703 (2009)
- [10] Crovella, M.E., Bestavros, A.: Self-similarity in world wide web traffic: evidence and possible causes. IEEE/ACM Trans. Netw. 5, 835–846 (Dec 1997)
- [11] Cunha, I., Teixeira, R., Diot, C.: Measuring and characterizing end-to-end route dynamics in the presence of load balancing. In: Passive and Active Measurement. pp. 235–244 (2011)
- [12] Dall’Asta, L., Alvarez-Hamelin, I., Barrat, A., Vázquez, A., Vespignani, A.: Exploring networks with traceroute-like probes: theory and simulations. Theor. Comput. Sci. 355(1), 6–24 (2006)
- [13] Faloutsos, M., Faloutsos, P., Faloutsos, C.: On power-law relationships of the internet topology. SIGCOMM Comput. Commun. Rev. 29(4), 251–262 (Aug 1999)
- [14] Govindan, R., Tangmunarunkit, H.: Heuristics for Internet map discovery. In: IEEE INFOCOM. pp. 1371–1380 (2000)
- [15] Jean-Loup, G., Latapy, M., Magoni, D.: Relevance of massively distributed explorations of the Internet topology: qualitative results. Comput. Netw. 50, 3197–3224 (Nov 2006)
- [16] Lakhina, A., Byers, J.W., Crovella, M., Xie, P.: Sampling biases in IP topology measurements. In: IEEE INFOCOM. pp. 332–341 (2003)
- [17] Le-Ngoc, T., Subramanian, S.: A pareto-modulated poisson process (PMPP) model for long-range dependent traffic. Comput. Commun. 23, 123–132 (Jan 2000)
- [18] Leguay, J., Latapy, M., Friedman, T., Salamatian, K.: Describing and simulating Internet routes. Comput. Netw. 51, 2067–2085 (Jun 2007)
- [19] Madhyastha, H.V., Isdal, T., Piatek, M., Dixon, C., Anderson, T., Krishnamurthy, A., Venkataramani, A.: iPlane: an information plane for distributed services. In: Proceedings of OSDI. pp. 367–380. Berkeley, CA, USA (2006)
- [20] Paxson, V.: Wide-area traffic: the failure of poisson modeling. IEEE/ACM Trans. Netw. 3, 226–244 (Jun 1995)
- [21] Paxson, V.: End-to-end routing behavior in the Internet. IEEE/ACM Trans. Netw. 5, 601–615 (Oct 1997)
- [22] Spring, N., Mahajan, R., Wetherall, D., Anderson, T.: Measuring ISP topologies with rocketfuel. IEEE/ACM Trans. Netw. 12(1), 2–16 (2004)
- [23] Tangmunarunkit, H., Govindan, R., Shenker, S., Estrin, D.: The impact of routing policy on Internet paths. In: in Proc. 20th IEEE INFOCOM. pp. 736–742 (2001)
- [24] Teixeira, R., Marzullo, K., Savage, S., Voelker, G.M.: Characterizing and measuring path diversity of Internet topologies. In: SIGMETRICS. pp. 304–305. ACM, New York, NY, USA (2003)
- [25] Viger, F., Barrat, A., Dall’Asta, L., Zhang, C.H., Kolaczyk, E.D.: What is the real size of a sampled network? the case of the Internet. Physical Review E 75(5), 056111 (2007)
- [26] Wang, W.X., Wang, B.H., Yin, C.Y., Xie, Y.B., Zhou, T.: Traffic dynamics based on local routing protocol on a scale-free network. Physical Review E 73 (2006)
- [27] Yin, C.Y., Wang, B.H., Wang, W.X., Zhou, T., Yang, H.J.: Efficient routing on scale-free networks based on local information. Physics Letters A 351(4-5), 4 (2005)