K. Morokuma-Matsui et al.Stacking Analysis of 12CO and 13CO Spectra of NGC 3627
and
Galaxies: ISM – Galaxies: structure – ISM: molecules – Radio lines: ISM
Stacking Analysis of 12CO and 13CO Spectra of NGC 3627:
Existence of non-optically thick 12CO emission?
Abstract
We stacked 12CO and 13CO spectra of NGC 3627 after redefining the velocity axis of each spectrum of the mapping data so that the zero corresponds to the local mean velocity of 12CO spectra. The signal-to-noise ratios of the resulting spectra are improved by a factor of up to 3.2 compared to those obtained with normal stacking analysis. We successfully detect a weak 13CO emission from the interarm region where the emission was not detected in the individual pointings. We compare the integrated intensity ratios among six characteristic regions (center, bar, bar-end, offset, arm, and interarm). We find that in the bar and interarm are higher than those in the other regions by a factor of and in the center is moderately high. These high ratios in the bar and center are attributed to a high intensity ratio () and one in the interarm is attributed to a high ratio of the full width at half maximum of spectra (FWHMFWHM). The difference between FWHM and FWHM of the interarm indicates the existence of two components, one with a narrow line width ( FWHM) and the other with a broad line width ( FWHM). Additionally, the ratio in the broad-line-width component of the interarm is higher than the other regions. The high in the center and bar and of the broad-line-width component in the interarm suggest the existence of non-optically thick 12CO components. We find that more than half of the 12CO emissions of the interarm are likely to be radiated from the diffuse component. Our result suggests that the use of a universal CO-to-H2 conversion factor might lead to an overestimation of molecular gas mass and underestimation of star-formation efficiency in the interarm by a factor of a few.
1 Introduction
Molecular clouds are birthplaces of stars that form the visible backbones of galaxies. Therefore, it is important to investigate the molecular gas mass, its distribution in galaxies and its physical properties to understand galaxy evolution. Molecular gas in galaxies mainly consists of H2 molecules. However, H2 molecules do not radiate line emissions in cold environments such as molecular clouds whose temperature is typically a few tens K, since H2 is a homonuclear diatomic molecule (i.e., no dipole moment). Molecular gas mass is usually estimated indirectly from observations of heteronuclear diatomic molecules such as 12CO and its isotopologues since they are the second most abundant molecules after H2 in the interstellar medium. Therefore, 12CO line (12CO, hereafter) has been commonly used to observe molecular gas in external galaxies as well as the Galactic objects.
It has been observationally shown that the 12CO line luminosity correlates with the molecular gas mass estimated in several different ways, such as virial techniques, dust emission, extinction mapping and gamma-ray observation ([Bolatto et al. (2013)] and references therein). The correlation between 12CO luminosity and molecular gas mass is explained theoretically under the assumptions that 1) molecular clouds are virialized, 2) the mass of clouds are dominated by H2, 3) the clouds follow the size-line width relation and 4) they have a constant temperature ([Bolatto et al. (2013)] and references therein). According to the observational evidence and the theoretical explanation above, the mass and distribution of molecular gas in nearby galaxies have been investigated with the observed 12CO maps by assuming a constant CO-to-H2 conversion factor over a whole galaxy (e.g., BIMA SONG, [Helfer et al. (2003)]; Nobeyama CO atlas, [Kuno et al. (2007)], hereafter K07; Heracles, [Leroy et al. (2009)]).
For a more accurate estimation of the molecular gas mass, multiple CO-isotopologues should be used in a complementary manner. The mass of virialized molecular clouds can be measured with 12CO and the higher opacity of 12CO allows us to trace the molecular gas with lower densities on the order of cm-3. On the other hand, the opacity of 12CO is too high to estimate the column density through the molecular cloud unlike more optically thin lines such as 13CO and C18O (13CO and C18O, hereafter). However, the line intensities of these CO-isotopologues are usually much weaker than that of 12CO (by factors of for 13CO and for C18O, respectively) and require a lot of telescope time to be detected. Therefore, 13CO or C18O mapping observations toward nearby galaxies have been limited to only a handful of cases (Hüttemeister et al., 2000; Paglione et al., 2001; Tosaki et al., 2002; Hirota et al., 2010; Watanabe et al., 2011).
Some studies have investigated the relation between the physical states of molecular gas and galactic structures such as arms and bars from the CO multi-isotopologue observations (e.g. Hüttemeister et al. (2000); Meier & Turner (2004)). Watanabe et al. (2011) (hereafter W11) observed NGC 3627 in 13CO and showed high 12CO/13CO intensity ratios in the bar region. They concluded that the high 12CO/13CO ratio indicates the existence of gravitationally unbound diffuse gas as a result of the strong streaming motion in the bar region. Spiral arms are also likely to affect not only the dynamics of molecular clouds but also their internal physical conditions. The molecular gas in spiral galaxies is expected to be accumulated at the arm region through galactic shocks (e.g. Fujimoto (1968); Roberts (1969); Egusa et al. (2011)) and sheared out in interarm regions due to the differential rotation. However there are only a few studies that focus on the physical states of molecular gas in interarm regions since even the 12CO emission is quite weak (Tosaki et al., 2002). To understand the effects of spiral arms on the molecular clouds, it is necessary to detect emissions of CO isotopologues in the first place and then investigate the physical states of molecular gas in the interarm region.
The aim of this paper is to detect weak 13CO emission and investigate the relationship between the galactic structures and properties of molecular gas by comparing 12CO and 13CO spectra in the characteristic regions of spiral galaxies. We stacked 12CO and 13CO spectra of a nearby barred spiral galaxy, NGC 3627111 NGC 3627 is classified as SABb in the Third Reference Catalog of Bright Galaxies (RC3, de Vaucouleurs et al. (1991)) and has slightly asymmetric spiral arms. This asymmetric feature of the spiral arms is thought to have arisen from a past interaction with a neighboring galaxy, NGC 3628 (Haynes et al. (1979); Zhang et al. (1993)). obtained in previous studies (K07 and W11) after shifting the velocity axis so that the zero of the 13CO spectra corresponds to the local mean 12CO velocity. This stacking method was originally proposed by Schruba et al. (2011) where the local mean velocity of HI is adopted as the zero velocity of 12CO spectra in the outer region of galaxies. This allows us to improve the signal-to-noise ratios (S/N) of the spectra. Then we discuss the physical properties of molecular gas in the interarm region by comparing the 12CO and 13CO spectra.
The structure of this paper is as follows: The data and method are explained in section 2. We show the results of the stacking analysis of the 12CO and 13CO spectra in the different regions of NGC 3627 in section 3. We compare the 12CO with 13CO stacked spectra in section 4 and discuss the physical properties of the molecular gas in the different regions of NGC 3627 in section 5. Finally, we summarize this study in section 6.
2 Data & stacking technique
We first summarize the data we used and the stacking method in the following sub-sections.
2.1 Data
| 12CO | 13CO | |
|---|---|---|
| Date | April in 2004 | May in 2007 and April in 2008 |
| Telescope | the 45-m telescope at NRO | the 45-m telescope at NRO |
| 0.4 | 0.31 | |
| Receiver | BEARS | BEARS |
| Backend | digital spectrometers | digital spectrometers |
| Band width (MHz) | 512 | 512 |
| Grid spacing | ||
| r.m.s. (mK, ) | ||
| Velocity resolution (km s-1) | 5 | 20 |
| Reference | Kuno et al. (2007) (K07) | Watanabe et al. (2011) (W11) |
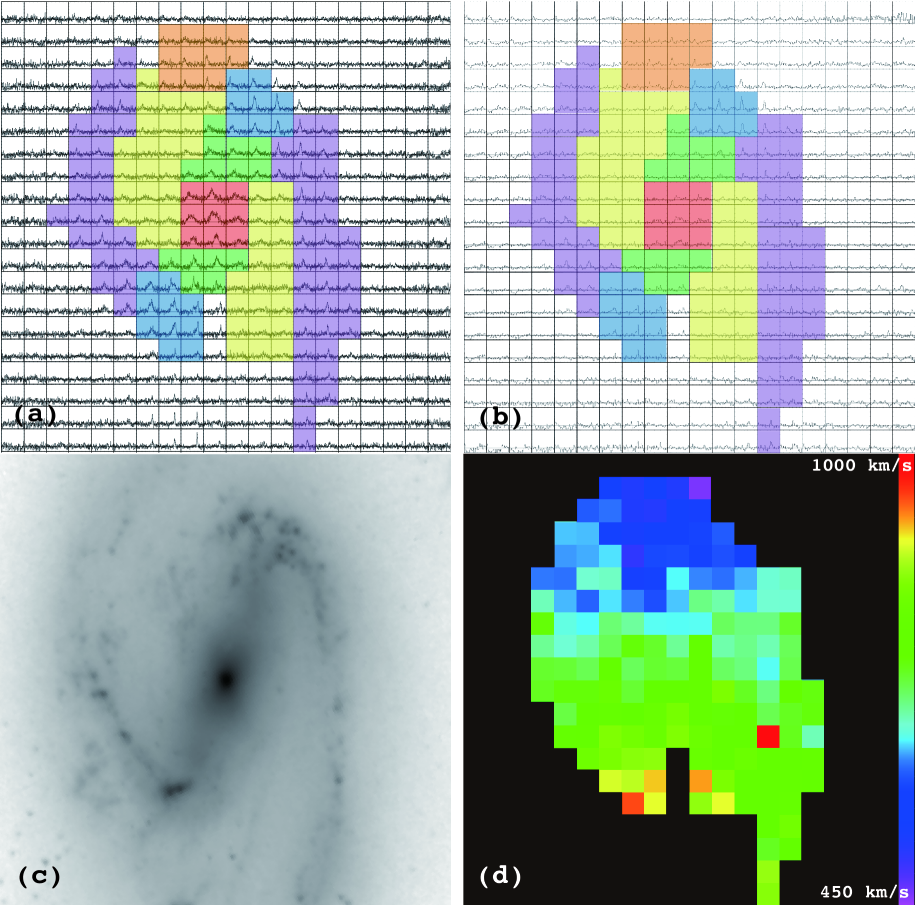
12CO and 13CO mapping data of NGC 3627 were both obtained with the 25-BEam Array Receiver System (BEARS) which is a 25 beam SIS receiver mounted on the 45-m radio telescope at the Nobeyama Radio Observatory (NRO) (K07; W11). The rest-frame frequencies of 12CO and 13CO are adopted as GHz and GHz, respectively. For the backend, 25 digital spectrometers (Sorai et al., 2000) were used with a total bandwidth of 512 MHz and frequency resolution of 605 kHz centered on the frequency corresponding to the local standard of rest (LSR) receding velocity. We adopted as a half-power beam width (HPBW) of both data in the same way as W11, which corresponds to 800 pc assuming a distance of 11.1 Mpc to NGC 3627 (Saha et al., 1999)222To be exact, the beam sizes at the frequency of 12CO and 13CO are and , respectively but no correction is applied since the error due to this is expected to be small, especially for the spatially extended sources ( even for a point source, W11).. The grid spacing of the map is ( pc). The typical r.m.s. noise temperatures (in scale) of 12CO and 13CO data are mK at 5 km s-1 resolution and 616 mK at 20 km s-1 resolution, respectively. The profile maps of 12CO and 13CO are shown in figure 1. The observations are summarized in table 1. More detailed information of the observations is described in the original studies, K07 for 12CO and W11 for 13CO, respectively.
2.2 Stacking analysis of 12CO and 13CO spectra with Velocity-axis Alignment (VA)
Schruba et al.(2011, 2012) improved the sensitivity for 12CO emission in outer regions of galaxies by up to about one order of magnitude over previous studies with the stacking method they invented. One way to reduce the r.m.s. noise temperature is to stack the spectra from various regions in the galaxy. However, because the systemic velocities of each part of the galaxy are different due to galactic rotation, simple stacking will result in a smeared spectrum and may not yield the highest S/N. The method adopted by Schruba et al. (2011) overcomes this problem by shifting the spectrum in the velocity axis so that they are aligned with the mean of the local HI velocity, before stacking the spectra. The S/N of the integrated intensity increases by a factor of , taking into account that the error of the integrated intensity can be expressed as , where is the velocity range to be integrated to calculate the integrated intensity of the spectra obtained with normal stacking, is one with stacking after the velocity-axis alignment, is the r.m.s. noise temperature and is the velocity resolution of the data (Schruba et al., 2012). Here is narrower than thanks to the velocity-axis alignment. Another reason is the reduction of frequency-dependent noise produced by systematic effects of weather, receiver instabilities and standing waves occurring during the transmission of the signal. These sources of additional noise are canceled out if the spectra are stacked after applying different velocity shifts for each pixel (Schruba et al., 2011).
Schruba et al. (2011) stacked 12CO spectra of the outer HI-dominated region after shifting the velocity axis so that the zero velocity of the 12CO spectra corresponds to the local mean HI velocity. In this paper, we adopt an intensity weighted mean velocity of 12CO as a reference velocity for the velocity-axis alignment procedure and apply the stacking method of Schruba et al. (2011) to improve the S/N of 13CO spectra as well as that of 12CO spectra.
First, the velocity field of NGC 3627 is estimated with the 12CO data. The intensity-weighted mean velocity of each pixel of the 12CO map is given by,
| (1) |
The obtained first-moment map is shown in figure 1 (d). Then the shifted velocity of each spectrum is defined as
| (2) |
where is the original velocity of the spectrum. Hereafter, we refer to this procedure as velocity-axis alignment (VA).
The averaged spectra of six different regions, 1) center, 2) bar, 3) bar-end, 4) offset333Offset region denotes an area where the emission runs off toward the leading side of the stellar bar (W11)., 5) arm and 6) interarm were obtained by stacking the spectra after the VA procedure444 We integrated full velocity range for the calculation of the local mean velocities of the all regions but the offset region. The mean velocities of the spectra in the offset region, which is shown as an orange region in figure 1, are estimated by the integration ranging from to km s-1, since we could not obtain adequate value in case of the full range integration due to poor quality of the baseline.. The regions of 1) 4) were determined according to W11. We visually defined 5) arm and 6) interarm regions by dividing the “other” region in W11 according to optical and near infrared (NIR) images. NIR image ( m) from the SIRTF Nearby Galaxies Survey (SINGS, Kennicutt et al. (2003)) is shown in figure 1c. Each area is illustrated in different colors in figures 1a and 1b in the following way, the center in red, bar in green, bar-end in blue, offset in orange, arm in purple and interarm regions in yellow. Finally, we averaged the velocity-axis aligned spectra with equal weights and obtained a stacked spectrum in each region.
3 Results
| Line | 12CO | 12CO | 13CO | 13CO | |
|---|---|---|---|---|---|
| VA procedure | no | yes | no | yes | |
| Center | |||||
| (K km s-1) | (36)∗∗\ast∗∗\astThe signal-to-noise ratios of and are shown in the round bracket after each value. | (32) | (6) | (10) | |
| FWHM∗∗∗∗\ast\ast∗∗∗∗\ast\astThe FWHM is estimated with Gaussian fitting. (km s-1) | |||||
| (mK) | (15) | (15) | (4) | (5) | |
| Bar | |||||
| (K km s-1) | (29) | (28) | (5) | (16) | |
| FWHM (km s-1) | – | ||||
| (mK) | (14) | (17) | (3) | (12) | |
| Bar-end | |||||
| (K km s-1) | (36) | (74) | (16) | (33) | |
| FWHM (km s-1) | , ∗∗∗∗∗∗\ast\ast\ast∗∗∗∗∗∗\ast\ast\ast For the stacking results without the VA procedure in the bar-end region, the FWHM and values of the two velocity components in the spectra are shown separately. | , | |||
| (mK) | (15), (15) | (44) | (7), (8) | (22) | |
| Offset | |||||
| (K km s-1) | (19) | (23) | (6) | (7) | |
| FWHM (km s-1) | |||||
| (mK) | (14) | (17) | (6) | (6) | |
| Arm | |||||
| (K km s-1) | (31) | (51) | (8) | (19) | |
| FWHM (km s-1) | |||||
| (mK) | (12) | (36) | (4) | (15) | |
| Interarm | |||||
| (K km s-1) | (25) | (20) | (4) | (7) | |
| FWHM (km s-1) | |||||
| (mK) | (9) | (10) | (2) | (5) |
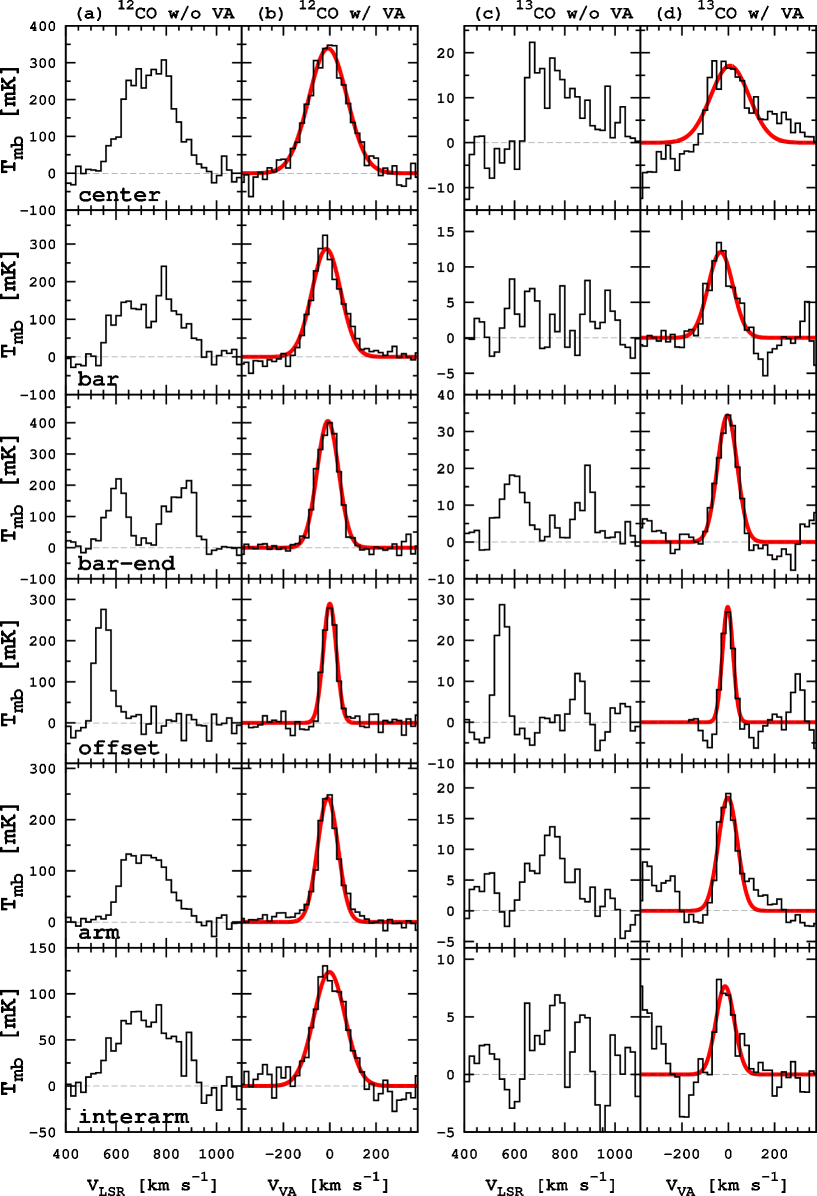
The stacked spectra with and without the VA procedure of 12CO and 13CO are shown in figure 2. The spectra are binned so that the velocity resolution matches that of the spectra (i.e., 20 km s-1). The smoothed 12CO spectra are employed for the following analysis. The r.m.s. noise temperatures of the stacked 12CO and 13CO spectra per km s-1 are typically reduced to mK and mK, respectively. The error of the listed in table 2 is the r.m.s. noise temperature, which is calculated within a narrow velocity range outside the emission line. This is because we must calculate the r.m.s. noise temperature within the baseline range in which the same number of data are stacked as the emission line range. The number of the stacked data is getting small as the velocity offset from the line center is large. In table 2, some errors of and of the stacked spectra with VA are slightly larger than those of the stacked spectra without VA. This may be partly attributed to the poor statistics in estimation of the r.m.s. noise temperature.
The increase of the peak temperature and the reduction of noise level by the stacking analysis after the VA procedure allow us to detect 13CO emission even from the interarm region with S/N of 5 where the emission was not detected in the spectrum of each pixel in the original data or in the stacked spectrum without the VA procedure (S/N ). The fitting results with a Gaussian for the stacked spectra after the VA procedure are also plotted with red lines on each spectrum in figure 2. The integrated intensity (), full width at half maximum (FWHM) and the peak temperature () of 12CO and 13CO with and without the VA procedure in different regions of NGC 3627 are shown in table 2. Although the line profiles of the stacked spectra, especially the one without the VA procedure, do not look like a Gaussian, the FWHM and its error are determined by a Gaussian fitting and the fitting error, respectively. If the FWHM is calculated literally as the width at the half of the peak intensity, the derived FWHM is more susceptible to the r.m.s. noise temperature than the one from global fitting. In table 2, we also separately present the FWHM and values of the two velocity components in the bar-end spectrum obtained without the VA procedure.
The validity of this method is examined by comparing the integrated intensity of the stacked spectra with and without the VA procedure. Both spectra obtained with and without the VA procedure are the averaged spectra in each region. Therefore, the integrated intensity estimated in both ways should be the same. In table 2, we see that the two values of each region are almost the same within the error, confirming the validity of the stacking method with the VA procedure. Moreover the S/N of of each spectrum is improved by a factor of up to 3.2.
4 Analyses
4.1 Surface density of molecular gas mass
We estimate the surface density of molecular gas mass in the six regions of NGC 3627 from the 12CO and 13CO spectra. and estimated from Gaussian fitting are used for the calculation hereafter, since the line profiles of the stacked spectra after the VA procedure are well fitted with a Gaussian (see figure 2)555 The 13CO emission line of the stacked spectra in the center region has a bluewards wing that is not seen in 12CO spectra with higher S/N than 13CO. Therefore the wing is not expected to be a realistic feature but a wrong feature due to bad baselines of 13CO spectra. The Gaussian fitting is not expected to be severely affected by this feature, because the FWHM of 13CO is consistent with the one of 12CO within the margin of error. . The integrated intensities estimated with a Gaussian fitting agree with the values listed in table 2 within the margin of error. The column density of H2, (cm-2), for extragalactic objects is commonly estimated from with a CO-to-H2 conversion factor, (cm-2 [K km ]-1) under the premise that 12CO is optically thick. If 12CO is optically thick, the brightness temperature is not mainly related to the column density of gas but to the excitation temperature of the surface of the virialized molecular clouds (Bolatto et al., 2013). is described as
| (3) |
We can also estimate from the column density of 13CO, as long as the 13CO emission is optically thin. Under the local thermal equilibrium (LTE) approximation, can be calculated as
| (4) |
where is the Boltzmann constant, is the dipole moment of esu cm, is the Planck constant, is the rest-frame frequency of 13CO, is the rotational quantum number of lower energy state and is the kinetic temperature. We obtain by assuming an ratio of (Frerking et al., 1982) and K.
It is useful to estimate a lower limit of by assuming that the 12CO line has a small optical depth (). The minimum H2 column density is calculated in the same manner as equation (4) with . We obtain with ratio of (Young & Scoville, 1991) and K. We utilize this conversion factor in the discussion in section 5.
The surface density of the molecular gas, is calculated as,
| (5) |
where 1.36 is a factor to account for the contribution of He by mass, is the mass of the hydrogen atom and is the inclination of NGC 3627 (). Then we can obtain the surface density of the molecular gas for the case of optically thick 12CO emission as,
| (6) |
for the case of optically thin 13CO emission as,
| (7) |
and for the case of optically thin 12CO emission as,
| (8) |
where , and are the surface densities of molecular gas estimated from 12CO (optically thick), 13CO (optically thin) and 12CO (optically thin), respectively. We adopt of cm-2 (Nakai & Kuno, 1995). The , , and ratios in all the regions are shown in table 3.
In table 3, there is a wide variety in ratios among the six regions. Here we focus on the relative difference of the ratios among different regions rather than the discrepancy between and in each region. The errors of in table 3 are calculated only from the errors of the integrated intensities. However, the values calculated here implicitly include the following assumptions; 1) the observed molecular clouds mainly consists of H2 molecules, are virialized, follow the size-line width relation and have constant temperature and the 12CO emission from them is optically thick (for the constant CO-to-H2 conversion factor), 2) the kinetic temperature and the abundance ratios of 13CO to H2 are free parameters (for the LTE assumption). In particular, the coefficient in equation (7) varies from 6.16 to 25.1 for and K, respectively.
We estimate from the comparison between and by assuming that both 12CO and 13CO emissions are radiated from the same region, the abundance ratios of 13CO to H2 do not vary within the galaxy, and the estimated value of with is correct. In table 3, we can see that the ratios in the center, bar and interarm regions are while those in the other regions are as small as . We obtain K for the center, K for the bar, K for the interarm, and K for the other regions. Galametz et al. (2012) derived the dust temperature distribution of NGC 3627 with a grid size of , which corresponds to half of the effective spatial resolution of . They found a radial temperature gradient declining from K to K from their SED fitting using the dust temperature and emissivity index as free parameters (figure 4 of Galametz et al. (2012)). In their plot, the highest temperature ( K) is found in the center and the bar-end regions and the lowest values are seen in the interarm region ( K). In the center region, which contains nuclear starburst and active galactic nuclei (Krips et al., 2008), the high ratio may be partly attributed to the high although the averaged temperature of K over the 800-pc beam is too high. However, it is quite unlikely that the temperatures of the molecular gas in the bar and interarm regions are higher than the arm, bar-end and offset regions where stars are actively forming. Therefore, the high ratios in the bar and the interarm regions are likely attributed to the overestimation of estimated with and a constant CO-to-H2 conversion factor. We compare the 12CO and 13CO spectra of each region in the following subsections to physically explain the high ratios in the bar and interarm regions.
| Center | Bar | Bar-end | Offset | Arm | Interarm | |
|---|---|---|---|---|---|---|
| ( pc | ||||||
| ∗∗\ast∗∗\ast is estimated with . ( pc-2) | ||||||
| ∗∗\ast∗∗\ast is estimated with . ( pc-2) | ||||||
| ∗∗∗∗\ast\ast∗∗∗∗\ast\ast ratio is also shown. |
4.2 Integrated intensity, FWHM, and peak temperature ratios of the 12CO and 13CO spectra
We show the /, FWHM/FWHM and ratios in table 4. We find for the first time that the / ratio in the interarm region is almost twice as high as those in the bar-end, offset and arm regions. The high ratios in the bar and center regions reported in W11 are confirmed by the stacking analysis. The / ratios obtained in the bar-end, offset and arm regions are consistent with the values obtained in Paglione et al. (2001) where they observed 17 nearby galaxies in 12CO and 13CO along the major axes and obtained the ratios of ( spatial resolution). The bar region shows a higher value of than the other regions () and the center region shows an intermediate value between them ().
It is noteworthy that the FWHM/FWHM ratio in the interarm region is whereas the other regions have almost unity. In other words, the line width of 12CO is larger than that of 13CO in the interarm region. To investigate local effects on this trend, we separate the interarm region into Northeastern (NE) and Southwestern (SW) parts, produce the averaged spectra in each part, measure the FWHM ratios, and check whether this trend still holds or not. Their FWHM estimated with Gaussian fitting are presented in table 5. Although the S/N (the peak temperature-to-noise ratio) of the data is not so high (), the trend that FWHM of 12CO is larger than that of 13CO still exists. The FWHM ratios that are estimated with NE and SW interarm spectra separately are consistent with the interarm ratio of within the margin of error. Thus we conclude that the difference in FWHM between the 12CO and 13CO spectra is a characteristic feature in the interarm region of NGC 3627 rather than any local feature, which has nothing to do with the galactic structures.
| Center | Bar | Bar-end | Offset | Arm | Interarm | |
|---|---|---|---|---|---|---|
| / | ||||||
| FWHM/FWHM | ||||||
| FWHM | FWHM | FWHM/FWHM | |
|---|---|---|---|
| (km s-1) | (km s-1) | ||
| All | |||
| Northern-East | |||
| Southern-West |
4.2.1 The radial trends of /, FWHM/FWHM and /
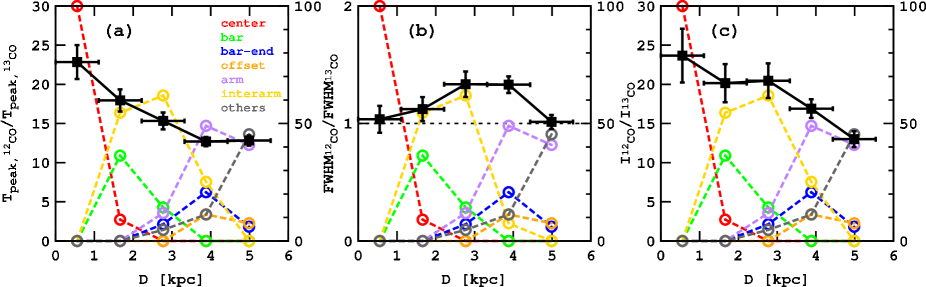
Each region has a different mean galactocentric distance and therefore the variations in /, FWHM/FWHM and / found in the previous section may be attributed to a radial trend. To investigate the radial gradient of /, FWHM/FWHM and /, we produced the stacked spectra of 12CO and 13CO in five concentric annuli (r1r5, from the galaxy center) with a width of kpc in the galactic plane. The fitting results with a Gaussian to the stacked spectra after the VA procedure of the five annuli are summarized in table 6. The radial profiles of the /, FWHM/FWHM and / ratios are shown in figure 3 with black lines. In these plots, we also show the fraction of the number of pixels of each six morphologically defined regions included in a concentric annulus to the total number of pixels in each annulus. The colors of these lines are the same as the six regions in figure 1. Grey points and lines (“others”) represent the area which is not categorized in the (1)(6) regions but included in the concentric annuli.
We find a radial gradient in the ratio plot (figure 3a) and a weak gradient in the / ratio plot (figure 3c). The radial gradient of / reported in W11 is confirmed with the data obtained with the stacking analysis. The and the / ratios tend to be higher at smaller galactocentric distance (kpc) while we found the highest values of both ratios in the bar and interarm regions outside r1. In figure 3b, we do not see any systematic radial gradient in the FWHM/FWHM plot but there is a bump at r2r4. This radial range contains the interarm region and the highest contribution from the interarm region is found in r2r3. Additionally, the FWHM/FWHM ratios at the bump () are smaller than those of the interarm region (). Hence, we conclude that the high FWHM/FWHM ratios at r2r4 are due to the inclusion of the interarm region. Accordingly, the differences seen in the /, FWHM/FWHM and / ratios in the morphologically defined regions do not represent the radial trends of these ratios.
| Line | 12CO | 13CO | 12CO/13CO |
|---|---|---|---|
| r1: (kpc) | |||
| (K km s-1) | |||
| FWHM (km s-1) | |||
| (mK) | |||
| r2: (kpc) | |||
| (K km s-1) | |||
| FWHM (km s-1) | |||
| (mK) | |||
| r3: (kpc) | |||
| (K km s-1) | |||
| FWHM (km s-1) | |||
| (mK) | |||
| r4: (kpc) | |||
| (K km s-1) | |||
| FWHM (km s-1) | |||
| (mK) | |||
| r5: (kpc) | |||
| (K km s-1) | |||
| FWHM (km s-1) | |||
| (mK) |
4.3 The intensity ratios of in the different regions
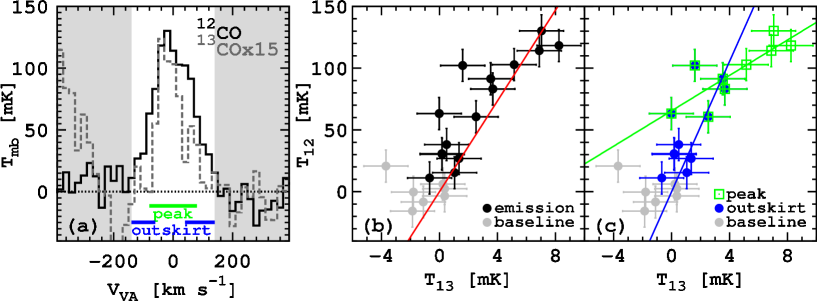
We compare the and spectra in each region in figure 4. Column (a) of this figure is 12CO and 13CO spectra multiplied by a fixed value of for the comparison of the heights of the 12CO and the 13CO emission lines in each different region. Column (b) shows the 12CO and the rescaled 13CO spectra, which are matched at the peak of the 12CO. This is done to compare the widths of the 12CO and the 13CO emission lines. The emission ranges of the spectra are indicated as the unshaded regions and the baseline range are indicated as the shaded regions in the column (a) and (b). Hereafter we refer to them as the “emission” and “baseline” ranges, respectively. In column (c) of this figure, we plot the of 12CO versus 13CO for all the velocity channels in each region. Grey and black points in this plot represent the data points of the “baseline” and “emission” ranges of the spectra. The linear fitting results of the data within the “emission” range (black-filled circles) are also shown in red solid lines. They are fitted so as to cross the origin.
Column (a) in figure 4 visually confirms that the 12CO spectra of the center, bar and interarm regions are still much higher than CO, unlike those in the three other regions. This difference is quantitatively expressed by different slopes of the fitting lines in column (c) in figure 4. The slope of 22.7 in the bar region is almost twice as high as those in the bar-end, offset and arm regions () and those in the center and interarm regions show the intermediate value () between them.
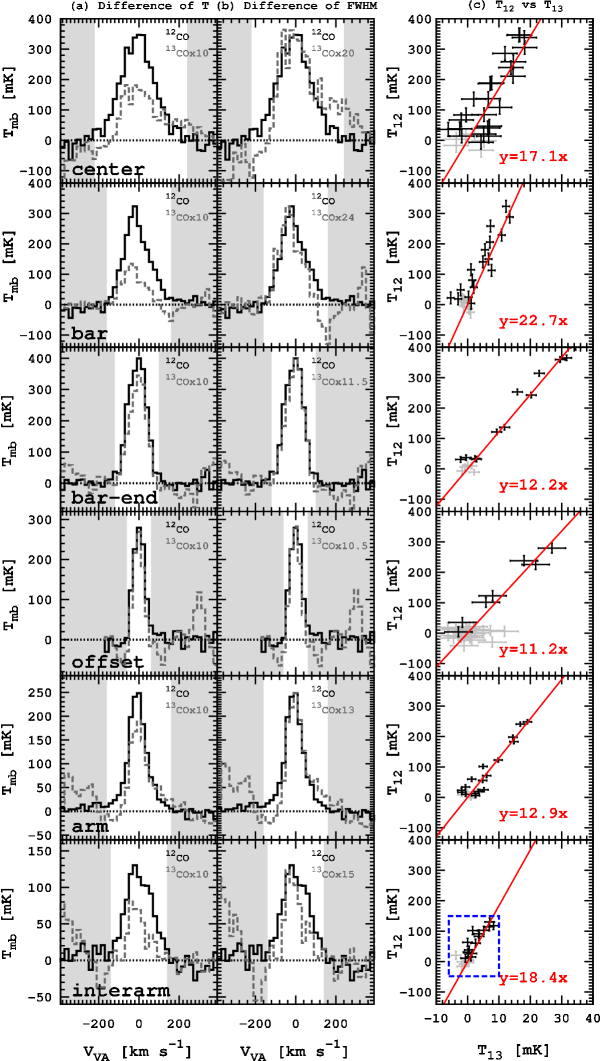
The most notable result in this study is that the width of the 12CO emission line is larger than that of 13CO in the interarm region whereas both lines in the other regions have comparable widths (column (b) in 4). We separate the “emission” range of the interarm spectra into the “peak” and the “outskirt” ranges that are indicated with blue and green horizontal lines in figure 5a. In figure 5b, we show a magnified plot of the dotted rectangle region of figure 4c. Figure 5c is the same as figure 5b, but the data points of the “peak” and the “outskirt” ranges of the spectra are indicated as blue and green points, respectively. The blue and green solid lines represent the linear fitting results of the data within the “outskirt” and the “peak” points.
In figure 5c, there are distinct spectral features of 1) a large gradient () at 3 mK and 2) a small gradient () at 3 mK. The two slopes are significantly different taking into account the error. This result suggests that there are two gas components with different velocity widths and the component with a broader line width has the highest ratio of among all the regions.
4.4 Brief summary of the analyses
The surface densities of molecular gas were calculated with the 12CO and 13CO spectra in the six regions of NGC 3627. We found that the bar and interarm regions have higher , i.e., than the other regions. The ratio in the bar region is high because the ratios are fairly high () within the velocity range of the emission line. For the case of the interarm region, the high ratio is attributed to the broader line width of the 12CO spectra compared to the 13CO spectra. The difference of the FWHM of 12CO and 13CO suggests the existence of two molecular gas components with different FWHM in the interarm region. ratio of the gas component with broader FWHM in the interarm region is higher than the other regions.
5 Discussion
A new and the most important result of our study is that the in the interarm region is high due to broader FWHM than FWHM. The obtained spectra in this study are the emissions from an ensemble of giant molecular clouds (GMCs), giant molecular associations (GMAs) and/or the ambient components, since the typical sizes of those structures are pc (GMCs) and pc (GMAs), which are much smaller than the beam size of pc. Therefore, the observed FWHM of the 12CO and 13CO spectra are likely to represent not a random motion within a cloud but a random motion between clouds since the FWHM of the former ( km s-1, Sanders et al. (1985); Scoville et al. (1987); Solomon et al. (1987)) is much smaller than that of the latter. If the molecular gas (or clouds) within a beam has almost the same 12CO to 13CO intensity ratio in each velocity channel, the FWHM of the spectra of the 12CO and 13CO lines are expected to be almost the same. This is the case for every region except for the interarm region. The different FWHM between the 12CO and 13CO lines in the interarm region is hardly explained by the ensemble of molecular gas with uniform physical states within a beam. We discuss the physical conditions of molecular gas in each region of NGC 3627 in the following subsections.
5.1 Differences in the physical states of molecular gas among different regions
The brightness temperature of line radiation, , under the assumption of local thermal equilibrium (LTE), is described as
| (9) |
where is the beam-filling factor, is the Plank function , where is the speed of light), is the excitation temperature and equals the kinetic temperature under LTE conditions, is the temperature of the cosmic microwave background ( K) and is the optical depth. Under the assumptions that 1) both 12CO and 13CO lines are emitted from the same cloud (same for 12CO and 13CO), and 2) both molecules are thermalized (same for 12CO and 13CO), the line ratio of can be described as a function of the optical depth of 12CO as,
| (10) |
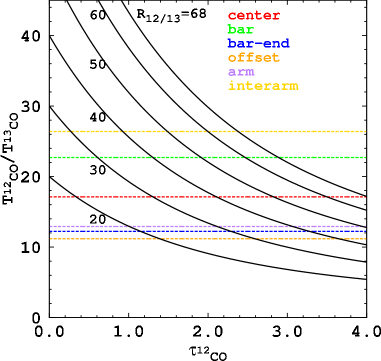
where is the abundance ratio of 12C and 13C. can be used as a proxy for the ratio as long as the isotope fractionation is negligible666 To be precise, the ratio may be affected by the isotope fractionation in response to the competing processes of the isotope exchange reaction (Watson et al., 1976; Smith & Adams, 1980) and the selective dissociation (Bally & Langer, 1982; van Dishoeck et al., 1988; Kopp et al., 1996). . The ratio as a function of is shown in figure 6. According to the equation (10), a larger gives us a lower with a fixed and a lower gives us a lower . Milam et al. (2005) showed a radial dependence of of our Galaxy as
| (11) |
where is the galactocentric distance in kpc. With an assumption that the profile of the emission line is expressed by a Gaussian function, the optical depth of the 13CO line can be described as
| (12) |
where is the column density of 12CO and is the line width. If , the optical depth can be described as
| (13) |
Therefore, ratio is a function of , and as well as .
We can estimate the from the ratios of each region, if we assume that the dependence on the galactocentric distance of NGC 3627 is the same as that of the Galaxy. In table 7, the ratios estimated by linear fitting in figures 4 and 5, radial extents, expected and of each region are presented. The ratios of each region are overplotted on the plot in figure 6.
Figure 6 and table 7 indicate the variety of among different regions in NGC 3627. The bar-end, offset and arm regions seem to have high values of larger than . On the other hand, in the center region, bar region and of the larger FWHM component in the interarm region are expected to be , and , respectively. If we adopt the local interstellar medium value of (Milam et al., 2005), the optical depths in these three regions are expected to be , and . Therefore, the higher ratios in the center, bar, and interarm regions are likely due to the lower optical depth of 12CO than the other regions as far as we assume the Galactic .
5.1.1 The cause of the low in the bar and center regions
According to equation (13), the ratio is a function of , , and . The physical states of molecular gas in the bar and center regions are discussed in W11. They concluded that the higher value of in the center and bar regions are due to differences in the environments: the high , which is due to the starburst or nuclear activity in the center region, and the low , which is due to a streaming motion in the bar region. The moderate value of in the central region has also been reported in the study of our Galaxy (Oka et al., 1998).
5.1.2 The possible origin of the low gas component in the interarm region
The previous studies of GMCs in the Milky Way and in the extragalactic objects have proposed an evolution scenario of GMCs in a galactic disk. Sawada et al. (2012a) investigated the structure and physical conditions of molecular gas in the Milky Way including the arm and interarm regions using data taken with the 45-m telescope at NRO (spatial resolution of pc). They concluded that when faint and diffuse molecular gas in the interarm region enters the spiral arm, this gas develops bright and compact structures at the arm and once the gas leaves the arms, it returns to a diffuse state (Sawada et al., 2012b). Koda et al. (2009) utilized CARMA data of M 51 (spatial resolution of pc) and showed that molecular clouds with mass of are found only in the arm region while one with can be found in the interarm as well as arm regions. They claimed that massive clouds that are accumulated in the arm region are not fully dissociated into atomic gas, but dissolved into small clouds as they pass through the arm due to the shear motion in the interarm region. Recently, Colombo et al. (2014) confirmed the results of Koda et al. (2009) quantitatively with a large number of GMC samples of M 51 (spatial resolution of pc) by comparing the mass function of GMC in different regions. However, these extragalactic studies mainly treat individual and discrete clouds and might miss the diffuse and extended objects.
Our result suggests the existence of diffuse non-optically thick 12CO component () in the interarm region. This is consistent with the conclusion given in Sawada et al. (2012a; 2012b) although they did not analyze the optical depth of the “diffuse” component. Polk et al. (1988) also reported that a significant contribution to the large-scale CO emission from the Galaxy is made by diffuse gas, which is indicated from the extremely high ratio of (Knapp & Bowers, 1988). The diffuse component observed in our study might be a result of the dissolution of massive molecular clouds in the interarm region, as suggested by Koda et al. (2009) and Colombo et al. (2014). Relatively low 12CO optical depth of the interarm region may be a result of low due to a shear motion. Therefore, it is possible that GMCs formed at the arm are dissolved into smaller GMCs and diffuse molecular component in the interarm regions. This picture is consistent with the prediction from a recent numerical simulation of gas component under spiral potential in a disk galaxy (Dobbs & Pringle, 2013). Some of the GMCs at the arm may be dissociated into atomic gas in the interarm region by star-formation feedback (e.g., Dobbs et al. (2006)). However, a detailed understanding of the mechanism of dissolution of GMC or dissociation of molecular gas requires molecular and atomic gas observations in high resolution and sensitivity with Atacama Large Millimeter/submillimeter Array (ALMA) and Square Kilometer Array (SKA).
There may be a contribution of the bar structure on the low value in the interarm region, since the interarm region that we define in this study includes the neighboring areas on the sides of the bar region. The bar consists of a lot of characteristic orbits of stars and one of the most prominent orbits is called the x1 orbit, which shapes the elongated structure. Since the gas component has viscosity contrary to stars, its orbit around the bar structure deviates from the sequence of x1 orbits of the stellar components. Wada (1994) provided an analytical model for the orbits of gas component in the bar-structure, damped orbit model. In his model, some gas orbits in the bar, especially at the dust lane, gradually deviate from the bar region (for example, see figure 10 of Sakamoto et al. (1999)). Hence, some gas components orbiting the bar structure may be categorized in this study as interarm gas components. Furthermore, the orbits which are crowded at the bar-end region become sparse on the sides of the bar region. The gap between orbits widens, perhaps reducing and consequently decreasing on the sides of the bar. Unfortunately, no study so far has investigated this effect in detail. The investigation of this effect is an issue for a future paper.
5.2 Non-universal CO-to-H2 conversion factor in a galaxy?
Most previous studies of nearby galaxies have adopted a universal conversion factor for the entire galaxy and investigated the distribution of molecular gas and star-formation efficiency (SFE), which is determined as a ratio of star-formation rate and molecular gas mass (e.g., Helfer et al. (2003); Kuno et al. (2007); Leroy et al. (2009)). Some studies claimed that the SFE in the bar region is lower than the other regions and suggested that intense phenomena such as a streaming motion inhibits star formation in the bar (e.g., Reynaud & Downs (1998)). W11 compared SFE obtained from the 12CO data and from 13CO data of NGC 3627 and concluded that SFE in the bar region is comparable to that of the arm region if 13CO data were used to estimate the molecular gas mass. A lower conversion factor in the bar region than the other disk regions is also suggested in the 12CO data of Maffei II combined with an LVG (large velocity gradient) analysis (Sorai et al., 2012).
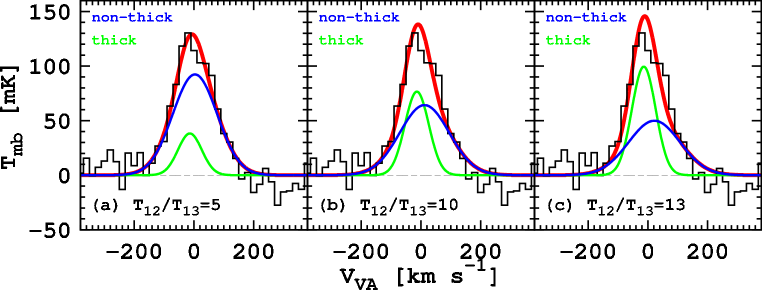
In this study, we detect 13CO emission from the interarm region of NGC 3627 for the first time and find 12CO component with a broad line width and high ratio indicating non-optically thickness. It is difficult to estimate the molecular gas mass in the interarm region only with 13CO since a part of the molecular gas in the interarm region is expected to be too diffuse to emit 13CO emission. To infer the impact of the non-optically thick 12CO component on the observed 12CO integrated intensity and the CO-to-H2 conversion factor, we use the stacked 12CO spectrum to estimate the fraction of the emission from the diffuse component and the molecular gas mass in the interarm region.
We decomposed the 12CO spectra with two Gaussians for 12CO optically thick and non-optically thick components. For the optically-thick component, we adopted the center velocity of km s-1 and the FWHM of km s-1 from the Gaussian fitting results of the 13CO spectra and assumed three cases of of = 5, 10 and 13. The ratios are determined by reference to the typical ratio of the Galactic GMCs of (Solomon et al., 1979; Polk et al., 1988) and the values which we found in the bar-end, offset and arm regions of NGC 3627. As a result, the fractions of the non-optically thick 12CO emission with respect to the total 12CO flux, are %, %, and % if we assume = 5, 10 and 13, respectively. The fitting results for these three cases are shown in figure 7 and summarized in table 8.
The surface density of the molecular gas in the interarm region is described with integrated intensities of the optically thick and thin components, and using equation (6) and (8) as777 It is reported that in the diffuse gas is smaller than the one in the GMCs from the CO-absorption observations (Sonnentrucker et al., 2007; Liszt, 2007; Burgh et al., 2007; Shetty et al., 2008). However, the values reported in those studies have a large dispersion (). Therefore we adopt the GMC value of (Young & Scoville, 1991) throughout this paper.
| (14) |
We obtain the surface densities of pc-2 ( = 5), pc-2 (10) and pc-2 (13), which are significantly lower than the one calculated by assuming all 12CO emission is optically thick by factors of , and , respectively. Here we assume and K. It should be noted that this is an extreme case where the non-optically thick component is optically thin () so these factors set only the upper limits.
A radial gradient of in nearby galaxies has been investigated observationally, but the consensus has not been obtained (Sandstrom et al., 2013; Blanc et al., 2013). Blanc et al. (2013) investigated the dependence of of NGC 628 on the metallicity, gas surface density, and UV radiation field, which all affect the balance between the shielding and dissociation of CO molecule in the photodissociation regions on the edge of molecular clouds.
The conversion factor is expected to vary according to not only the radiative transfer of UV between the star-forming region and the subjected clouds in the galaxy but also the radiative transfer of 12CO between the clouds and us. The previous studies have mainly focused on the factors that affect the former radiative transfer and investigated the dependence of on the metallicity, gas surface density, and UV radiation field. Here we show that the optical depth of 12CO that influences the latter radiative transfer may be different in the different regions in NGC 3627, resulting in the different conversion factor. We need careful consideration and treatment when we estimate the molecular gas mass not only in the region with quite different metallicity, ISM density and UV radiation field but also in the region where 12CO is not expected to be optically thick. Accurate estimation of the molecular gas mass is also important to evaluate other physical parameters of galaxies such as SFE.
| (mK) | (K km s-1) | (K km s-1) | (%) | |
|---|---|---|---|---|
| 5 | ||||
| 10 | ||||
| 13 |
6 Summary
We obtained the averaged spectra of 12CO and 13CO in the center, bar, bar-end, offset, arm and interarm regions of NGC 3627 with the stacking analysis after the velocity-axis alignment (VA) procedure according to the velocity field estimated from the 12CO mapping data. The 13CO spectrum in the interarm region of NGC 3627 where the emission does not have enough S/N in the original data was successfully detected. Main results of this paper are as follows:
- 1.
- 2.
-
3.
The integrated intensity ratios in the bar and interarm regions are almost two times higher than those in the other regions. in the center region is the intermediate value between them. High values of in the bar and center regions are attributed to the higher intensity ratios () and one in the interarm regions is attributed to the higher FWHMFWHM ratio than the other regions. The difference in the line width between 12CO and 13CO suggests two gas components, one with a narrow ( FWHM) and the other with a broad line width ( FWHM) in the interarm region (tables 4 and 5 of section 4.2).
- 4.
- 5.
-
6.
The existence of non-optically thick component of 12CO in the center, bar, and interarm regions indicates a lower CO-to-H2 conversion factor compared to the other regions. It is necessary to take into account the non-universal conversion factor in a galaxy in case of comparing the molecular gas distribution and SFE in the different regions. Otherwise, the molecular gas mass and SFE may be respectively overestimated and underestimated by factors of a few in case of the interarm region of NGC 3627 (section 5.2).
We would like to thank an anonymous referee for very productive comments. KMM thanks Shuuro Takano, Tetsuhiro Minamidani, Tomoki Morokuma, Junichi Baba, Daisuke Iono, Jin Koda and all members of NRO for their support and fruitful discussions.
This research has made use of the NASA/ IPAC Infrared Science Archive, which is operated by the Jet Propulsion Laboratory, California Institute of Technology, under contract with the National Aeronautics and Space Administration.
References
- Bally & Langer (1982) Bally J. & Langer W. D., 1982, ApJ, 255, 143
- Blanc et al. (2013) Blanc G. A. et al., 2013, ApJ, 764, 117
- Bolatto et al. (2013) Bolatto A. D. et al., 2013, ARA&A, 51, 207
- Burgh et al. (2007) Burgh E. B. et al., 2007, ApJ, 658, 446
- Colombo et al. (2014) Colombo D. et al., 2014, ApJ, 784, 3
- de Vaucouleurs et al. (1991) de Vaucouleurs G. et al., 1991, Third Reference Catalogue of Bright Galaxies. Volume I: Explanations and references. Volume II: Data for galaxies between 0h and 12h. Volume III: Data for galaxies between 12h and 24h.
- Dobbs et al. (2006) Dobbs, C. L. et al., 2006, MNRAS, 371, 1663
- Dobbs & Pringle (2013) Dobbs, C. L. & Pringle J. E., 2013, MNRAS, 432, 653
- Egusa et al. (2011) Egusa, F. et al., 2011, ApJ, 726, 85
- Fujimoto (1968) Fujimoto, M, 1968, in IAU Symp. 29, Non-stable Phenomena in Galaxies, (Yerevan: The Publishing House of the Academy of Sciences of Armenian SSR), 453
- Frerking et al. (1982) Frerking M. A. et al., 1982, ApJ, 262, 590
- Galametz et al. (2012) Galametz M. et al., 2012, MNRAS, 425, 763
- Haynes et al. (1979) Haynes M. P. et al., 1979, ApJ, 229, 83
- Helfer et al. (2003) Helfer T. T. et al., 2003, ApJS, 145, 259
- Hirota et al. (2010) Hirota A. et al., 2010, PASJ, 62, 1261
- Hüttemeister et al. (2000) Hüttemeister S. et al., 2000, A&A, 363, 93
- Kennicutt et al. (2003) Kennicutt R. C. Jr. et al., 2003, PASP, 115, 928
- Knapp & Bowers (1988) Knapp G. R. & Bowers P. F., 1988, ApJ, 331, 974
- Koda et al. (2009) Koda J. et al., 2009, ApJ, 700, L132
- Kopp et al. (1996) Kopp M. et al., 1996, A&A, 305, 558
- Krips et al. (2008) Krips M. et al., 2008, ApJ, 677, 262
- Kuno et al. (2007) Kuno N. et al., 2007, PASJ, 59, 117 (K07)
- Langer & Penzias (1990) Langer W. D. & Penzias A. A., 1990, ApJ, 357, 477
- Leroy et al. (2009) Leroy A. K. et al., 2009, AJ, 137, 4670
- Liszt (2007) Liszt H. S., 2007, A&A, 476, 291
- Meier & Turner (2004) Meier D. S. & TurnerJ. L., 2004, AJ, 127, 2069
- Milam et al. (2005) Milam S. N. at al., 2005, ApJ, 634, 1126
- Nakai & Kuno (1995) Nakai N. & Kuno N., 1995, PASJ, 47, 761
- Oka et al. (1998) Oka T. et al., 1998, ApJS, 118, 455
- Polk et al. (1988) Polk K. S. et al., 1988, ApJ, 332, 432
- Reynaud & Downs (1998) Reynaud D. & Down D., 1998, A&A, 337, 671
- Roberts (1969) Roberts, W. W. 1969, ApJ, 158, 123
- Paglione et al. (2001) Paglione T. A. D. et al., 2001, ApJS, 135, 183
- Saha et al. (1999) Saha A. et al., 1999, ApJ, 522, 802
- Sakamoto et al. (1999) Sakamoto K. et al., 1999, ApJS, 124, 403
- Sawada et al. (2012a) Sawada T. et al., 2012a, ApJ, 752, 118
- Sawada et al. (2012b) Sawada T. et al., 2012b, ApJ, 759, 26
- Sanders et al. (1985) Sanders D. B. et al., 1985, ApJ, 289, 373
- Sandstrom et al. (2013) Sandstrom K. M. et al., 2013, ApJ, 777, 5
- Schruba et al. (2011) Schruba A. et al., 2011, AJ, 142, 37
- Schruba et al. (2012) Schruba A. et al., 2012, AJ, 143, 138
- Scoville et al. (1987) Scoville N. Z. et al., 1987, ApJS, 63, 821
- Shetty et al. (2008) Shetty Y. et al., 2008, ApJ, 687, 1075
- Smith & Adams (1980) Smith D. & Adams N. G., 1980, ApJ, 242, 424
- Sonnentrucker et al. (2007) Sonnentrucker P. et al., 2007, ApJS, 168, 58
- Sorai et al. (2000) Sorai K. et al., 2000, Proc. SPIE, 4015, 86
- Sorai et al. (2012) Sorai K. et al., 2012, PASJ, 64, 51
- Solomon et al. (1979) Solomon P. M. et al., 1979, ApJ, 232, 89
- Solomon et al. (1987) Solomon P. M. et al., 1987, ApJ, 319, 730
- Solomon et al. (1997) Solomon P. M. et al., 1997, ApJ, 478, 144
- van Dishoeck et al. (1988) van Dishoeck E. F. et al., 1988, ApJ, 334, 771
- Tosaki et al. (2002) Tosaki T. et al., 2002, PASJ, 54, 209
- Wada (1994) Wada K., 1994, PASJ, 165, 172
- Watanabe et al. (2011) Watanabe Y. et al., 2011, MNRAS, 411, 1409 (W11)
- Watson et al. (1976) Watson W. D. et al., 1976, ApJ, 205, 165
- Young & Scoville (1991) Young J. S. & Scoville N. Z. et al., 1991, ARA&A, 29, 581
- Zhang et al. (1993) Zhang X. et al., 1993, ApJ, 418, 100