79011 Lviv, Ukraine
Applied Mathematics Research Centre, Coventry University, Coventry, CV1 5FB, England
Science and society Social and economic systems Complex systems
Is your EPL attractive? Classification of publications through download statistics
Abstract
Here we consider the download statistics of EPL publications. We find that papers in the journal are characterised by fast accumulations of downloads during the first couple of months after publication, followed by slower rates thereafter, behaviour which can be represented by a model with predictive power. We also find that individual papers can be classified in various ways, allowing us to compare categories for open-access and non-open-access papers. For example, for the latter publications, which comprise the bulk of EPL papers, a small proportion (2%) display intense bursts of download activity, possibly following an extended period of less remarkable behaviour. About 18% have an especially high degree of attractiveness over and above what is typical for the journal. One can also classify the ageing of attractiveness by examining download half-lives. Approximately 18% have strong interest initially, waning in time. A further 20% exhibit “delayed recognition” with relatively late spurs in download activity. Although open-access papers enjoy more downloads on average, the proportions falling into each category are similar.
pacs:
01.75.+mpacs:
89.65.-spacs:
89.75.-k1 Introduction
The dissemination of scholarly research through publication in peer-reviewed journals lies at the heart of the academic process. Having one’s research peer reviewed and published is, however, only the start of the journey to academic recognition, even with journals of high repute. Increasingly, citation-based metrics have come to be used as indicators of the value of individual research papers and, indeed, of the calibre of their authors. Journals are also interested in measurements of performance and the use of impact factors is now ubiquitous. Citation-based estimates of individual papers, researchers and journals have become so important to scientists that, rather than leaving it entirely in the hands of scientometricians, managers and policy makers, many physicists have taken to investigate various aspects of measuring science themselves [1, 2, 3, 4, 5, 6, 7, 8, 9]. Besides these practical motivations for physicists to turn the scientific process on itself, there are also curiosity drivers, and performance data associated with scientific publications are amenable to physicists’ tools [3, 4]. Motivated by both practical considerations and by curiosity, then, we sought to investigate the download statistics of EPL. We targetted EPL as “Europe’s flagship letters journal” of broad interest to the physics community. An understanding of the downloading process here may deliver a viewpoint on the value of scientific outputs complementary to others in current use, in particular their attractiveness, and may inspire similar studies for other journals, leading to new ways to compare them.
2 Peer review, downloads and citations
The peer-review process is generally recognised by academics as the most reliable basis for evaluation of research [10]. While the strengths associated with expert judgement are documented, the process is not perfect and drawbacks include subjectivity of referees, bias and the fact that the process is labour intensive and time consuming [7, 10, 11, 12].
While citations are considered as indicators of academic impact, it is widely recognised that impact and research quality are not the same [8, 9]. The imperfections of citation counting are also well documented and include gratuitous citing; bias; citation inflation; retrieval issues; discipline traditions, and the fact that many cited papers are not read by citing authors [13, 14]. The long time lags which are necessary to accumulate numbers of citations represent another drawback. Despite all of these issues and more, the popularity of citation-based metrics amongst decision makers persists, because they deliver automatic, rapid and cheap information. These drawbacks have driven the search for alternative and complementary approaches.
There is a weak but positive correlation between citation and download numbers and undoubtedly some of the factors which limit other metrics as a measure also apply to downloads [15, 16, 17, 18, 19, 20]. Therefore, while downloads cannot be considered as a substitute for either citation-based or peer-review-based approaches, they can play a complementary role. While peer review and citations reflect opinion about a paper’s quality and scientific impact after reading, downloads rather reflect interest beforehand [16]. In other words, in addition to popularity and prestige [21], papers may be distinguished by their attractiveness. In such a classification, the overall number of citations measures popularity, the number of important citations [21] is evidence of prestige, whereas the number of downloads reflects the level of attractiveness of a publication. Here we wish to analyse download statistics to study attractiveness of EPL papers.
3 Download data
IOPscience is the online service for the journals of the Institute of Physics (IoP). We were provided with data on the full-text downloads for papers, published in EPL between January 2007 to June 2013 with one month resolution. The downloads are counted on an IP-address basis with multiple requests made from the same address considered as separate downloads. Only full-text downloads from the IOPscience web-pages are counted. The data are automatically cleansed of suspicious and robot activity, and are COUNTER compliant. For the purposes of our analysis, papers published online after the 25th day of a given month were allocated to the following month because of the small lag time for download accumulations. All EPL papers are freely downloadable for 2 months after online publication. The open access (OA) period can be extended in some cases and such papers have different download statistics as evidenced in Fig. 1. There is an increasing number of ways to download EPL articles without going through IOPscience, most notably from the arXiv and personal web-sites. In 2013, in particular, counts to all IOP hosted journals were down by about 10% on 2012 probably due to Google modifying their search algorithm in favour of articles that are not behind paywalls.
With these various aspects and caveats in mind, we proceed to report on our case study of the analysis of publications downloads and aging in EPL. Our data set comprises 4 986 non-OA papers and 377 OA papers. We use both synchronous and diachronous approaches [18]. The synchronous approach is calendar based, wherein Month 1 refers to January 2007, Month 2 to February 2007, and so on, with Month 78 referring to June 2013. The synchronous approach is appropriate to describe the downloading patterns of the entire journal as opposed to individual papers. The diachronous considers time since an individual paper’s publication. In this case, Month is article-specific and refers to the th month after the paper’s publication online. The diachronous approach therefore corresponds to download patterns for individual papers.
4 Synchronous approach
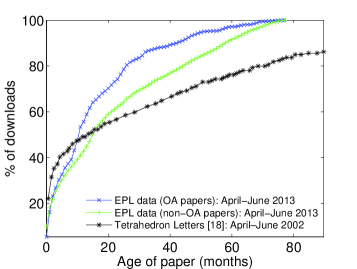
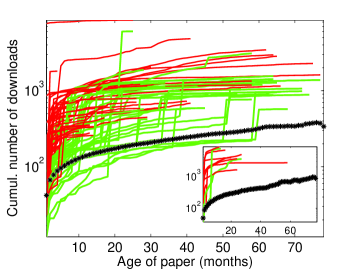
Since January 2007, an average of 64 papers have been published online in EPL each month. Following ref. [18], one can construct cumulative distribution curves by age, starting on given dates. The digitised version of Fig. 1 from ref. [18] which corresponds to download data for the journal Tetrahedron Letters [22] is presented in Fig. 1 along with the corresponding EPL data both for OA and non-OA papers downloaded during April–June 2013. Data labeled indicate that within given period of downloads were to papers months old or less. In ref. [18] a critical point of 3 months was identified, as a demarcation between two different regimes characterised by different slopes to the left and right of the Tetrahedron Letters curve (see also [16]). The difference was ascribed to recent publications being downloaded because of their novelty and older papers for archiving, background reading or similar. The slopes corresponding to the EPL curves do not change so dramatically, although softer transitions are evident. One may conjecture that the difference between the two journals could be caused by disciplinary peculiarities or different rules for access. (Tetrahedron Letters does not have an initial 2-month period of open-accessibility comparable to that of EPL.)
To understand the shape of the cumulative distributions depicted in Fig. 1, we consider the non-cumulative data in Fig. 2. Here we plot the density of downloads – defined as mean numbers of downloads per paper – against their age. Two different regimes are again distinguished; new papers attract more intense activity while after 5 or 6 months the download speed decreases. One may attribute the enhancing of download frequencies during the first few months to the novelty and free accessibility.
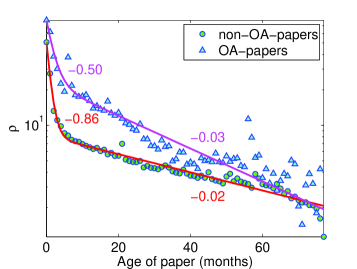
In order to fit to the two regions of Fig. 2, it is convenient to use a two-factor model [18]:
| (1) | |||
where and are relative weights of the two factors (two different motives for downloads) and is the density of downloads which corresponds to the newest papers (published in the month of downloading). The parameters and are exponential decay constants corresponding to early and later download patterns. Using nonlinear-curve least-squares fitting, we obtain the estimates for non-OA papers , , (parameters close to the estimates of [18] for Tetrahedron Letters: , , ). The corresponding estimations for OA papers are , , . Thus, the two regimes are observable for both data sets, but the slopes are different. The OA downloads are more concentrated on the first months after publication online.
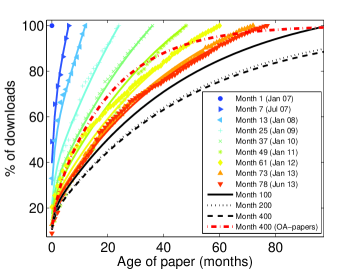
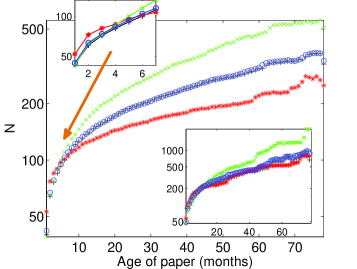
Fig. 3 is similar to Fig. 1 except (a) all the data refer to EPL and (b) the download windows (each of one month’s duration) vary, each period corresponding to a different colour (online). Since no particular seasonal effects were observed, of the 78 months for which we have data, only 10 representative months are depicted for the plot, for clarity. These are Month 1 (January 2007), Month 7 (July 2007) …Month 78 (June 2013) as listed in the figure. The cumulative curves, based on a two-factor model are indicated by solid lines. Downloads to papers during Month 1 (January 2007) can, of course, only be to papers which have appeared during that month, so the only data point has . At the other extreme, downloads during June 2013 can be to papers up to months old.
The plot in Fig. 3 can be used to determine ages of the papers required to provide a certain percentage of downloads within a particular month. For example, of non-OA downloads during January 2013 were to papers months old or less.
Our model also allows us to see the approach of the cumulative curves to a limiting distribution and the predictions of the model using extrapolated values for the and months are presented for non-OA papers. These can be compared to the predictions for OA papers, which are also shown in the figure.
This allows us to make predictions for the long-term behaviour. For example, in the long term, typically of non-OA downloads during a given month are to papers months old or less. For OA papers, this proportion of downloads are typically to papers months old or less. Thus OA papers accumulate given proportions of their downloads faster than non-OA papers.
5 Diachronous approach
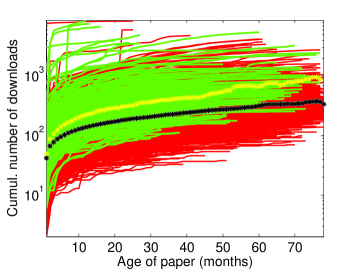
Cumulative downloads of individual papers are plotted in Fig. 4. The plot indicates the diversity of individual download histories, the median values of which can be considered as typical. This typical behaviour is fast accumulation of downloads during the first couple of months, followed by a slower rate thereafter. The OA papers tend to accumulated downloads more rapidly than non-OA papers. Correspondingly, the median numbers of downloads for such papers are consistently higher. We are also interested in unusual patterns of downloads and our next concern is how to detect papers which exhibit such behaviour.
5.1 “Bursty” papers
A simple but straightforward way to detect bursts in download activity is to flag strong deviations from an individual paper’s typical download pattern. Let be the standard deviation in the number of downloads of paper over its entire history to month . Let be the standard deviation of the median values over the first months. Define
| (2) |
Each paper is characterized by a value of . Bursts in activity may then be flagged by large values of compared to the average value . Of the 4 986 non-OA papers analysed, three have for certain values of . Thirty-seven papers have and ninety-six have . Since this represents a suitably small fraction of all papers (), we choose as a critical value. The download histories of each of these 96 bursty papers are depicted in Fig. 5, alongside the median pattern (for all papers). Ten OA papers (2.7% of all OA papers) can be described as bursty using the criteria described above and are shown in the inset of Fig. 5.
Some of the bursty papers exhibit the phenomenon of delayed recognition. Their download patterns are unremarkable for an extended period after which a burst of activity occurs. We describe such papers as “sleeping beauties” [23, 24, 25]. Thirty-five non-OA sleeping beauties (two OA papers), for which the download bursts occur later than 6 months after publication, are highlighted in Fig. 5. The bursts in activity for the remaining bursty papers come sooner after publication. For a summary of these, and other, results, see Table 1. To continue our analysis of usual EPL patterns, the bursty papers are excluded. Therefore we continue with 4 890 non-OA papers and 367 OA papers.
5.2 Diversity of download patterns
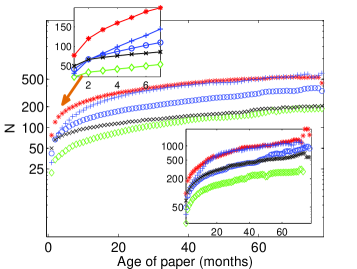
To categorise download patterns, and thereby the ageing of the attractiveness of EPL papers, we borrow the notion of durability which was developed for citation histories in ref. [26]. The cornerstone of this approach is to consider download half-lives. The half-life is the number of months by which a paper achieves 50% of its current downloads. The statistics of these values allow us to find papers with usual, fast and slow download rates. We consider as ‘usual’ the 3 065 non-OA papers for which is between the 25th and 75th percentiles (P25 and P75). These represent 62% of the 4 890 non-OA papers considered. If is smaller than the P25 value it means the downloads are initially accrued faster than ‘usual’ and tail off later. We refer to the 869 papers (18%) with this pattern as ‘flashes in the pan’. If is larger than P75 value, the paper has begun its life with a download rate lower than average, only to accelerate later. The 956 such papers (20%) are termed ‘delayed’. The corresponding proportions for OA papers are similar: have usual ageing behaviour and there are of the papers in each of the others two categories. However, while ‘flashes-in-the-pan’ and ‘delayed’ non-OA papers settle into their final ageing regimes already 4 or 5 months after publication (see the upper inset in Fig. 6), for OA papers it takes a longer time period of about months.
Median download statistics for the above defined three categories are depicted in Fig. 6. The aging of downloads for ‘usual’ papers goes more or less in a same way as the overall median pattern. Flashes-in-the-pan papers rapidly collect downloads after online publication but later the rate of downloads decreases. It is noticeable that the median values for such papers in the long term tend to be lower than the median values for ‘usual’ papers. Delayed papers are characterized by a slightly slower downloads at very beginning but they are well-downloaded later. (Sometimes, the term “delayed recognition” has been used synonymously with “sleeping beauties” but we distinguish between these two terms in order to differentiate between the papers with unexpectedly large bursts of downloads – sleeping beauties – and those characterized by gradual changing of download accumulation – delayed).
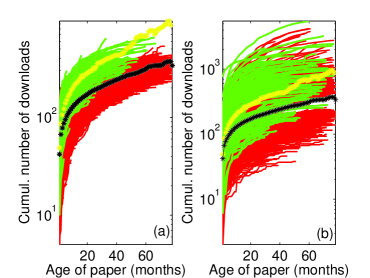
Finally we wish to address the question of overall attractiveness of papers, as measured by downloads. The root-mean-square deviation (RMSD) of cumulative numbers of downloads from the standard values can be used to gauge the extent to which patterns of downloads for individual papers differ from the standard one based on medians. The value was taken as critical111This choice was made because of an empirical observation that the number of papers with above criticality decays slowly for and rapidly for . to filter the non-OA papers close to the standard. In this way, 2 926 (60%) ‘typical’ papers were identified (), with the remaining 1 964 (40%) as ‘atypical’, see Fig. 7. Using the critical value for OA papers, 185 () ‘typical’ and 182 (the other ) ‘atypical’ papers were classified (see Fig. 7). For both categories OA papers accumulate constantly more downloads on average comparing to non-OA papers.
The atypical papers (see Fig. 7 (b)) are analysed to see the most notable examples of highly or poorly downloaded papers. Among the non-OA papers there are 857 atypical ones (18% of all papers), which are characterized by persistently higher cumulative download values compared to the standard. Another 581 atypical papers (12% of all papers) are always less downloaded, see Fig. 8. The cumulative curves of downloads for the remaining 526 atypical papers (10%) cross the standard curve from below (6%) or from above (4%) similarly to the flashes-in-the-pans and delayed (see Fig. 6 and Fig. 8). The proportion of OA papers for all these categories is again quite similar, see Table 1: of atypical papers are more attractive than average, are less attractive and for the attractiveness is changing with time. Here, as in Fig. 6, one observes that the ageing behaviours for some of the categories look similar (see the lower inset in Fig. 8).
6 Perspectives and discussion
| Categorisation by burstiness | ||
| 4 986 (377) papers | 98% are “non-bursty” papers | |
| 2% (3%) are “bursty” papers | 1% (1%) are “sleeping beauties” | |
| 1% (2%) burst early | ||
| Categorisation by half-lives (ageing of attractiveness) | ||
| 4 890 (367) non-bursty papers | 62% (65%) exhibit usual ageing behaviour | |
| 18% (17.5%) are flashes-in-the-pan | ||
| 20% (17.5%) exhibit delayed activity | ||
| Categorisation by overall attractiveness | ||
| 4 890 (367) non-bursty papers | 60% (50%) have typical overall attractiveness | |
| 40%(50%) are atypical | 18% (22%) are more attractive | |
| 12% (15%) are less attractive | ||
| 10% (13%) change attractiveness | ||
Using download data from EPL, for publications over a 6.5-year period, we developed a statistical picture for the attractiveness of the journal and its contents. The resulting insights are complementary to those from other measures such as scientometrics, altmetrics and influmetrics and it is hoped that the work will inspire similar download analyses for other journals. The synchronous aspect of downloads from the journal is well described by a sum of two exponential decays corresponding to different types of download activities (early and later in an average EPL paper’s life). The model has predictive power for the long-term behaviour of paper downloads from the journal.
We observed some difference in the ageing behaviour of downloads between non-OA and OA papers, mainly in terms of volumes of downloads and how fast downloads are accumulated. Otherwise, the proportions of OA papers with different download patterns are very similar to those for non-OA papers.
A diachronous study shows that a very small proportion of EPL papers are characterised by high levels of burstiness in download activity. The ageing of the remaining non-bursty papers can be studied using download half-lives. The term flash in the pan applies to about of publications and a similar number exhibit delayed recognition. The remaining papers have more usual ageing patterns.
The overall attractiveness of papers’ entire lifespans can also be examined and, while the majority of papers accumulate downloads in a rather typical manner, 18% (22% for OA papers) have an especially high degree of attractiveness while 12% (15% for OA papers) are less attractive. The attractiveness metrics for a smaller proportion of papers switches during their lifetimes.
One can speculate about the reasons for the various download statistics observed and aspects such as novelty, topicality and catchiness of title or a successful press release all can contribute to download characteristics. Other factors include the target audience, whether the paper is specialized, broad or, indeed, on an unusual topic. Similar to citations, different patterns of downloads are likely for different disciplines. Of course, one should be aware that not everything downloaded is actually read. Nonetheless, as a first step on the road to scientific recognition, downloading is nowadays a widespread component of scientific activity, so its statistics contain information on the journal, its contents and, indeed, its community of contributors and readers.
7 Acknowledgements
We thank Daniel Barrett (IOP Publishing) and the staff of EPL for providing the data and assistance. This work was supported by the 7th FP, IRSES project No. 269139 “Dynamics and cooperative phenomena in complex physical and biological environments” and IRSES project No. 295302 “Statistical physics in diverse realizations”.
References
- [1] Schreiber M., EPL, 78 (2007) 30002.
- [2] Schreiber M., Ann. Phys. (Leipzig), 16 (2007) 640.
- [3] Alfi V., Parisi G., Pietronero L., Nature Physics, 3 (2007) 746.
- [4] Alfi V., Gabrielli A., Pietronero L., Cent. Eur. J. Phys., 7 (2009) 483.
- [5] Mryglod O., Holovatch Yu., Mryglod I., Scientometrics, 91 (2012) 101.
- [6] Acuna D.E., Allesina S., Kording K.P., Nature, 489 (2012) 201.
- [7] Thurner S., Hanel R., Eur. Phys. J. B Conden. Matt. Complex Syst., 84 (2011) 707.
- [8] Mryglod O. et al., Scientometrics, 95 (2013) 115.
- [9] Mryglod O. et al., Scientometrics, 97 (2013) 767.
- [10] Wasserman L., ISBA Bulletin, 19 (2012) 7.
- [11] De Bellis N., Bibliometrics and Citation Analysis: From the Science Citation Index to Cybermetrics (Scarecrow Press) 2009.
- [12] Bornmann L., Scientometrics, 91 (2012) 857.
- [13] Simkin M.V., Roychowdhury V.P., Complex Syst., 14 (2003) 269.
- [14] van Wesel M., Wyatt S., ten Haaf J., Scientometrics, 98 (2014) 1601.
- [15] Perneger T.V., BMJ, 329 (2004) 546.
- [16] Watson A., Journal of Vision, 9 (2009) i, 1.
- [17] Kurtz M.J. et al., Inform. Proces. Manag., 41 (2004) 1395.
- [18] Moed H.F., J. Am. Soc. Inf. Sci. Tec., 56 (2005) 1088.
- [19] Bollen J. et al., Inform. Proces. Manag., 41 (2005) 1419.
- [20] Brody T., Harnad S., Carr L., J. Am. Soc. Inf. Sci. Tec., 57 (2006) 1060.
- [21] Franceschet M., J. Informetrics, 4 (2010) 55.
- [22] The international journal for the Rapid Publication of communications in Organic Chemistry.
- [23] Garfield E. Current Contents, 21 (1980) 5.
- [24] Glänzel W., Schlemmer B., Thijs B., Scientometrics, 58 (2003) 571.
- [25] van Raan A.F.J., Scientometrics, 59 (2004) 467.
- [26] Costas R., van Leeuwen T.N., van Raan A.F.J., J. Am. Soc. Inf. Sci., 61 (2010) 329.