789\Yearpublication2014\Yearsubmission2014\Month08\Volume999\Issue88
later
Astronomical orientation analysis of three proto-historical sites in Friuli - Italy
Abstract
In this paper we present the results of an archaeoastronomical survey of three proto-historical sites located in the high Friulian plain (Galleriano, Gradisca and Savalons), dating from the end of the Early Bronze Age (1900 B.C.) to the end of the Late Bronze Age (950 B.C.) These structures, commonly indicated as castellieri, are earthworks of quadrangular shape, with sides ranging from 140 to 250 m. At present the perimetrical earthen embankments reach a maximum base width of 18 m and an elevation of more than 5 m the surrounding plain in their best preserved parts. These three sites were often reported in the literature to have the corners aligned to the cardinal directions. Aveni and Romano ([1986]) included two of them (Galleriano and Gradisca) in their study of earthworks in Veneto and Friuli (Italy), tentatively proposing astronomically relevant alignments for some sides and diagonals. Inspired by this pioneering work and by the renovated archaeological interest for these sites, we obtained digital elevation models of the earthworks and re-analyzed their orientation. Our study does not confirm the presence of systematic and statistically significant solar or lunar alignments for these sites.
keywords:
General: history and philosophy of astronomy – Methods: numerical1 Introduction
The region of Friuli (Italy) is rich of proto-historical earthworks dating from the end of the Early Bronze Age (1900 B.C.) to the end of the Late Bronze Age (950 B.C.). The reader is referred to Càssola Guida ([1981], [2006]) and Simeoni & Corazza ([2011]) for thorough reviews on the subject. The sites are distributed both in the high Friulian plain and in the pre-Alps, to the North and North-East of the region. Those located in the plain are particularly interesting for the archaeoastronomical analysis, because they could be planned and built without being subjected to strong geomorphological constraints, as opposed to the cases when the sites are erected on natural terrain elevations.
Although many of these earthworks were found in the upper Friulian plain (Quarina [1943]), only three of them are sufficiently well preserved to allow an astronomical orientation analysis. In all other cases modern activities modified their original morphology so severely that their only remnants are mostly buried below the surface (Càssola Guida & Corazza [2005]) and no orientation analysis is possible at the moment.
Geodetic position Elevation Sides Perimeter Area Volume Site Longitude Latitude Easting Northing (m) (m) (m) (m2) (m3) (deg) (deg) (m) (m) Galleriano 13.1130E 45.9824N 353840 5093818 53 245160 830 42900 6000 Gradisca 12.9692E 46.0069N 342772 5096821 65 170140 620 26100 12300 Savalons 13.0629E 46.0607N 350169 5102618 104 180180 700 37900 9900 Notes: Coordinates refer to the approximate geometrical centers of the structures and were determined from the survey data. Longitude and Latitudes are in the WGS84. Easting and Northing are in the UTM grid, zone 33N.
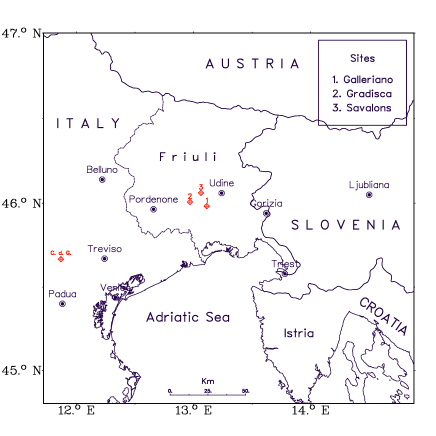
The three sites discussed in this paper are located in the surroundings of the villages of Galleriano di Lestizza, Gradisca di Sedegliano and Savalons di Mereto, in the province of Udine (see Fig. 1) and have been object of several archaeological campaigns (Corazza [2000]; Càssola Guida & Corazza [2003b, 2003c, 2004a, 2004b, 2005, 2009]). The accurate positions for the three sites are given in Table 1. These structures are commonly indicated as castellieri (we will conform to this nomenclature throughout this paper) and are earthworks of quadrangular shape, with sides ranging from 140 to 250 m. At present, the earthen embankments reach a maximum base width of 18 m and an elevation of more than 5 m above the surrounding plain in their best preserved parts. Portions of the castellieri were destroyed, especially by modern agricultural activities. In particular, the perimetrical embankment was broken in one or more points to give easy access to cultivations. The recent archaeological digs are starting to clarify the role of these sites, proving that they were inhabited. Many questions remain unanswered (Càssola Guida [2006] and references therein) but a recent finding in the castelliere of Gradisca allowed the archaeologists to put a firm estimate on its construction date. In 2004 several human skeletons were found buried in the earthen embankment and their radiocarbon dating led to the conclusion that the foundation of the site took place at the end of the Early Bronze Age (c.a 1900 B.C.; Borgna & Càssola Guida [2009]). More uncertain is the dating of the other two sites, but there are indications that they might be slightly more recent, judging from the ceramic remnants (Càssola Guida & Corazza [2003b, 2005, 2009]). However, only future digs reaching the base of the embankments (buried below the current level of the surrounding plain) will cast more light on this issue, allowing for a more accurate dating.
What is clear from the available data is that the construction of the sites took place in different and subsequent stages during the Bronze Age, and some modifications were also introduced during the Roman occupation (second century B.C.).
A characteristic property of these sites is the presence, in their neighborhoods, of earthen burial mounds (Càssola Guida & Corazza [2003a]). In 2008 the University of Udine completed an excavation campaign at the mound of Mereto di Tomba, located about 2 km SSW of the castelliere of Savalons. This led to the discovery of a human male skeleton, deeply buried below the mound. The radiocarbon dating provided an age between 3620 and 3830 years (Borgna, Corazza & Simeoni [2013]).
While the Histrian castellieri are characterized by a circular shape, the Friulian ones are quadrangular, hence leading to considerations about their orientation. They are rather frequently reported to have the corners aligned to the cardinal points (Quarina [1943]; di Caporiacco [1976]; Càssola Guida [1981]; Menis [1988]; Càssola Guida & Corazza [2005]; Simeoni & Corazza [2011]). To the best of our knowledge, the only study specifically devoted to an orientation analysis of these sites in connection to astronomically relevant directions is the one by Aveni & Romano ([1986]; hereafter AR86), who undertook a survey of motte and castellieri mostly in the neighboring Veneto region.
Motte, also known as mutere, are earthen structures of roughly conical form, with heights spanning from 2 to 8 m and diameters between 6 and 60 m. The study by Aveni and Romano is mostly devoted to the alignments between mutually-visible motte, but it includes also two Friulian castellieri, i.e. Galleriano and Gradisca. The connection to astronomically significant directions is not very clear for these two sites. For the minor diagonal of the latter, AR86 found a slightly deviating equinoctial alignment (they report an azimuth of 85.0 degrees, corresponding to a refraction corrected declination of +3.0 degrees). For the remaining directions (sides and diagonals) they tentatively considered minor/major lunar standstills and stellar alignments (namely the rising of Aldebaran, for the minor diagonal of Galleriano); however, they did not attach very much confidence to these findings and they reported them only for the sake of completeness.
Stimulated by the pioneering work of AR86, the renovated interest shown by the archaeological community and the fruitful digs of these last fifteen years, we decided to investigate in a more thorough way the two Friulian sites of Gradisca and Galleriano, and to extend the analysis to the unstudied castelliere of Savalons.
The paper is structured as follows. In Sect. 2 we describe the methods used to acquire the data. Sect. 3 presents the general morphology of the sites, which are then analysed in Sect. 4. The results are finally discussed in Sect. 5, which also recaps our conclusions. Appendix A provides a description of the numerical methods used for horizon altitude calculation, refraction correction and statistical error estimates. Appendix B presents the digital elevation models (DEM) for the three sites.
2 Survey data
Rather than measuring the azimuths of specific directions at each site, as it was done by AR86, we preferred to go for a full three-dimensional survey of the earthen structures. Besides enabling a more accurate morphological study, this methodology allows one to determine azimuths using mathematical fitting procedures, as opposed to the direct measurement of sight lines that necessarily imply a somewhat arbitrary choice of two reference points defining the alignment. This choice becomes particularly difficult when one is to determine the diagonals of a quadrangular structure with sides of 100-200 m and rounded corners, or its symmetry axis. This is made even more cumbersome by the presence of vegetation, as is the case in Galleriano and Savalons. Galleriano and Gradisca were mapped in 2004 and 2005 for the University of Udine by the professional surveyor G. Meng, using a Wild-Leica Total Station. A total of 687 and 588 points were surveyed for Galleriano and Gradisca, respectively. The relative horizontal/vertical measurements were translated into an absolute geodetic grid by means of a number of trigonometric fiduciary points visible from the two sites. Finally, the reconstruction of the three-dimensional geometry of the earthworks from the sparsely distributed data points was performed by linear interpolation within triangles, determined via Delaunay triangulation. The results were stored as digital images with a nominal resolution of 0.5 meters per pixel.
No modern data suitable for our analysis were available for the castelliere of Savalons. Therefore, we decided to survey the site taking advantage of the Light Detection And Ranging (hereafter LIDAR) technology. LIDAR is a remote sensing technique that makes use of a scanning laser beam to get range information on a distant target, and it is based on the measurement of the travel time of laser micro-pulses and on the properties of the light reflected back by the target. In our specific case, the advantage of a laser scan over a classical total station survey is the much higher spatial resolution and the definitely shorter time it takes to cover a 4 hectares site. The measurements were taken from an helicopter in November 2007 by the HELICA company, using an Optech laser scanning system operating at 1,064 nm. The horizontal positions of the sampled points are derived from the simultaneous use of 12 channels, dual-frequency GPS receiver on board of the aircraft coupled to ground GPS beacons located within 30 km. They are then converted to a geodetic absolute grid during the data post-processing. Typical root mean square (rms) vertical accuracies are better than 5 cm, while the rms absolute horizontal accuracy is less than 20 cm. The survey was completed in a few seconds, from an elevation of about 1,000 m. Even though higher spatial resolutions are possible, both because of the nature of the site and the purpose of this work the scan was performed with a resolution of 30 cm over a rectangular area of 467 m 398 m, for a total of about 1,723,000 data points.
The only drawback of a airborne LIDAR survey, when compared to ground based measurements, is the disturbance introduced by vegetation, possibly preventing the laser from reaching the soil, and hence giving false altimetry. The problem was partially mitigated by running the survey when the foliage had fallen. Moreover, based on the different properties of light reflected by the soil or by vegetation, during the data processing it was possible to disentangle ground from non-ground points. This reduced the number of suitable measurements to about 590,000, corresponding to an average resolution of 56 cm. In the analysis we used only the ground points. The reconstruction of the three-dimensional geometry of the site was carried out in a similar way as for the total station surveys, i.e. via Delaunay triangulation and linear interpolation. The comparison between the DEM and aerial ortho-photography shows that this procedure removes vegetation quite effectively.
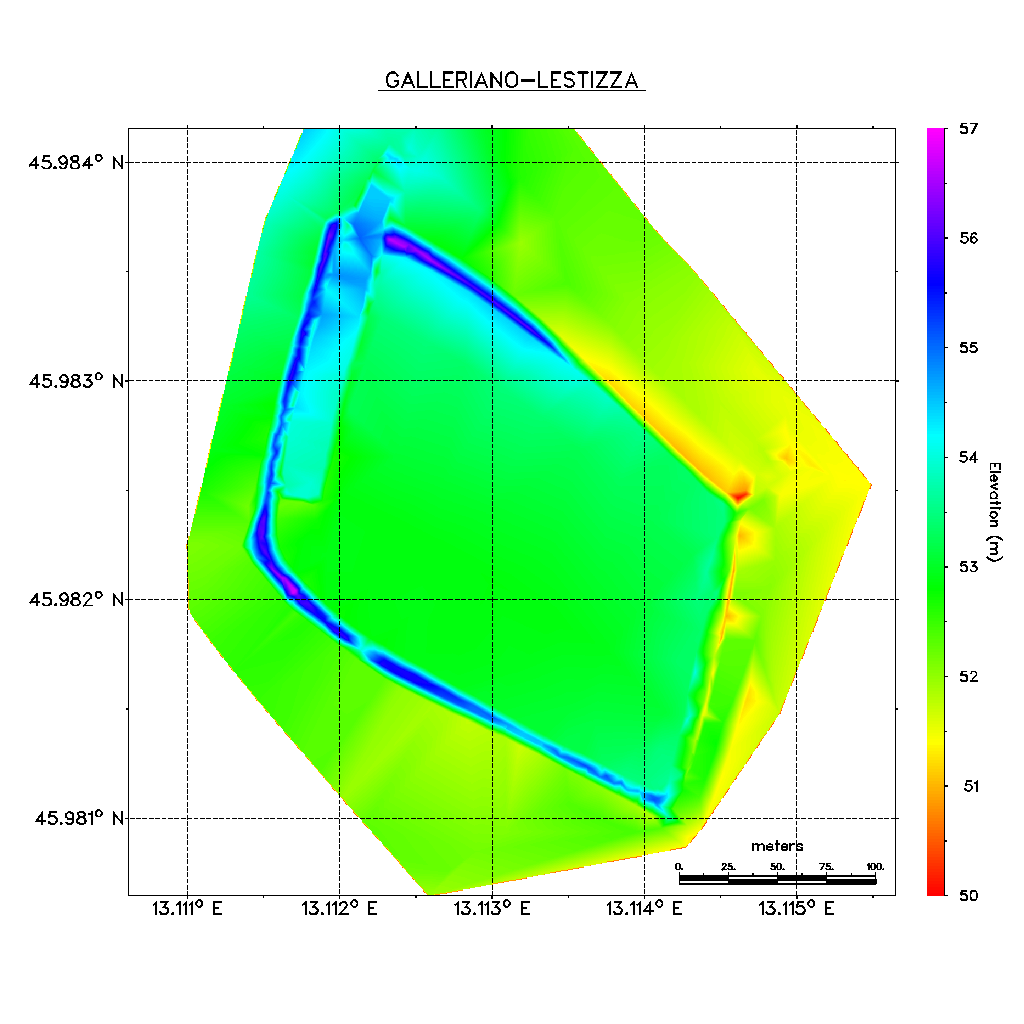
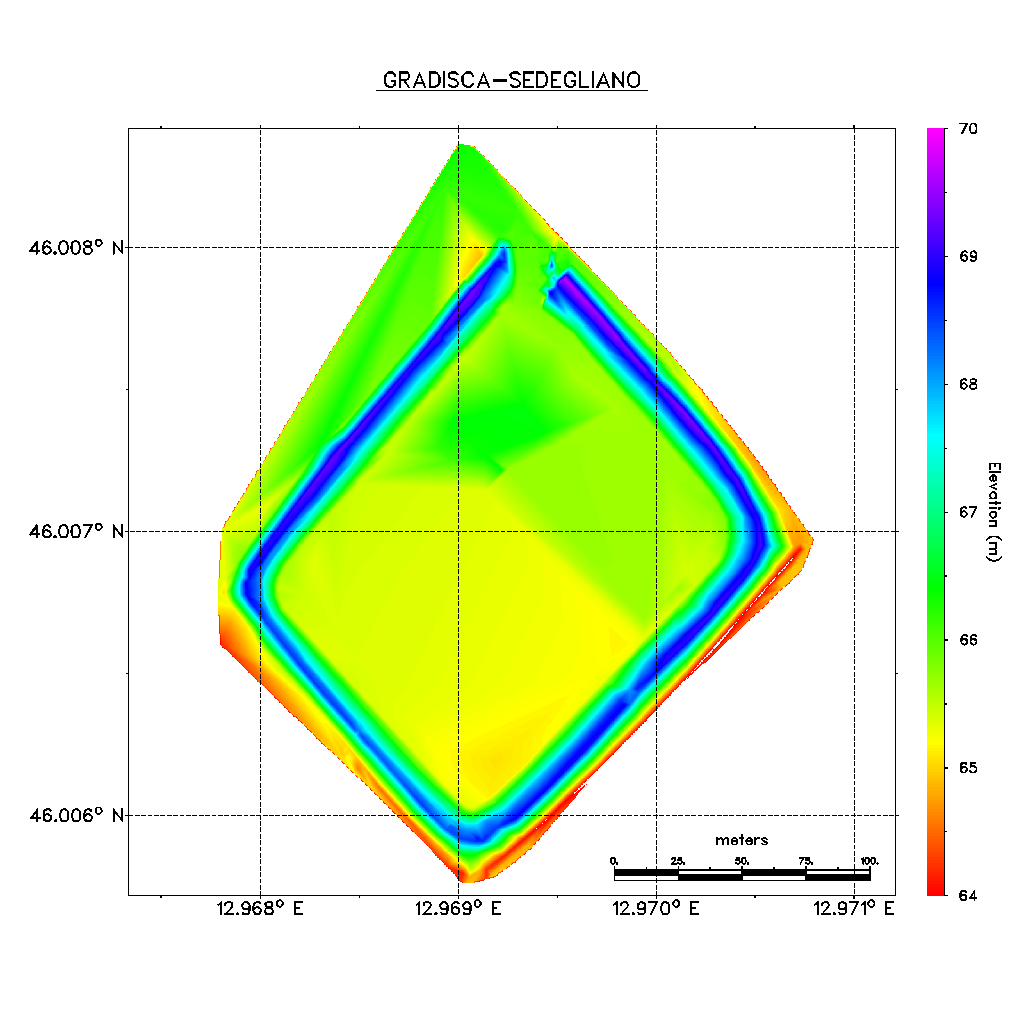
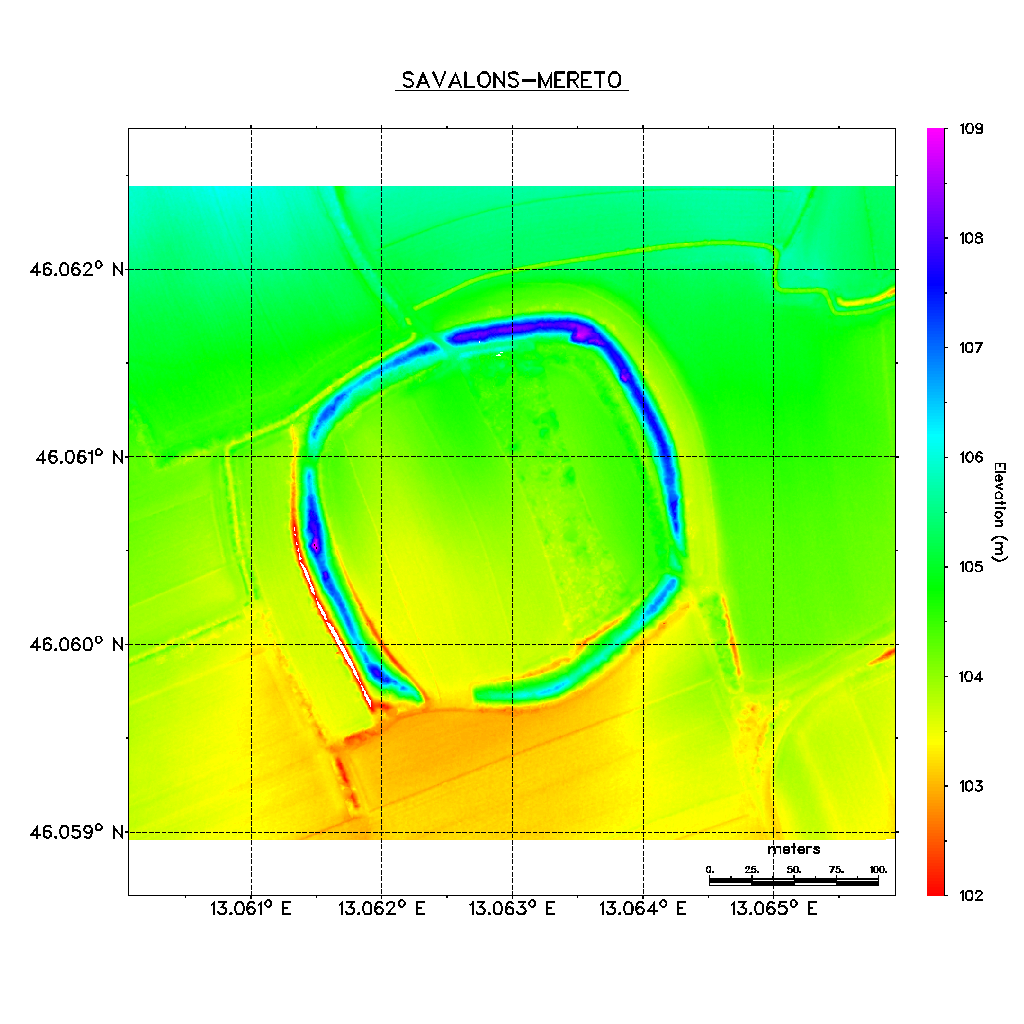
The resulting DEMs for the three sites are presented in Appendix B (Figs. 11, 12 and 13). They are geo-referenced to the World Geodetic System 1984 (hereafter WGS84), so that direct azimuth measurements are possible without any additional correction for grid rotation (horizontal and vertical axes are aligned to the true North and true East, respectively).
In all cases we validated the whole procedure by directly measuring the absolute azimuth of some well defined and straight features in each site using a RK 76 Zeiss theodolite and sun fixes. The agreement is always within 0.1 degrees and the discrepancies are well explained by the difficulty of placing the field check points at the correct positions on the DEMs (see Sect. 4).
3 General morphology
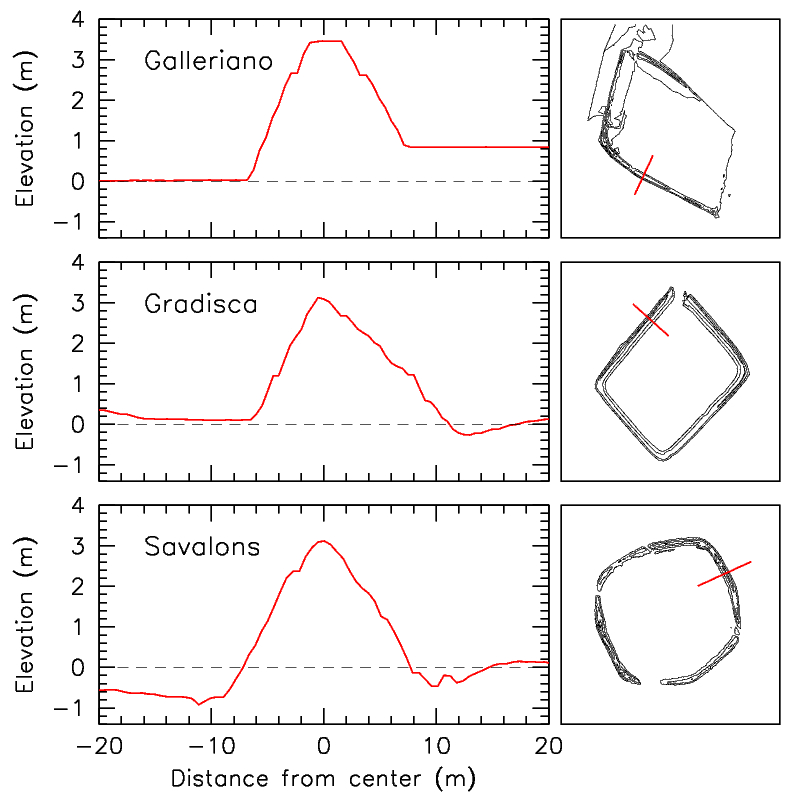
The sides of the quadrangular structures range from 140 to 245 m, while the enclosed areas vary from 2.6 to 4.3 hectares. Only lower limits of the original volumes can be estimated; they range from 6103 m3 (Galleriano) to almost 1.3104 m3 (Gradisca). Adopting the typical density of an earthen mixture (2103 kg m-3), these numbers imply masses that range from 1.2107 to 2.6107 kg. Representative cross sections of the embankments are shown in Fig. 2 for the three sites. The full width of these profiles at the current ground level is 15.8, 17.5 and 15.1 m (full width half maximum is 9.8, 9.3 and 8.9 m), while the peak elevation above the surrounding plain is 3.4, 3.1 and 3.2 m for Galleriano, Gradisca and Savalons, respectively. The largest values are reached in Savalons, where the maximum base width is about 18 m and the elevation slightly exceeds 5 m.
Although the three sites are commonly classified as quadrangular structures, they show clear morphological differences. The most regular shape is the one of Gradisca, which is close to a parallelogram with very rectilinear sides forming angles that deviate by less then 10 degrees from the right angle (Fig. 12). The shorter sides (NE and SW) are parallel to within 0.1 degrees, while the longer sides deviate by 4 degrees from parallelism (see Sect. 4.2). The case of Galleriano is less regular: the sides are only partially rectilinear and show a pronounced bending at the western and northern corners (Fig. 11). The SE side and the southern portion of the NE side were almost completely leveled by modern agricultural activities. Finally, Savalons presents clear bends in all sides111Romano ([1992]) proposed a possible practical way of designing a site like Savalons, using four sticks and a string (his Fig. 64) Nevertheless, this geometrical method produces a quadrilateral with curved sides and rounded corners, while the data presented here suggest the existence of rectilinear segments, especially in the SW, SE and NE sides (see Fig. 13 and next section). We note that Romano ([1992], p. 223, his Fig. 65) proposed a similar approach for the site of Gradisca; however, this is in contradiction with the very rectilinear sides of the embankment. (Fig. 13).
.
Geographical and geometrical parameters for the three sites are recapped in Table 1. Both sets of parameters were estimated from the survey data presented in this work. The length of the sides was measured along a straight line, corner to corner. Given the rounded shape of Savalons, the side length is only indicative. The perimeter was estimated as the length of a closed polygonal line along the maximum elevation of the embankments. The site area was derived as the plain surface enclosed by the polygonal perimeter. The volume was computed by integrating the elevation data of the embankments above a certain threshold altitude; therefore, the reported values are only lower limits. For Galleriano the estimate is particularly uncertain, because of the bad state of the NE and SE portions of the earthwork.
Sun center Site WSSR h WSSS h ESR h ESS h SSSR h SSSS h GAL 125.180.24 +0.26 235.490.27 0.17 90.710.17 +1.14 269.970.19 +0.57 56.090.18 +1.75 303.650.17 +1.94 GRA 124.930.25 +0.09 235.480.27 0.17 90.410.17 +0.88 269.550.17 +0.92 55.590.19 +1.39 303.750.18 +1.88 SAV 124.970.25 +0.09 235.450.27 0.18 90.240.18 +0.74 269.120.16 +1.28 56.050.18 +1.76 303.120.16 +2.38 CDG 124.340.27 0.14 235.070.24 +0.24 89.720.20 +0.32 268.900.15 +1.48 54.470.23 +0.45 302.810.16 +2.43 Sun lower limb Site WSSR h WSSS h ESR h ESS h SSSR h SSSS h GAL 125.63 +0.26 235.02 -0.16 91.07 +1.10 269.52 +0.61 56.46 +1.69 303.32 +1.85 GRA 125.40 +0.09 235.02 -0.17 90.77 +0.84 269.18 +0.89 56.02 +1.38 303.31 +1.87 SAV 125.45 +0.10 235.00 -0.18 90.62 +0.72 268.68 +1.30 56.47 +1.73 302.77 +2.30 CDG 124.79 -0.14 234.70 +0.18 90.12 +0.32 268.53 +1.46 54.85 +0.41 302.38 +2.42 Sun upper limb Site WSSR h WSSS h ESR h ESS h SSSR h SSSS h GAL 124.70 +0.24 235.94 -0.17 90.37 +1.19 270.37 +0.58 55.68 +1.78 304.09 +1.95 GRA 124.53 +0.12 235.94 -0.18 89.88 +0.78 269.88 +0.98 55.20 +1.44 304.27 +1.82 SAV 124.58 +0.13 235.90 -0.18 89.91 +0.81 269.49 +1.32 55.37 +1.59 303.52 +2.41 CDG 123.89 -0.14 235.46 +0.28 89.31 +0.32 269.33 +1.46 54.05 +0.48 303.28 +2.40 Notes: WS=Winter Solstice, SS=Summer Solstice, E=Equinox. GAL=Galleriano, GRA=Gradisca, SAV=Savalons, CDG=Castello di Godego.
Site R S R S R S R S GAL 133.260.29 227.000.31 117.060.23 243.460.25 63.500.18 295.900.16 47.540.20 311.890.19 GRA 133.180.30 226.960.30 116.830.24 243.480.25 63.670.17 295.000.15 47.610.20 311.340.18 SAV 133.630.28 227.020.31 117.090.23 243.450.25 64.340.16 295.880.16 48.040.19 311.470.18 CDG 132.760.30 226.250.26 116.390.24 243.130.23 62.160.23 295.080.15 46.840.23 310.950.18
4 Orientation analysis
At variance with the case of direct azimuth field measurements, the availability of digital elevation data allows one to determine the orientation of a rectilinear structure by means of simple least squares fitting. This implicitly takes into account the three-dimensional shape of the earthen structure. For this purpose, we devised a software procedure that determines the centroids of a number of cross sections along an interactively selected portion of the embankment and fits a straight line to their x and y coordinates, deriving the azimuth and its associated statistical error.
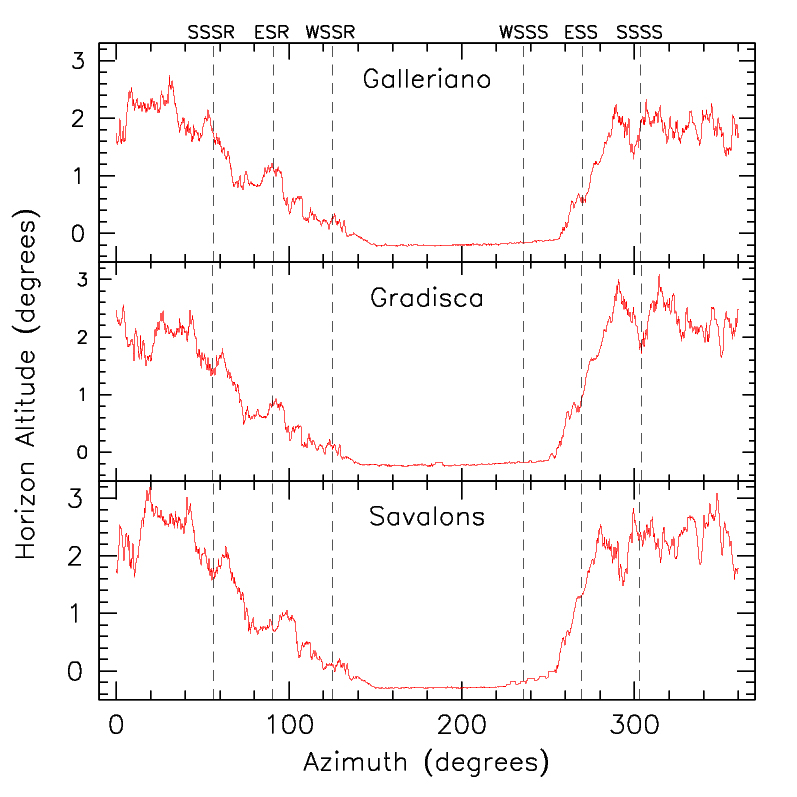
AR86 assumed that the horizon altitude was close to zero; however, the Alps are clearly visible from the sites. In the direction of the highest peaks (2500-3000 m) the horizon altitude exceeds 2 degrees, hence requiring a significant correction to the derived declinations. In this study the horizon profiles were computed using the procedure described in Patat ([2011]), which includes terrestrial refraction and Earth’s curvature corrections. The digital elevation data adopted for the calculations are those provided by the Shuttle Radar Topographic Mission (SRTM; Farr et al. [2007]), which has a resolution of 90 m. A similar approach to horizon calculation was adopted by Pimenta, Tirapicos & Smith ([2009]) in their analysis of megalithic enclosures. The resulting horizon profiles are shown in Figure 4.
Given the location of the three sites, the natural horizon is mostly placed at distances larger than 30 km and, therefore, the expected accuracy on the computed altitude is better than 0.1 degrees (Patat [2011]). We note that the values corresponding to sharp mountain ridges are systematically smaller than real, because of the smoothing introduced by the 90 m SRTM resolution bins. A direct altitude measurement of the peak of M. Canin (2587 m), visible from all the three sites and placed at a distance of about 50 km, gave a value of 2.50 degrees. This is to be compared to the 2.44 degrees estimated by the numerical procedure, which gives an idea of the magnitude of the systematics affecting the horizon calculations.
An example horizon computation is presented in Fig. 3 for the site of Gradisca. The calculations were done assuming an eye position of 5.5 meters above the surrounding plain (which is about 1.5 meters above the top of the embankments). In the azimuth range 148-256 degrees (i.e. in the direction of the Adriatic sea) the horizon altitude is negative. This is because the Friulian plain steadily declines to the sea level with a gradient of 5.5 m km-1 roughly aligned with the N-S direction (see also Sect. 5).
There is a caveat one should always bear in mind when considering risings/settings on the natural horizon. The procedure described above implicitly assumes that this is actually visible from the sites. Although the elevation of the embankments (4 m) positions an hypothetical observer at more than 5.5 meters above ground, high trees can completely cover significant portions of the horizon. For instance, a 25 m high tree placed at 1.2 km prevents the horizon visibility below 1 degree. In other words, horizon visibility requires that the area surrounding the sites was free of high vegetation within a radius of a couple of km. This is by no means guaranteed and it constitutes a serious issue, which is often neglected in orientation analyses published in the literature (see for instance AR86).
The availability of a digital horizon profile enables an easy numerical derivation of declinations () from measured azimuths () and vice-versa. The procedure (which includes astronomical refraction correction and statistical error estimate) is described in Appendix A. Using this approach, we computed the apparent azimuths for the sunrise (SR) and sunset (SS) at the Winters Solstice (WS), at the Equinoxes (E) and at the Summer Solstices (SS). The results, calculated for 1500 B.C. (obliquity =23.87 degrees), are presented in Table 2, which includes the horizon altitude (indicated by ). These are used as terms of reference in the orientation analysis that is presented in the following subsections. The table includes also the relevant data for the site of Castello di Godego (Bianchin Citton [1989]), which will be discussed in Sect. 5. All calculations were done for the Sun center and for the lower and upper limbs of the solar disc. The azimuth range corresponding to the upper and lower limbs is about 0.4 degrees from the sun center values.
Since major and minor lunar standstills are listed as possible target alignments by AR86 for Galleriano and Gradisca (see their Table 2), we performed a similar calculation for the relevant moon azimuths. The results are presented in Table 3 (average lunar orbit inclination =5.14 degrees). We emphasize that this table was included only for the purposes of the comparison with the work of AR86.
4.1 Galleriano
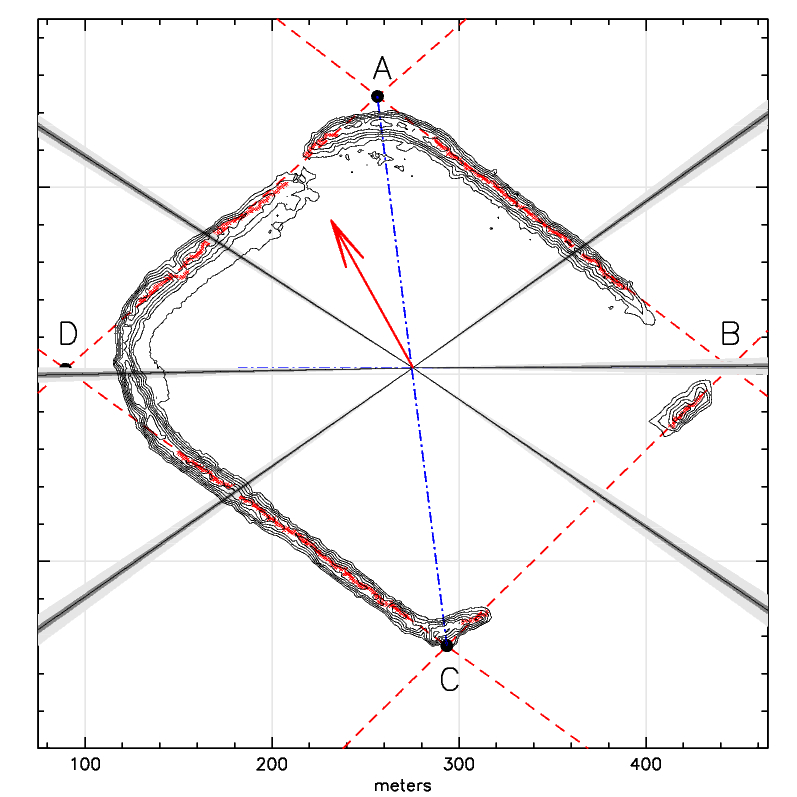
The DEM contour plot for Galleriano is presented in Fig. 5. The figure shows the best fit directions for the four sides. Only the data from the rectilinear portions of the embankment were used in the least squares fitting. The points marked as A, B, C and D indicate the geometrical intersections between the best fit lines. With the only exception of C (southern corner), they do not coincide with the physical corners of the earthwork, but they provide non-subjective points for defining the diagonals. For the sake of completeness, we also marked the western and eastern corners E and F. While the position of E is well defined, F is much less so, because of the poor state of the AB and CB sides. For the same reason, the directions defined by these two sides are very uncertain. The figure also displays the reference solar directions listed in Table 2 with the 5 standard deviation (SD) confidence levels (light gray shaded areas) and the lower-upper solar limb interval (dark gray shaded areas).
AR86 ID AB 123.990.22 +0.20 -23.190.20 - - CB 11.554.77 +2.31 +44.860.77 10.2 +42.5 DC 117.330.06 +0.21 -19.170.15 119.7 -20.6 DA 13.461.54 +2.20 +44.330.40 19.7 +40.3 AC 151.820.65 -0.21 -38.620.34 - - DB 75.701.30 +1.00 +10.230.92 77.8 +8.0 AF 128.30.4 +0.16 -25.860.28 135.7 -30.3 EC 122.70.4 +0.12 -22.440.32 - - EF 85.40.5 +0.98 +3.590.33 - - BA 303.990.22 +1.97 +24.100.18 - - BC 191.554.77 -0.21 -43.640.97 190.2 -42.5 CD 297.330.06 +1.54 +19.170.12 299.7 +20.6 AD 193.461.54 -0.20 -43.400.41 199.7 -40.3 CA 331.820.65 +1.98 +39.250.39 - - BD 255.701.30 -0.10 -10.440.94 247.8 -8.0 FA 308.30.4 +2.02 +26.830.22 315.7 +30.3 CE 302.70.4 +1.72 +23.060.37 - - FE 265.40.5 +0.50 -3.240.39 - -
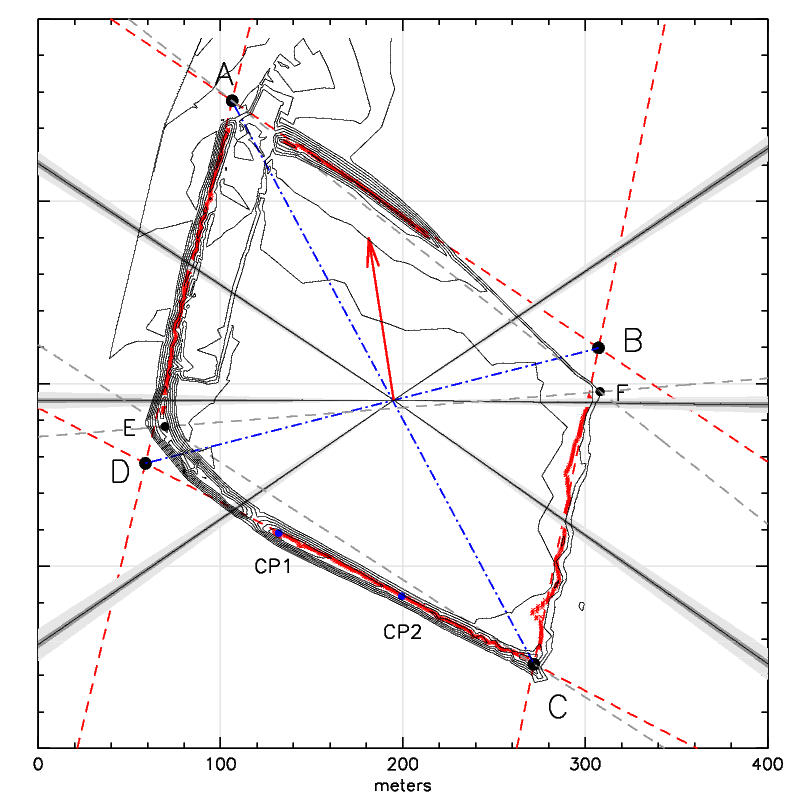
The best fit results are reported in Table 4, which lists azimuth (), horizon altitude (), corrected declination () and their associated errors (SD) for each alignment and for both rising and setting directions. For convenience the table also lists the results by AR86 (see their Table 2), who considered “sides, where measurable, as well as any visible diagonal connecting definable corners of the monument”. For this reason our cross-matching in Table 4 is tentative.
In the comparison that follows we neglect the discrepancies on the directions of sides CB and DA, because they are of no obvious astronomical interest.
The best preserved side of the earthwork is the one we designate as CD (SW). Although it shows a marked bending approaching the western corner, it is characterized by a rectilinear segment that extends for about 160 m. For the validation of the DEM orientation we performed a direct field measurement using two check points (marked as CP1 and CP2 in Fig. 5) placed 75.8 m apart. The true azimuth, averaged over twelve sun fixes, is 117.190.01 degrees. This is fully consistent with the value derived from the DEM best fitting (117.330.06 degrees). The obvious match is with the value 119.7 reported by AR86 for one of the two long sides (the other being 135.7 degrees). The discrepancy is about 2.4 degrees and it is very difficult to explain in terms of measurement errors. A possible explanation is that AR86 used a different set of reference points. In this respect, we note that the azimuth identified by points E and C (see Fig. 5) is 122.70.4 degrees, so that the value reported by AR86 appears to be very close to the average of the two. This suggest that they may have placed one of the two reference points not on the physical western corner E, but somewhere on the bended part of the SW side.
As far as the other long side AB is concerned, we remark that the apparent statistical azimuth accuracy (0.22 degrees) only refers to the portion that we used (Fig. 5). Although some traces of the embankment are visible all the way to the eastern corner, with the currently available data is not possible to tell the exact shape and direction of the missing portion. The best fit azimuth of the surviving part (123.990.22 degrees) deviates significantly from the value reported by AR86 (135.7 degrees), clearly indicating that their measurement refers to a different alignment. The most natural alternative is that identified by the northern and eastern corners (A and F, respectively); however, the resulting azimuth (128.30.4 degrees) deviates by 7.4 degrees from the AR86 value. We could not identify any obvious feature with the AR86 azimuth in our DEM. This clearly illustrates the difficulties inherent to the study of sites like Galleriano, where the identification of possible alignments is rather subjective. Based on the observed discrepancies, we argue that the alignments considered by AR86 for sides AB and CD (lunar standstills rise and setting) are strongly debatable. In all fairness, our new DC azimuth determination (117.330.06) is consistent to within 1 sigma with the moon rising at (117.060.23 degrees; see Table 3). Although this is a statistically significant match, given the lack of similar alignments in the other sites studied in this work (see next sections and the discussion), we attribute it to a chance coincidence.
The comparison to the solar reference directions suggests a possible alignment of the long sides to the WSSR and SSSS. Nevertheless, the CE direction differs from the SSSS by 0.950.43 degrees, which is a deviation at the 2.2-sigma level. The difference with the WSSR is larger (2.50.5 degrees), making the alignment statistically unlikely. Because of the poor state of the AB side, we reckon it is not possible to conclude whether or not this reflects a solstitial alignment, as the measured values may suggest.
As for the major/minor diagonals, we note that both deviate from the NS/EW, hence contradicting the common statement about cardinal alignments as a characteristic feature of these sites. Based on the measured azimuth values, we can only conclude that the corners of the earthwork are very roughly oriented to the cardinal points. AR86 report an azimuth of 77.8 for the minor diagonal. This value is very different from that computed for the EF corners direction (85.40.5) suggesting that, again, they adopted a different pair of points. The AR86 value can be obtained if one of the two points is placed in F and the other on the DC side, where this starts to bend in the direction of E. As this choice appears to be completely arbitrary, we believe no information can be extracted from the derived azimuth.
Given the state of the embankment around the eastern corner, it is not possible to firmly establish its position with sufficient accuracy. Nevertheless, based on the existing data, we reckon an equinoctial alignment can be excluded.
4.2 Gradisca
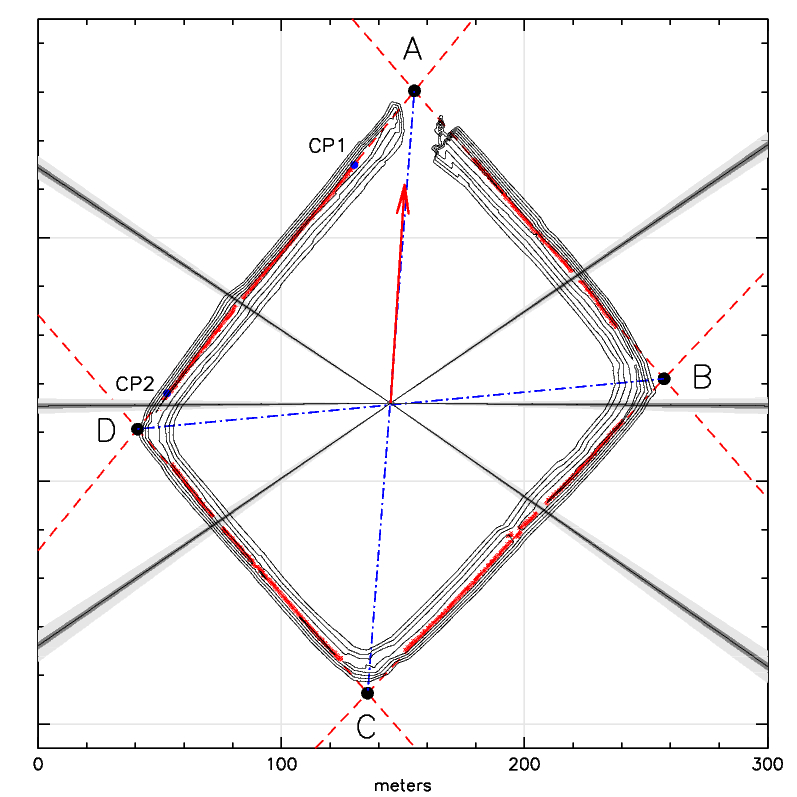
The DEM contour plot for Gradisca is presented in Fig. 6. Points and lines have the same meaning as in Fig. 5 (see also the previous Sect. 4.1). The best fit results are presented in Table 5.
The sides of this site are well defined and very rectilinear, allowing an accurate determination of their azimuths. The corners are also well defined, with the only exception of the northern one, which was demolished at the beginning of the 20th century to give access to cultivations. As in the previous case, in the analysis we use the best fit lines intersection to compute the corners positions in an objective way. The fitted azimuths are listed in Table 5, where they are compared to the previous estimates by AR86.
AR86 ID AB 139.080.15 -0.18 -32.410.20 140.5 -32.9 CB 43.330.10 +2.22 +31.920.13 42.9 +30.0 DC 138.940.12 -0.17 -32.330.19 139.7 -32.6 DA 39.310.12 +2.12 +34.010.15 41.0 +31.0 AC 184.450.09 -0.21 -44.760.22 - - DB 84.550.13 +0.60 +3.830.16 85.0 +3.0 BA 319.080.15 +2.60 +33.580.12 320.5 +32.9 BC 223.330.10 -0.19 -31.100.19 222.9 -30.0 CD 318.940.12 +2.63 +33.530.12 319.7 +32.6 AD 219.310.12 -0.20 -33.290.20 221.0 -31.0 CA 4.450.09 +2.45 +45.950.14 - - BD 264.550.13 +0.84 -3.540.16 265.0 -3.0
The DEM orientation was validated using two check points (marked as CP1 and CP2 in Fig. 6) placed 130 m apart on the NW side. The azimuth, averaged over ten sun fixes, is 39.220.01 degrees, which is in good agreement with the best fit value (39.310.12 degrees). For this side, AR86 report an azimuth of 41.0 degrees, which is about 0.7 degrees off with respect to our measurements. Similar deviations are seen in the other angles. Given the very good conditions of the earthwork, we deem the mismatch is due to the subjective positioning of the reference point pairs on the corners defining the relevant directions in the AR86 study.
While the sides AB and BC are almost parallel (the azimuth difference is 0.140.19), the azimuths of BC and DA differ by 4.020.15 degrees. The angles formed by the diagonals differ by 9.90.2 degrees from the right angle. A similar deviation from orthogonality is seen in adjacent sides.
A quick comparison to the solar reference directions shows that none of the alignments is statistically significant (see also Fig. 6). The closets match is that of the minor diagonal DB, which is 5.9 degrees off (i.e. more than 30 SD). A similar deviation from the NS direction is displayed by the major diagonal AC. This rough alignment to the NS and EW directions is probably the origin of the diffused perception that these sites have a cardinal orientation. Although the case of Gradisca may be regarded as more accurate than Galleriano (see Sect. 4.1), we reckon the deviations are sufficiently large to make the match to astronomically relevant directions statistically unlikely.
As for the case of Galleriano, AR86 considered minor and major lunar standstills for the sides CB and DA. The same matches were considered for sides AB and DC, but they were listed with question marks (see their Table 2). Our azimuth measurements and horizon corrections produce declinations that deviate in a statistically very significant way from the nominal lunar azimuths (see Table 3). In this respect, it is important to emphasize that AR86 commented that the alignments to lunar extrema were only considered to pragmatically follow Thom’s paradigm (see their note 8). No explicit claim was made about their significance.
4.3 Savalons
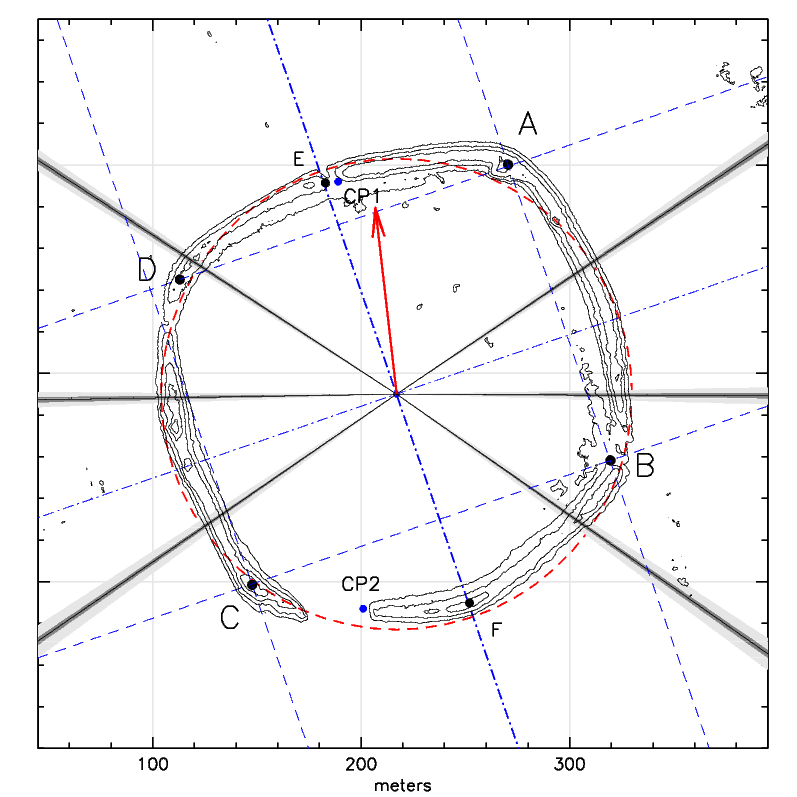
The DEM contour plot for Savalons is presented in Fig. 7. The orientation was validated using two check-points placed 205 meters apart at the NW and SW openings (marked as CP1 and CP2, respectively). The derived azimuth is 176.70.1 degrees, which nicely matches the value measured on the DEM (176.60.3 degrees). As anticipated, this site differs substantially from the other two, in that it does not have a clear quadrangular shape. Although four corners (marked as A, B, C and D in Fig. 7) can be identified, the sides present marked bendings alternated by rectilinear segments. This is particularly evident in the southern side of the embankment.
ID AB 160.870.34 -0.30 -41.940.24 CB 70.840.28 +1.43 +13.900.22 DC 166.690.38 -0.29 -43.490.24 DA 70.720.28 +1.42 +13.980.21 AC 211.340.31 -0.28 -37.260.24 DB 112.780.24 +0.20 -15.830.26 BA 340.870.34 +2.48 +43.080.16 BC 250.840.28 -0.01 -13.670.24 CD 346.690.38 +2.73 +44.860.21 AD 250.720.28 -0.01 -13.750.24 CA 31.340.31 +2.61 +38.450.19 BD 292.780.24 +1.62 +16.510.16
The earthwork appears to be roughly inscribed in a circle with a diameter of about 226 meters (dashed circle) and is characterized by a rough symmetry axis passing through the center of this circle. The position of this axis can be estimated using a numerical procedure based on the available DEM data. Very briefly, the best fit axis is found numerically, with a brute-force procedure that maximizes the match between the collection of the original embankment centroids and their axially symmetric images. The resulting azimuth is 161.00.4 degrees. For convenience, we marked with E and F the positions where this axis intersects the highest points on the embankment.
An independent estimate can be obtained considering the azimuths of the segments AB, CB, DC and DA. These are reported in Table 6, together with the horizon altitude and the implied refraction corrected declination. Excluding the deviant case of DC, the average azimuth is 160.810.18 degrees, which is fully consistent with the above value222In this calculation the directions perpendicular to CB and DA were considered.. We note that the angles and differ by less than 0.2 degrees from the right angle, so that DA and CB are parallel to within 0.1 degrees.
Like in the other two cases, we considered the directions defined by the two diagonals AC and DB. Their azimuths are shown in Table 6. A quick inspection reveals that there is no match with any of the reference values listed in Tables 2 and 3. Interestingly, this holds even considering the directions defined by segments like FB, FA, FD and so on. We therefore conclude that there is no astronomically significant alignment for this site.
5 Discussion and conclusions
Although they are all placed within a radius of about 5 km, the three sites examined in this paper do not show common orientations. In addition, none of the sites presents statistically significant alignments to relevant solar or lunar directions. These facts imply that these earthworks, at least in their current shape, were not erected following astronomical criteria, which would naturally provide a unifying schema. The most likely conclusion is that the orientation of the sites was dictated by other considerations and constraints, plausibly related to the local geomorphological properties of the environment.
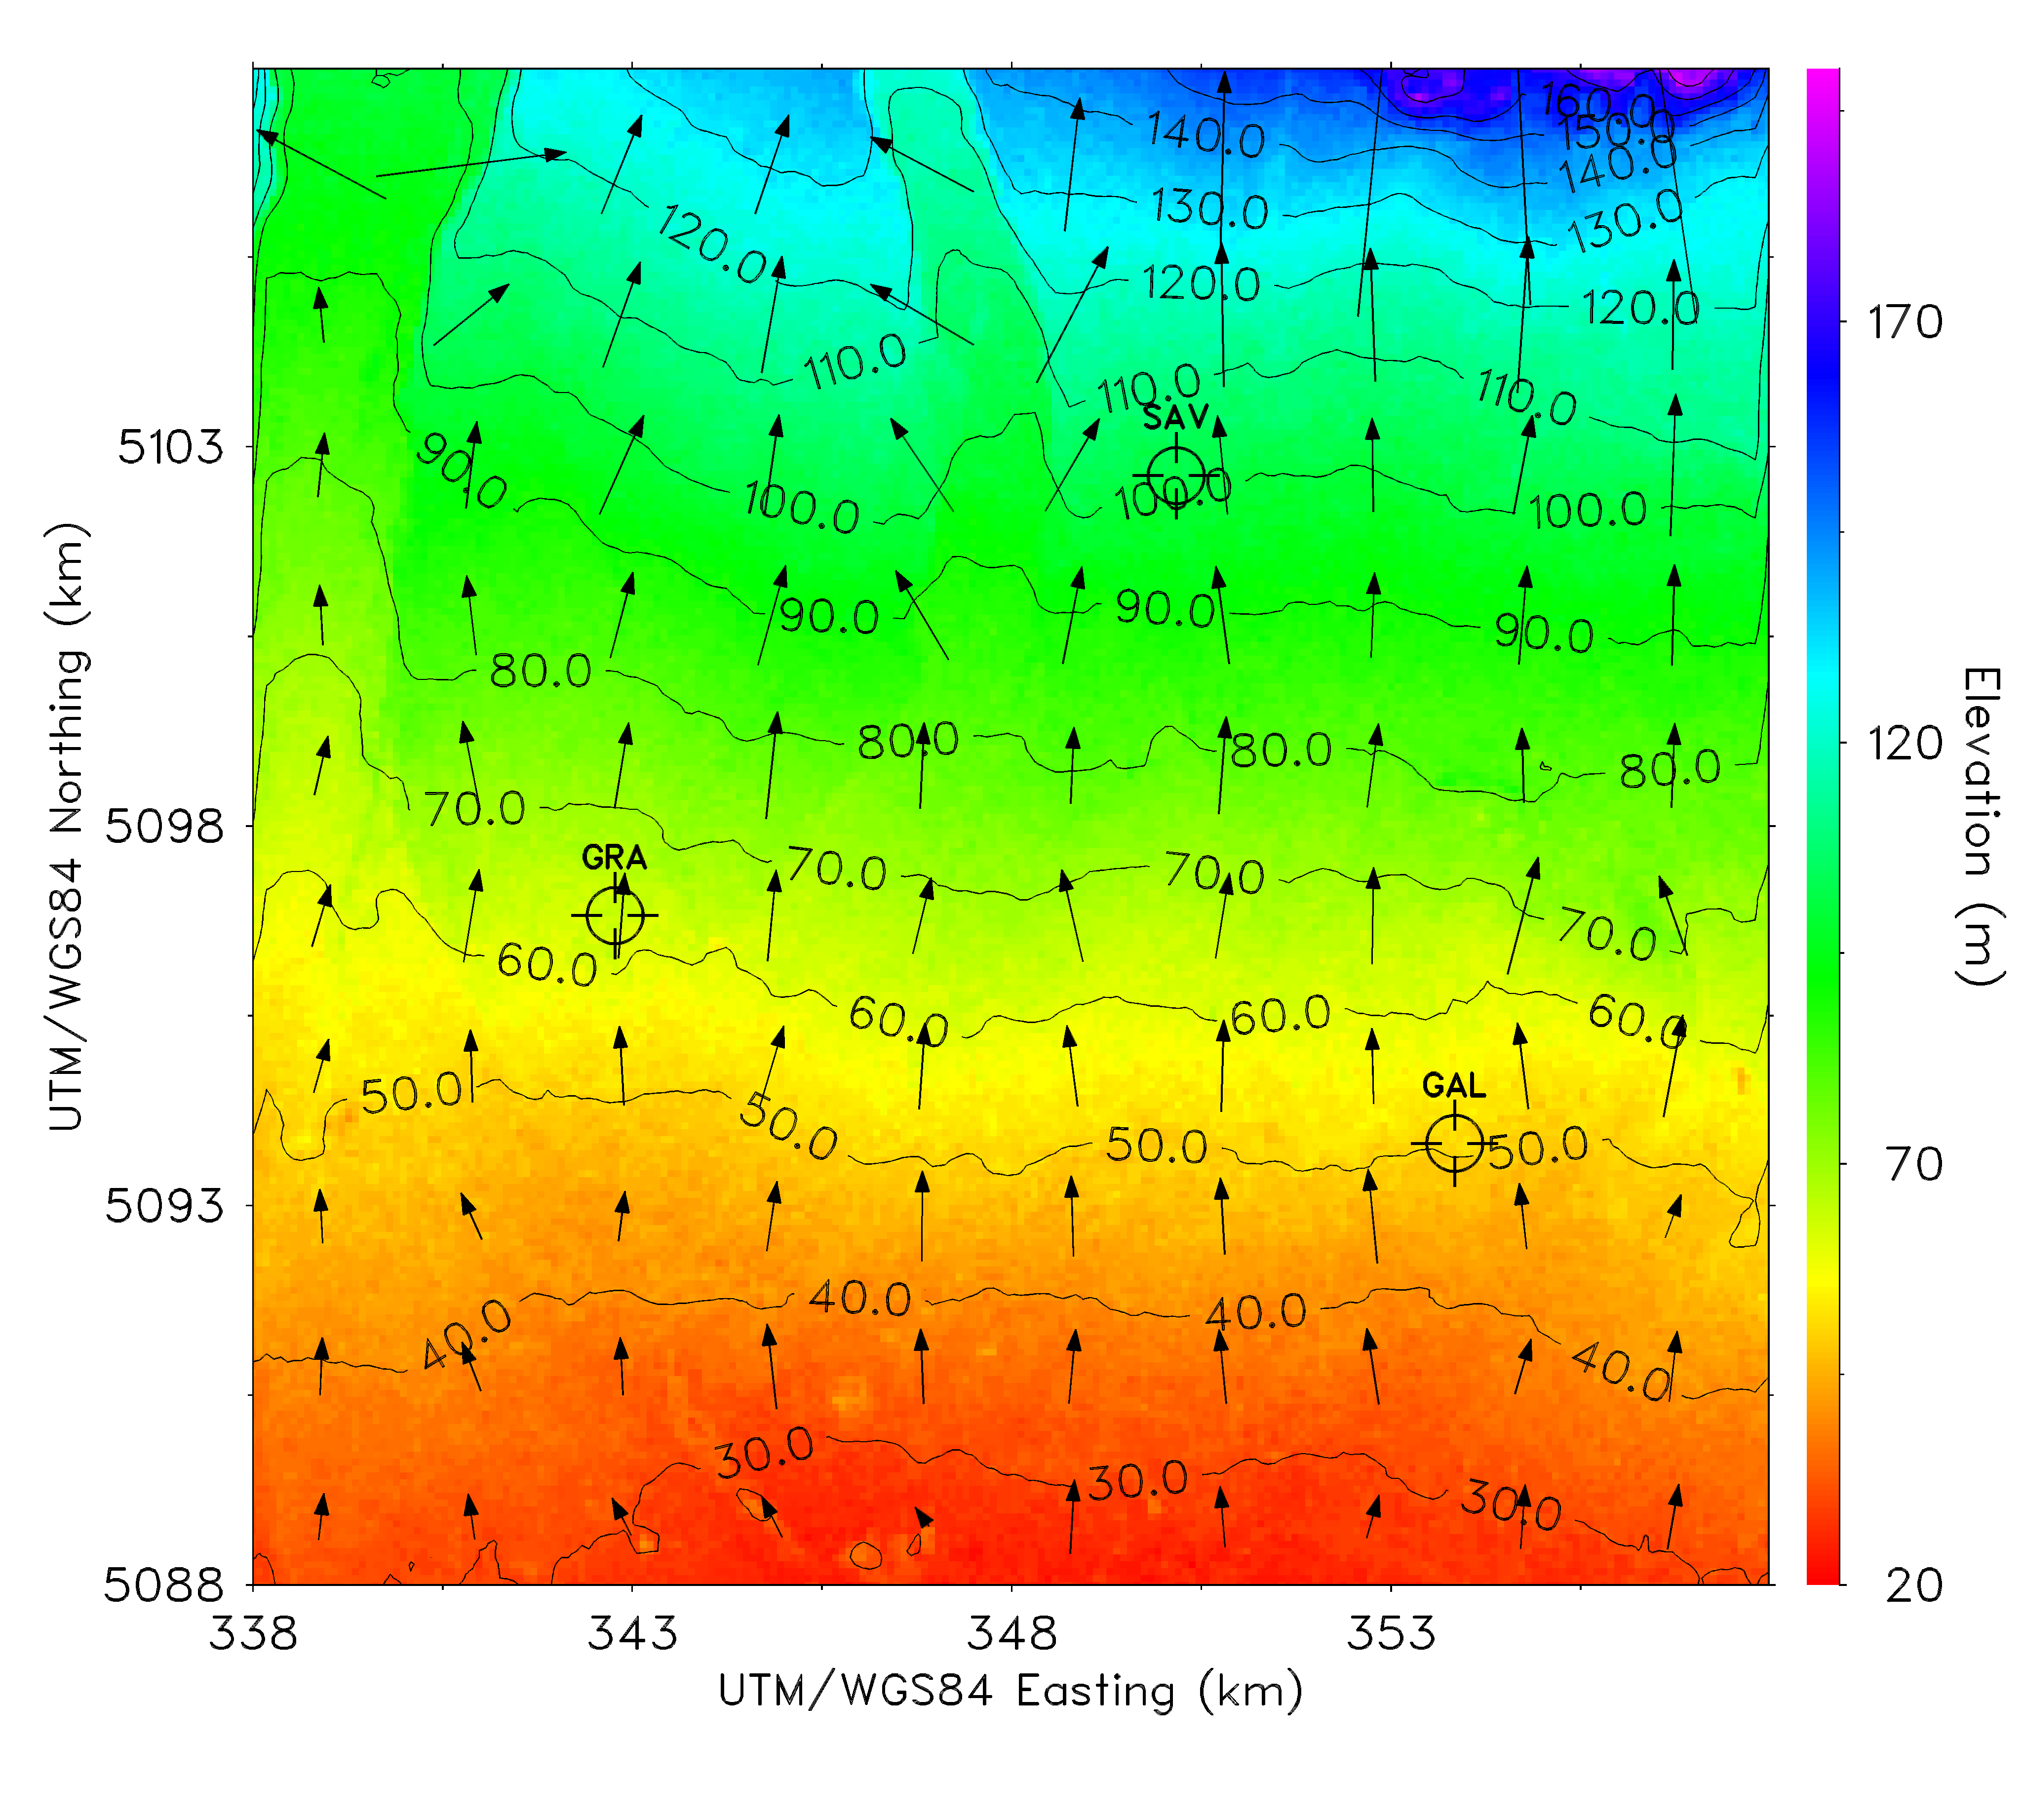
In her review of the Friulian castellieri, Càssola Guida ([1981], p. 16) discussed the orientation aspects of the three sites examined in this paper, commenting that they all share a common feature, i.e. a rough alignment of their corners along the NS, EW direction. Càssola Guida ([1981]) also notes that in the Friulian plain all rivers and water streams flow in the NS direction and, therefore, the observed orientations may have been designed to guarantee proper draining, especially in the case of floods. The deviations from the underlying criterion are attributed to local morphological variations.
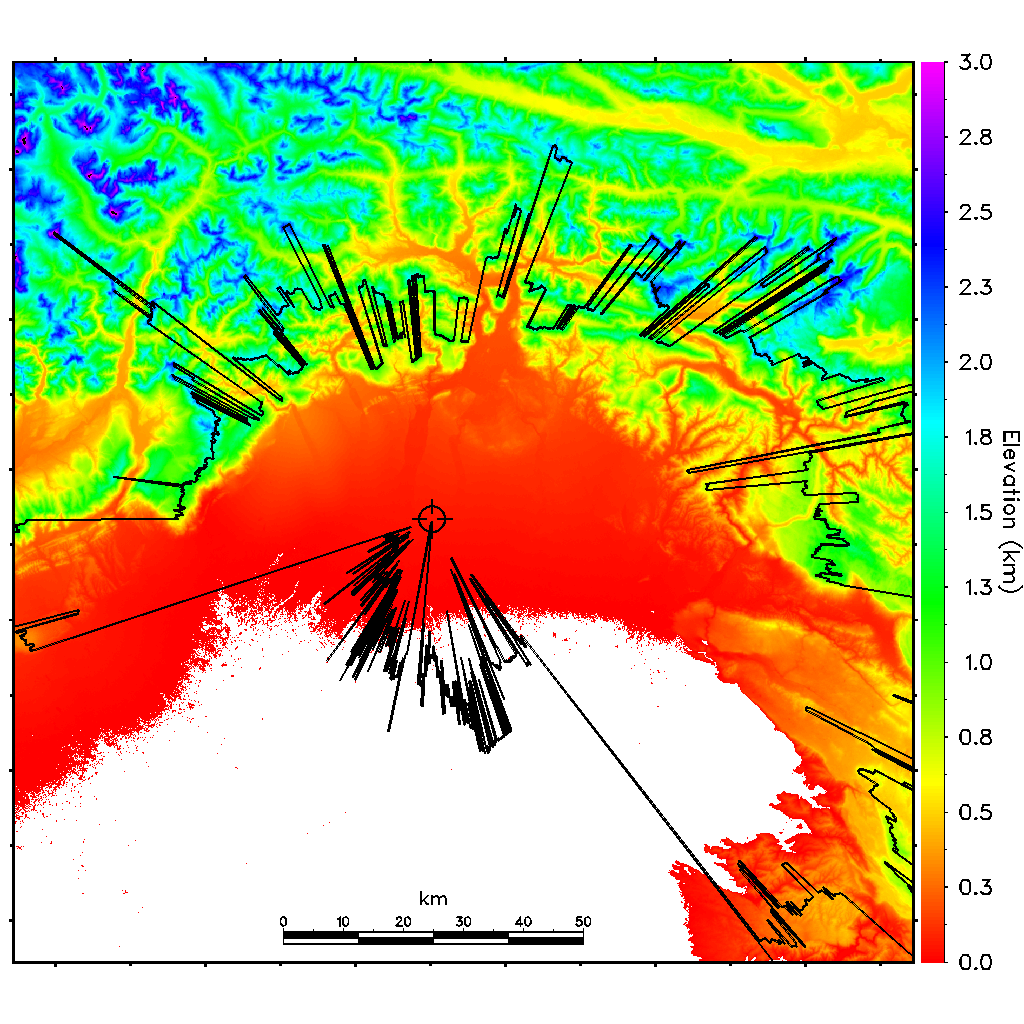
For assessing this idea in a more quantitative way, we derived the gradient map of the high Friulian plain using the SRTM data (90 m resolution). The gradient was computed as the maximum slope of best fit planes on a 22 km2 (490 SRTM pixels) grid. The result is presented in Fig. 8, which displays also the position of the three sites. Although small variations are seen, the average gradient is definitely aligned with the NS direction. The largest deviations are seen to the north (due to the rising of a glacially formed moraine) and to the west (caused by the depression associated to the Tagliamento river bed). The local gradients (in m km-1) and gradient azimuths (in decimal degrees), calculated within squares of 22 km2 and 11 km2 centered on the sites, are presented in Table 7. The gradient azimuths (22 km2) are indicated with an arrow in Figs. 5, 6 and 7.
Although the SRTM resolution is not sufficient to establish the local slopes at scales below 1 km, it is clear that the gradient azimuths at the three sites are very similar333It is worth noting that, on such small scales, the local gradient is much more subject to human activities than on large scales, and what is measured today may differ substantially from the values at construction time.. The observed variations are much smaller than those seen, for instance, in the azimuths of the DC sides (see Figs. 5, 6 and 7). One common feature between the sites is that none of their sides is perpendicular to the gradient direction (a possible exception is the portions of the Savalons embankment indicated as CF in Fig. 7, but this is anyway downstream). This suggests that, indeed, water draining may have been a relevant aspect while planning the earthworks.
22 11 Galleriano 5.10.1 -8.81.2 5.30.3 +5.23.3 Gradisca 5.40.1 +3.71.3 4.00.4 +2.35.6 Savalons 6.00.1 -6.51.0 5.10.3 +0.13.6
In this respect it is important to note that the azimuth of the cardines in the Roman centuriation of this area (the ager of Aquileia, about 35 km to the south) is 158 degrees (Prenc [2002]). This corresponds to an inclination of 22 degrees with respect to the NS direction (and hence with the average gradient direction). This ensured that both cardines and decumani (forming the orthogonal centuriation grid) would have significant slopes for an efficient water drainage. This azimuth is close to that determined here for the symmetry axis of Savalons, and not too different (in terms of resulting slope) from the AB and DC sides of Galleriano and Gradisca.
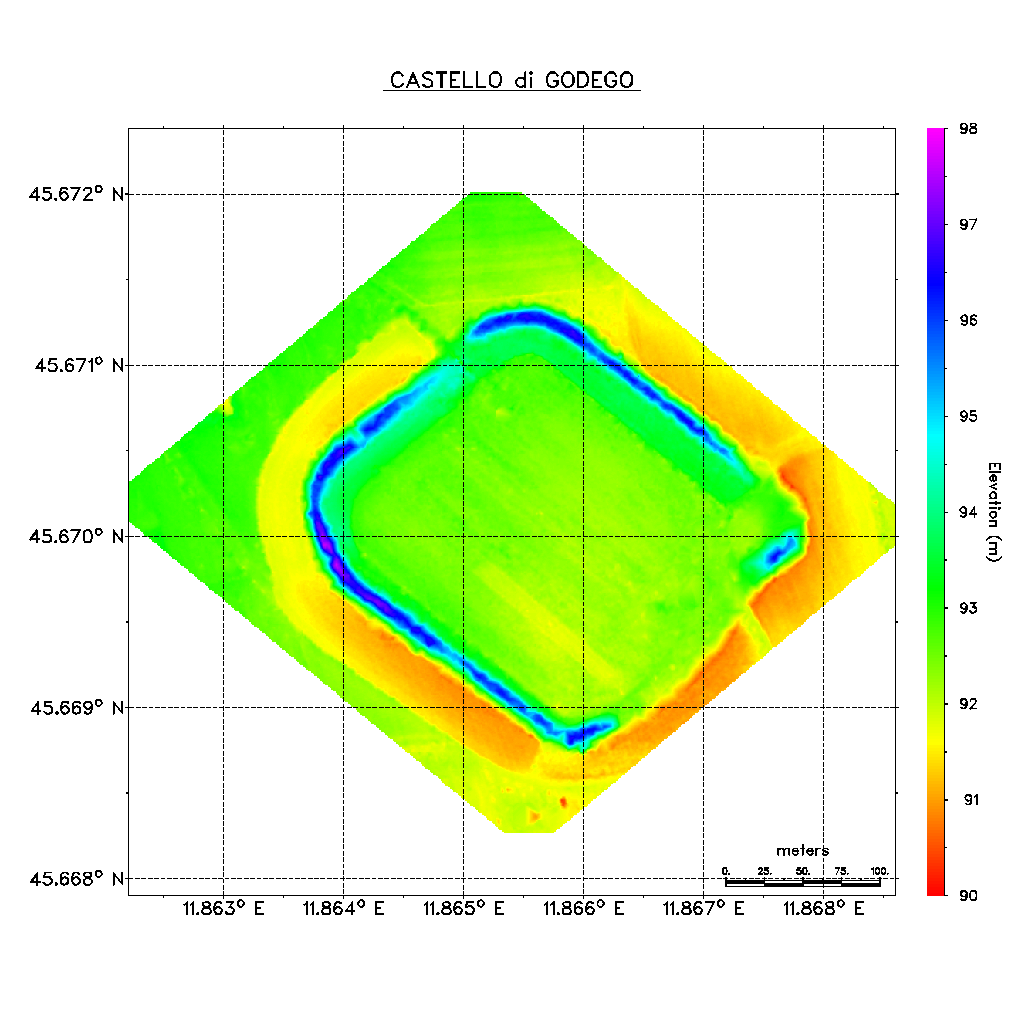
Because of some similarities shared with the Friulian earthworks and the attention it received in the astronomical context (see for instance Romano [1992]), it is worth discussing here the case of Castello di Godego. This earthwork is located in the neighboring Veneto region (longitude 11.8654E, latitude 45.6701N; see Fig. 1) and it is dated back to the Bronze Age (Bianchin Citton [1989]). The shape of the embankment is quadrangular, with sides of 200-230 meters. The corners are roughly aligned with the cardinal directions. Romano ([1981]) studied its orientation, concluding that the sides point to the sun rise and setting at the solstices, while the major diagonal is well aligned to the EW direction. The results of that study are also included in AR86. These claims were debated by archaeologist Bianchin Citton ([1991]), who excluded that astronomical criteria were prioritary in the construction of this and other similar sites444The Friulian castellieri are cited by Bianchin Citton ([1991]) in this context, although no mention is made to any specific site.. The findings of Romano ([1981]) were questioned based on a number of arguments by Lupato ([2000]), to which we refer the reader for a detailed account. Here we will restrict the discussion to the comparison with the Friulian sites presented in the article and its implications on our conclusions.
To ensure a homogeneous analysis, we retrieved the LIDAR digital elevation data from the HELICA digital archive (resolution 1m) and we run the same numerical procedures used for the other sites. The DEM is presented in Fig. 14 and the contour plot is shown in Fig. 9, together with the reference sun directions (see Table 2, last row) and the best fit directions. These are listed in Table 8, together with the horizon and refraction corrected declinations. For comparison, the AR86 data are also included.
AR86 ID AB 127.560.17 -0.15 -25.890.20 124.01.0 -23.5 CB 45.470.33 +1.16 +29.910.25 - - DC 125.970.15 -0.13 -24.880.19 125.01.0 -24.1 DA 48.850.45 +0.76 +27.570.36 54.01.5 +23.7 AC 172.800.44 -0.16 -44.750.16 - - DB 89.860.31 +0.32 -0.100.26 90.02.5 0.0 BA 307.560.17 +2.53 +26.950.14 304.001.0 +23.5 BC 225.470.33 +0.46 -29.430.23 - - CD 305.970.15 +2.42 +25.870.14 305.01.0 +24.1 AD 228.850.45 +0.39 -27.510.31 234.01.5 -23.7 CA 352.800.44 +3.56 +47.100.15 - - BD 269.860.31 +1.51 +0.690.26 270.02.5 0.0 Note: The errors of the AR86 azimuths are from Romano ([1981]).
A coarse inspection to Fig. 9 reveals that the SE side (which we indicate as CB ) was almost completely erased555Note that the map orientation in Bianchin Citton ([1989]) is incorrect (see her Figs. 2 and 5). and it is therefore very difficult to study. In the best fit procedure we used the data of the surviving portion close to the eastern corner and a small portion of the southern corner. We remark that the result is unreliable and cannot be used in the analysis; we list it only for the sake of completeness. The case of the NW side (here indicated as DA) is also rather problematic, because the embankment was significantly modified in the portion close to the northern corner. On the contrary, the status of the other two sides (AB and DC) is reasonably good and the azimuth estimates are fairly accurate.
For these two sides, the AR86 azimuths differ from ours by 3.6 degrees (AB) and 1.0 degrees (CD), and this translates into significant declination discrepancies. In particular, our values are statistically inconsistent with solstitial alignments. The deviation is even more significant for the sun setting directions, especially for the SSSS (CD and BA), for which the horizon altitude (neglected in AR86) is substantial (see also the discussion in Lupato [2000]). The AC diagonal deviates from the NS direction by 7.20.4 degrees, while the DB diagonal lies to within 0.10.3 degrees from the EW direction (similarly to what is reported by AR86). However, the eastern corner is in an extremely bad shape. While in our case this was determined as a best fit intersection position, it is not entirely clear how this was achieved in the original work by Romano ([1981]).
The present analysis confirms the approximate corner alignment to the cardinal directions (see for instance Bianchin Citton [1989]), which is more accurate than in the Friulian sites examined in this study. On the other hand, the new azimuth determinations and horizon corrections presented here do not confirm the accuracies claimed for the alignments to the solar standstills.
Like in the case of the Friulian sites, it is important to consider the orientation in the context of the local environment. Balista ([1989]) reports an average slope of 5 meters km-1 for the area surrounding the earthwork, with a NW-SE gradient direction, concluding that this is parallel to the long sides of the earthwork. This fact was also noted by Lupato ([2000]), who argued that the orientation may be dictated by drainage considerations666Lupato ([2000]) also argued that the shape of the embankment may have been substantially modified in modern times. This matter needs to be settled on archaeological grounds..
In this respect we note that the short sides (BC and AD) are almost perpendicular to the long sides (AB and CD). Therefore, if it is true that aligning the long sides to the maximum gradient direction would maximize the slope along them, it would almost minimize that along the short ones. This would be at odds with the drainage hypothesis. For a more quantitative study we ran a gradient analysis similar to the one presented for the Friulian sites. The local gradient, computed in a 22 km2 area, is 4.20.2 m km-1, with an azimuth of +151.02.2 degrees. This direction is indicated by the arrow in Fig. 9. Clearly, the sides of Castello di Godego are all significantly inclined with respect to the gradient direction reported above, similarly to what is observed in the Friulian sites. This strengthens the conclusion that the observed orientation may indeed have been driven by practical needs related to the water flow.
One obvious limitation of the present work is that the sample of castellieri we could examine is small. Future archaeological research on the Friulian plain may enable a more statistically significant analysis. None the less, in the light of the above considerations, we argue that a connection between the observed orientations and relevant solar or lunar directions is highly improbable for these sites. The lack of a consistent orientation pattern in the studied earthworks strongly indicates that, at least in their current configuration, they were not erected following common astronomical criteria.
Acknowledgements.
This paper is dedicated to the memory of G. Romano, who first introduced F. P. to the history of astronomy. The authors are indebted to D. Plos, V. Dereani, C. Peloso and F. Tadina at HELICA for the high resolution LIDAR survey performed on the Savalons site and the valuable support given in the treatment of the data. The authors are grateful to S. Marcuzzi for his kind help during the preparation of the LIDAR survey, and to M. Calosi and D. Girelli for their collaboration in the analysis of the total station survey data. F. P. wishes to thank profs. A. Aveni, E. Milone, C. Ruggles and the late prof. G. Romano for their encouragement and useful suggestions. The authors are also thankful to Dr. R. D. Sampson, for providing them with his atmospheric refraction measurements, and to G. Lupato for the stimulating discussions on the site of Castello di Godego. Data analysis and visualization were performed using software written by the authors.References
- [1986] Aveni, A. F. & Romano, G., Archaeoastronomy 10 (Supplement to Journal for the History of Astronomy 17): S24 (AR86)
- [1989] Balista, C., 1989, Quaderni di Archeologia del Veneto, V, CEDAM, p. 253
- [1989] Bianchin Citton, E., 1989, Quaderni di Archeologia del Veneto, V, CEDAM, p. 216
- [1991] Bianchin Citton, E., 1991, in Colloquio internazionale di Archeologia e Astronomia, G. Romano & G. Traversari Eds., RdA Supplement, no. 9, p. 30
- [2009] Borgna, E. & Càssola Guida, P., 2010, in A connecting sea: maritime interaction in Adriatic prehistory, Staso Forenbaher (Ed.), BAR International Series 2037, 89
- [2013] Borgna, E., Corazza, S. & Simeoni, G., 2013, in Atti del Forum per la ricerca archeologica nel Friuli-Venezia Giulia, Aquileia, January 2011, p. 34
- [1981] Càssola Guida, P., 1980, in Castelli del Friuli, Vol. 2, Storia ed evoluzione dell’arte delle fortificazioni in Friuli, Tito Miotti Ed., p. 13
- [2006] Càssola Guida, P., 2006, in Tracce archeologiche di antiche genti - La protostoria in Friuli, Circolo Culturale Menocchio - Montereale Valcellina. 17-50
- [2003a] Càssola Guida, P. & Corazza, S., 2003a, Il tumulo di Santo Osvaldo, Università di Udine (ed.)
- [2003b] Càssola Guida, P. & Corazza, S., 2003b, Dai tumuli ai castellieri 2003b, 74, 650
- [2003c] Càssola Guida, P. & Corazza, S., 2003c, Dai tumuli ai castellieri 2003c, 74, 654
- [2004a] Càssola Guida, P. & Corazza, S., 2004a, Dai tumuli ai castellieri 2004, 75, 547
- [2004b] Càssola Guida, P. & Corazza, S., 2004b, Dai tumuli ai castellieri 2004, 75, 525
- [2005] Càssola Guida, P. & Corazza, S., 2005, in Carlo Marchesetti e i castellieri 1903-2003, G. Bandelli and E. Montagnari Kokelj (eds.), 221
- [2009] Càssola Guida, P. & Corazza, S., 2009, in Notiziario della Soprintendenza per i Beni Archeologici del Friuli-V.G., 2/2007, 144
- [2000] Corazza, S., 2000, Aquileia Nostra, 71, 645
- [1976] di Caporiacco, G., 1976, Udine e il suo territorio. Dalla preistoria alla latinità, Arti Grafiche Friulane, Udine, 11
- [2007] Farr, T. G., et al.: 2007, Rev. Geophys. 45, RG2004
- [2000] Lupato, G., 2000, Astronomia UAI, N. 1, 3
- [1988] Menis, G. C., 1988, History of Friuli, Grafiche Editoriali Artistiche Pordenonesi, Pordenone, 16
- [2011] Patat, F., 2011, AN, 332, 743
- [2009] Pimenta, F., Tirapicos, L. & Smith, A., 2009, Archaeoastronomy, 22, 1
- [2002] Prenc, F., 2002, Antichità Altoadriatiche, 52
- [1943] Quarina, L., 1943, Ce fastu?, 19. 54-86
- [1981] Romano, G., 1981, Mem. S.A.It, 52, 627
- [1992] Romano, G., 1992, Archeoastronomia Italiana, Cooperativa Libraria Editrice Università di Padova, 222
- [2003] Sampson, R. D., Lozowski, E. P., Peterson, A. E. & Hube, D. P., 2003, PASP, 115, 1261
- [2005] Sampson, R. D., Lozowski, E. P. & Machel, H. G., 2005, Applied Optics. 44, 5652
- [1990] Schaefer, B. E. & Liller, W., 1990, PASP, 102, 796
- [2011] Simeoni G. & Corazza, S., 2011, Di terra e di ghiaia - La protostoria del Medio Friuli tra Europa e Adriatico, La Grame (Ed.)
Appendix A Appendix A - Horizon altitude, Refraction correction and error estimates
The apparent declination of a celestial object observed from a site at latitude can be calculated from its azimuth and apparent altitude with the following formula:
| (1) |
After indicating with the true altitude of the object, we introduce the astronomical refraction defined as . One can demonstrate that the true declination can be derived correcting the apparent declination given by Eq. 1 as follows:
| (2) |
This equation can be solved for analytically (considering that and ), or numerically (with an iterative process). For archaeoastronomical applications in which the horizon altitude is only a few degrees (i.e. 0), one can derive the true declination via the following approximate expression:
| (3) |
For the atmospheric refraction we adopted the classical expression:
| (4) |
where is expressed in degrees. The parameter is the refraction at =0, which in the above formulation is given by:
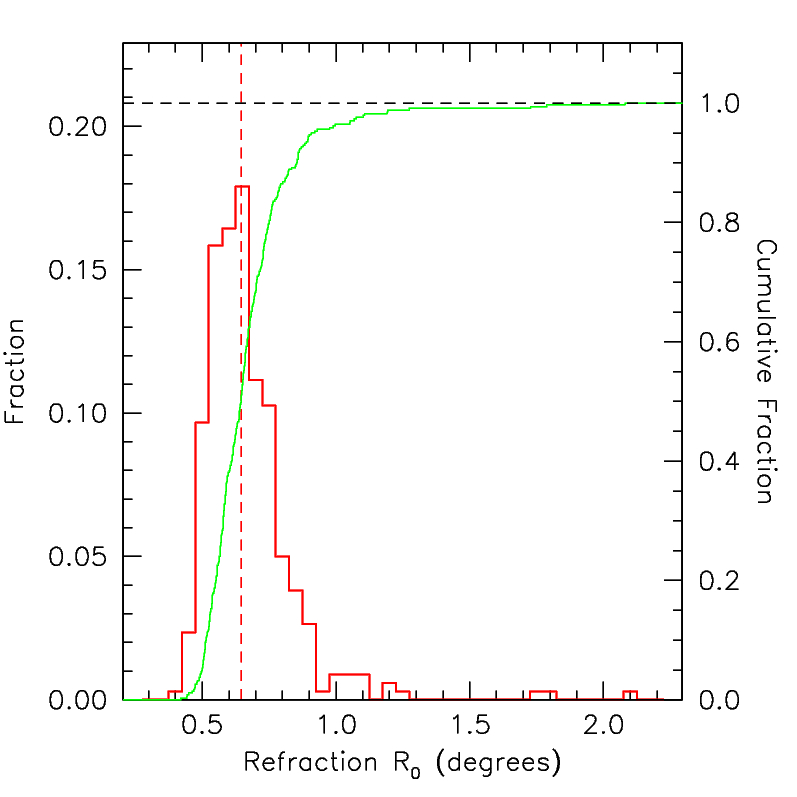
where is the atmospheric pressure (in mb) and T is the temperature (in K). For typical values (T=293 K, P=1000 mb) this gives 0.5 degrees. Eq. 4 provides a reasonably good approximation to the altitude dependence for 15 degrees (Sampson, Lozowski & Machel [2005]). However, astronomical refraction close to the horizon is known to be very variable and one cannot assume a single constant value (Schaefer & Liller [1990]). For instance, Sampson et al. ([2003]) report an average value of 0.67 degrees and a standard deviation of 0.17 degrees, with a range of 0.4 to 2.1 degrees. They also show that there are systematic differences between sunrise and sunset (see also Schaefer & Liller [1990]) and that climatic trends play a role.
To account for this variability, we have adopted the distribution derived from the Sampson et al. ([2003]) data set, which includes 348 measurements obtained during both sunset and sunrise, under a wide range of atmospheric conditions (i.e. pressure, temperature and vertical temperature gradient). The distribution is plotted in Fig. A10.
The rms error on the declination was estimated via Monte Carlo simulations that included the uncertainties on measured azimuths (), horizon altitudes () and refraction (). While the random realizations of azimuths and altitudes were generated with a Gaussian distribution, the refractions were drawn from the Sampson et al. ([2003]) distribution. The refraction at altitude was estimated using Equation 4.
When predicting the relevant azimuths (e.g. sunrises and sunsets at solstices and equinoxes), the uncertainties were estimated keeping the sun declination fixed at its nominal value (, 0, ), while horizon altitudes and refractions were generated as described in the previous paragraph.
Refraction and horizon altitude corrected values for declinations and azimuths were derived numerically, using the horizon profile computed as described in Patat ([2011]).
Appendix B Appendix B - Digital Elevation Models