T. Sato et al.Suzaku X-ray Observation of 3C 391 \Received \Accepted
ISM: individual objects (3C 391, G31.9+0.0) — ISM: supernova remnants — X-rays: ISM
Discovery of Recombining Plasma in
the Supernova Remnant 3C 391
Abstract
Recent X-ray study of middle-aged supernova remnants (SNRs) reveals strong radiative recombination continua (RRCs) associated with overionized plasmas, of which the origin still remains uncertain. We report our discovery of an RRC in the middle-aged SNR 3C 391. If the X-ray spectrum is fitted with a two-temperature plasma model in collisional ionization equilibrium (CIE), residuals of Si\emissiontypeXIV Ly line at 2.006 keV, S\emissiontypeXVI Ly line at 2.623 keV and the edge of RRC of Si\emissiontypeXIII at 2.666 keV are found. The X-ray spectrum is better described by a composite model consisting of a CIE plasma and a recombining plasma (RP). The abundance pattern suggests that the RP is associated to the ejecta from a core-collapse supernova with a 15\Mo progenitor mass. There is no significant difference of the recombining plasma parameters between the southeast region and the northwest region surrounded by dense molecular clouds. We also find a hint of Fe\emissiontypeI K line at 6.4 keV ( detection) from the southeast region of the SNR.
1 Introduction
The standard picture of thermal plasmas associated with supernova remnants (SNRs) is that the state of the gas appears to be either an ionizing plasma (IP) for young or intermediate aged SNRs (e.g. Kepler’s SNR, Kinugasa and Tsunemi 1999), or plasma in collisional ionization equilibrium (CIE) for old SNRs (e.g. 30 Dor C, Yamaguchi et al. 2009). However, recent X-ray observations have revealed several SNRs are in recombination-dominated phase (IC 443, Yamaguchi et al. 2009; W49B, Ozawa et al. 2009; G359.10.5, Ohnishi et al. 2011; W28, Sawada & Koyama 2012; W44, Uchida et al. 2012; G346.60.2, Yamauchi et al. 2013). These recombining plasmas (RPs) have an ionization temperature () higher than the electron temperature (); is a useful parameter defined to be the temperature which would be required to ionize the plasma to the same degree assuming that the plasma is in CIE. The discovery of RPs at SNRs requires us to modify the conventional evolution scenario of SNRs.
3C 391 (G31.9+0.0) is a bright Galactic SNR displaying diffuse X-ray emission close the center of its radio shell and is classified as a mixed-morphology SNR (MM-SNR) (Reynolds & Moffett 1993). The radio shell with a radius of \timeform5’ has the shape of a partial circle in the northwest (NW) part and there is a faint extended structure in the southeast (SE) region. This suggests a break-out morphology into a lower density region from the main SNR shell. The detection of two OH maser spots at 1720 MHz from 3C 391 by Frail et al. (1996) indicates an interaction with molecular clouds. They also reported a possibly extended OH emission at the edge of the NW shell. The velocity of two maser spots (105 and 110 km s-1) agrees with a previous study of H\emissiontypeI absorption velocity (Radhakrishnan et al. 1972). H\emissiontypeI observations show that the distance to 3C 391 is between 7.2 kpc and 11.4 kpc, assuming a distance to the Galactic center of 8.5 kpc. The surrounding molecular gas of 3C 391 can be traced by CO (J 10) emission at velocities from 90 to 110 km s-1 (Wilner et al. 1998). The results of the CO observation support the early expansion of 3C 391 inside a dense molecular cloud and the breakout of the blast wave to the SE region.
Knowledge of the astrophysical environment around SNRs is of great importance in order to reveal the origin of the RPs in the context of the SNR evolution. Interestingly, most of the RP SNRs are MM-SNRs that interact with molecular clouds and are associated with bright GeV gamma-ray emissions (IC 443, Abdo et al. 2010a; W28, Abdo et al. 2010b; W49B, Abdo et al. 2010c; W44 Abdo et al. 2010d). While some young SNRs show bright TeV gamma-rays (RX J1713.7-3946, Aharonian et al. 2004), middle-aged SNRs are usually found to be predominantly emitting in the GeV energy band. A significant excess (13) of GeV gamma-rays at the position of 3C 391 with Fermi-LAT was reported by Castro & Slane (2010). The radio rim of the NW region and the closer OH maser spot are \timeform4’ apart from the GeV emission peak in the test statistic map. The GeV emission associated with 3C 391 probably arises from accelerated cosmic rays in the shock-heated molecular clouds. The interaction with the molecular gas and the association of the gamma-ray emission would be the keys for understanding the morphology and spectrum of the thermal plasmas in RP SNRs.
In this paper, we report on an X-ray study of SNR 3C 391, taking advantages of low and stable in-orbit background and high sensitivity of the Suzaku X-ray observatory (Mitsuda et al. 2007). We construct a model for the galactic background emission to complement the poor photon statistics, then we fit several plasma models to the X-ray spectrum of 3C 391. Our observation data is a part of the Suzaku Key Project to search for RPs in galactic SNRs. Section 2 describes the observation and data reductions and Section 3 presents the data analysis. Then, we interpret our results in Section 4 and conclude in Section 5.
2 Observations and Data Reductions
We observed SNR 3C 391 for an exposure time of 100 ks with the Suzaku satellite in 2010 October 22–24 during the AO5 cycle. This observation was performed as one of the Key Project observations aimed at systematic search for RPs. The pointing position was (, ) = (282.3812, 0.9417). The observation instrument we used is the X-ray Imaging Spectrometer (XIS; Koyama et al. 2007), X-ray charge coupled device (CCD) cameras on the focal plane of the X-Ray Telescope (XRT; Serlemitsos et al. 2007). XIS 0 and 3 are front-illuminated (FI) CCDs, and XIS 1 is a back-illuminated (BI) CCD. The XIS was operated with the normal-clocking, full-frame mode. Since in-orbit radiation damage has degraded the charge transfer efficiency of the XIS, the spaced-row charge injection technique is applied for the XIS.
We reprocessed the XIS data with the latest calibration results instead of using the cleaned events. We used the HEADAS software of version 6.13 (Suzaku software of version 20). The calibration database (CALDB) released on 2013 March was used for data processing. We adopted standard event selection criteria for Suzaku XIS data processing. We excluded events in the intervals of the South Atlantic Anomaly, low-Earth elevation angles less than 5 degrees and the day earth elevation angle less than 20 degrees. After the data screening, the effective exposure time is about 99.4 ks. The data of the two editing mode, 33 and 55 pixel events, were combined, and then we removed flickering and hot pixels of the XIS.
3 Analysis and Results
3.1 X-ray Image
X-ray diffuse emission is clearly detected in the central region of the remnant and is encompassed by the radio rim in the NW. Figure 1 shows an X-ray image of 3C 391 (XIS 3 only), after correcting the vignetting effect and subtracting the instrumental background (the so-called non X-ray background, or NXB). The NXB was estimated by using xisnxbgen (Tawa et al. 2008).
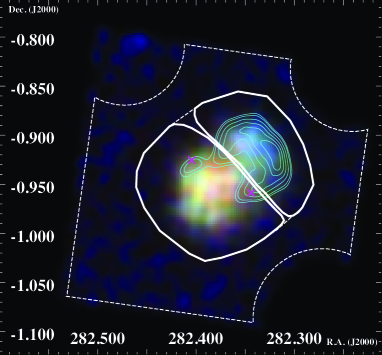
The northwest (NW) region associated with the radio rim has harder X-rays than the southeast (SE) region. It indicates the difference of the thermal plasma or circumstellar matters between those regions. We thus divided the image into two regions: the NW and SE region.
3.2 Background Estimation
3C 391 is located on the Galactic plane, and hence the major background component is the Galactic ridge X-ray emission (GRXE), whose X-ray flux strongly depends on the position (e.g. Uchiyama et al. 2011, 2013). Since the photon statistics of the background region (surrounding region of 3C 391 in the same XIS field) is not good enough due to the limited exposure time and the effective area, subtracting the background data from the source data results in large statistical errors in the SNR spectrum. We therefore constructed a background model for the GRXE. We extracted the background spectrum from the region excluding 3C 391 in the same field of view, and fitted the GRXE model compiled by Uchiyama et al. (2013) to the spectrum. In this background region, a few percent level of photon contamination from 3C 391, which is due to the leakage of the XRT point spread function into the background region, cannot be neglected.
3.2.1 Phenomenological Model Fit
In order to construct the background model, we need to make phenomenological models both for the source and the background regions. We extracted spectra from the whole 3C 391 region and the background region after subtracting the NXB. After the vignetting correction, we subtracted the background spectrum from the 3C 391 spectrum. The redistribution matrix file (RMF) and the ancillary response file (ARF) were created by xisrmfgen and xissimarfgen, respectively (Ishisaki et al. 2007). We used the spectral analysis software XSPEC version 12.8.1 (Arnaud 1996). We simultaneously fitted all the XIS 0, 1, and 3 data with a single model. The energy band from 1.7 to 1.8 keV were ignored because of the calibration uncertainty around the Si K edge.
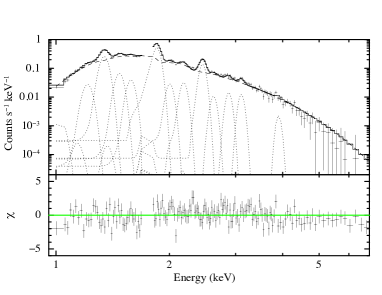
We then modeled the spectra by using a phenomenological model: the continuum X-ray emission is described by bremsstrahlung with temperature of and line emissions from various ionized atoms are given by Gaussian lines. The interstellar photoelectric absorption was estimated using the cross sections by Morrison and McCammon (1983) with H\emissiontypeI column density . This phenomenological model successfully reproduces the data ( 404.01/307). Figure 2 and table 1 show the best-fit spectrum and parameters, respectively.
| Parameter | bremsstrahlung | |
|---|---|---|
| (1022 cm-2) | 1.900.05 | |
| (keV) | 0.6710.014 | |
| Emission line | energy (keV)† | intensity‡ |
| Ne \emissiontypeX Ly | 1.022 | 1110 |
| Ne \emissiontypeX Ly | 1.211 | 238 |
| Mg \emissiontypeXI K | 1.3410.001 | 1039 |
| Mg \emissiontypeXII Ly | 1.472 | 14.72.6 |
| Mg \emissiontypeXI K | 1.579 | 7.11.9 |
| Si \emissiontypeXIII K | 1.8500.002 | 903 |
| Si \emissiontypeXIV Ly | 2.006 | 3.60.8 |
| Si \emissiontypeXIII K | 2.183 | 3.20.5 |
| S \emissiontypeXV K | 2.4510.002 | 15.90.6 |
| S \emissiontypeXVI Ly | 2.621 | 1.10.4 |
| S \emissiontypeXV K | 2.877 | 1.30.3 |
| Ar \emissiontypeXVII K | 3.107 | 1.020.24 |
| Ca \emissiontypeXIX K | 3.903 | 0.160.13 |
| /d.o.f | 404.01/307 | |
∗ The uncertainties are the 90% confidence range.
† The centroid energies of strong K lines are free because they are fundamentally shifted by the contribution of another faint emission lines.
‡ The units are 10-5 photons cm-2 s-1.
3.2.2 Construction of the Background Model
To make the GRXE model in the 3C 391 region, we fitted a composite model consisting of the GRXE, the cosmic X-ray background (CXB) and the contamination of 3C 391 spectrum to the NXB-subtracted background spectrum. For the CXB, we used a power-law function with a photon index 1.4, which has a flux of 8.2 10-7 photons cm-2 s-1 arcmin-2 keV-1 at 1 keV (Kushino et al. 2002). For the contamination spectrum, we used the phenomenological model given in the previous section (table 1) with the normalization as a free parameter. Uchiyama et al. (2013) composed the GRXE with a foreground plasma (FG), a low temperature plasma (LP) and a high temperature plasma (HP). All these models are thin thermal plasmas in CIE, whose temperatures are designated as , and , respectively. We used the APEC model by Smith et al. (2001). Metal abundances were taken relative to the solar values (Anders and Grevesse 1989). The GRXE also includes a cold matter (CM) emission with neutral iron line (6.4 keV) of equivalent width eV. Thus the GRXE model is given by;
| (1) |
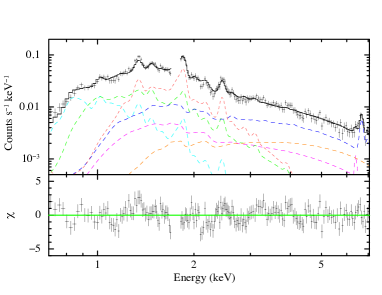
where and are absorptions by the Galactic H\emissiontypeI with column densities for the foreground plasma and GRXE components, respectively. An interstellar absorption of CXB () was taken to be twice of . Following the result of Uchiyama et al. (2013), and were fixed to be cm-2 and 0.59 keV, respectively. Although the foreground plasma has another CIE component with a temperature of keV, we neglected this component because no significant contribution was expected in our energy range. Figure 3 shows the background spectrum with the best-fit background model including contamination spectrum. The best-fit parameters of the GRXE are given in table 2.
| Parameter | LP | HP |
|---|---|---|
| (1022 cm-2) | 1.13 0.10 | |
| (keV) | ||
| Abundance (solar) | ||
| † | 1.5 1.1 | |
| / d.o.f | 458.73/312 | |
∗ The uncertainties are the 90% confidence range.
†Observed photon flux of 6.4 keV in units of 105 photons cm-2 s-1.
3.3 Model Fits to the Whole 3C 391 Spectrum
We fitted several plasma models to the NXB-subtracted spectrum in the entire region of 3C 391. The GRXE model function determined in the previous section was included in the model fitting. The abundances of Ne, Mg, Al, Si, S, Ar, Ca and Fe were free parameters. We first tried the APEC model in the XSPEC package, a single-temperature () optically thin thermal plasma model in CIE state. This model is rejected with a large / d.o.f value (565.83/315).
One of the most prominent residuals is the excess below 1.5 keV. We therefore added another APEC model with metal abundances treated as free parameters. The best-fit metal abundances were all consistent with 1 solar. We hence fixed all the abundances at 1 solar. Then the fit is improved to / d.o.f 397.51/313 (1.27).
In the atomic database of the current plasma codes, the higher Rydberg series of Fe-L lines (1.2 keV) are incomplete (Brickhouse et al. 2000). If we add a 1.2 keV Gaussian line, / d.o.f is well improved from 1.27 to 1.25. The best-fit spectrum and parameters are given in figure 4 and table 3 (left column).
This two-temperature CIE model still leaves significant residuals at Si\emissiontypeXIV Ly line (2.006 keV), hump-like feature at keV and a hint of excess at 6.4 keV. The data excess at the 2.5 keV bump above the applied model is counts s-1 (2.4–2.8 keV). In the background spectrum, the data excess in the 2.4–2.8 keV band is negative and as small as counts s-1. Thus the excess at 2.5 keV in the SNR spectrum, after the background subtraction, is not an artifact due to the background subtraction, but is a real structure. Since the bump energy of keV corresponds to S\emissiontypeXVI Ly line (2.623 keV) and the edge of radiative recombination continuum (RRC) of He-like Si (2.666 keV; Yamaguchi et al. 2009), this is likely due to a recombining plasma (e.g. Sawada and Koyama 2012). We thus applied an NEIJ model in the SPEX version 2.03.03 (Kaastra et al. 1996) for the high temperature component. This model describes a transition plasma that initially in the CIE state with the temperature then only the electron temperature dropped to . The recombination phase is given by the parameter , where and are the number density of electrons and the elapsed time after the electron cooling, respectively.
The fit is largely improved from the two-temperature CIE model. As is shown in figure 4, the Si\emissiontypeXIV Ly line (2.006 keV) and hump-like feature at keV have disappeared, even though a hint of excess at 6.4 keV is still remained. The / d.o.f becomes almost acceptable level of 355.14/315 1.13. The best-fit parameters are summarized in table 3 (right column).
| CIE Plasma | Recombining Plasma | |||
| Parameter | CIE | CIE | CIE | NEIJ |
| (1022 cm-2) | 2.880.08 | 3.13 | ||
| † (1060 cm-3) | 3.2 | 0.092 | 2.8 | 0.18 |
| (keV) | – | – | – | 1.8 |
| (keV) | 0.172 | 0.597 | 0.170 | 0.4950.015 |
| (1011 cm-3 s) | – | – | – | 14.0 |
| Abundance (solar) | ||||
| Ne | 1.9 | 0.7 | ||
| Mg | 0.80 | 0.66 | ||
| Al | 0.80.3 | 0.40.3 | ||
| Si | 0.96 | 0.82 | ||
| S | 1(fix) | 0.85 | 1(fix) | 0.81 |
| Ar | 0.61 | 0.65 | ||
| Ca | 1.00.5 | 1.6 | ||
| Fe | 0.13 | 0.05 | ||
| others | 1(fix) | 1(fix) | ||
| / d.o.f | 389.68/311 | 355.14/315 | ||
∗ The uncertainties are the 90% confidence range.
† Volume emission measure at the distance of 8 kpc, where , and are the electron and proton number densities (cm-3) and the emitting volume (cm3), respectively.
Since the Chandra observation shows that the spectra of 3C 391 has spatial variations with many NEI plasmas (Chen et al. 2004), we examine the excess at around 2.5 keV in the context of a composite plasma model. We made a composite model including all NEI plasmas resolved by Chen et al. 2004. Their emission measures were fixed to their individual values. The ionization timescales determined by Chen et al. 2004 were fixed, and other timescales were free. and abundances were free parameters. We also added the CIE plasma model with a low temperature (0.2 keV). This composite model gives the best-fit reduced of 1.47, leaving the excess of 2.5 keV of counts s-1 (2.4–2.8 keV). Also the excess of 6.4 keV line does not disappear. If we replace the major 2-NEI plasmas with high emission measures (each 20% of the total) with a 1-RP model, the reduced value improves to 1.15. Since the best-fit reduced for the multi-NEI+CIE+RP is not smaller than that of the CIE+RP model, we use the CIE+RP model as the best approximation for the SNR spectra, and proceed with the following analysis and discussion.
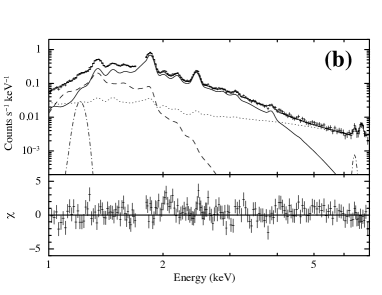
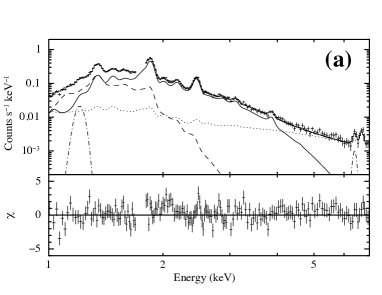
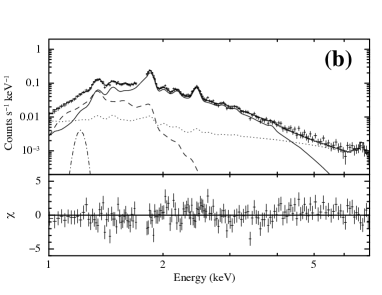
3.4 Spatial Distribution of the Recombining Plasma
In figure 1, we can see significant difference between the NW and SE regions. We therefore analyzed the NW and SE spectra separately using the same model as was applied to the spectrum of the entire region of 3C 391.
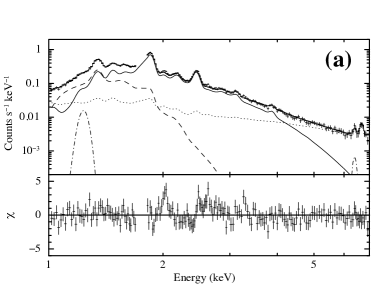
The fit for the NW and SE regions are marginally acceptable with of 333/275=1.21, and 306/266=1.15, respectively. However, we find no significant spectral differences except the possible presence of the 6.4 keV line in NW of which the significance level is and a slightly larger in SE. Figure 5 (a) and (b) show the results of the NW and SE regions, respectively. The best-fit parameters of each region are shown in table 4.
| SE | NW | |||
| Parameter | CIE | NEIJ | CIE | NEIJ |
| (1022 cm-2) | 3.05 | 3.45 | ||
| † (1060 cm-3) | 1.5 | 0.09 | 2.3 | 0.080.02 |
| (keV) | – | 1.6 | – | 2.7 |
| (keV) | 0.184 | 0.500.02 | 0.159 | 0.550.02 |
| (1011 cm-3 s) | – | 14 | – | 152 |
| Abundance (solar) | ||||
| Ne | 1.3 | 0.5 | ||
| Mg | 0.85 | 0.56 | ||
| Al | 0.6 | 0.2 | ||
| Si | 1.1 | 0.62 | ||
| S | 1(fix) | 1.1 | 1(fix) | 0.59 |
| Ar | 0.9 | 0.32 | ||
| Ca | 2.2 | 0.5 | ||
| Fe | 0.08 | 0.5 | ||
| others | 1(fix) | 1(fix) | ||
| ‡ | 2.10.9 | 0.5 | ||
| / d.o.f | 332.72/275 | 306.32/266 | ||
∗ The uncertainties are the 90% confidence range.
† Volume emission measure at the distance of 8 kpc, where , and are the electron and proton number densities (cm-3) and the emitting volume (cm3), respectively.
‡ The units are 10-8 photons cm-2 s-1 arcmin-2. The uncertainties are the 1 confidence range.
4 Discussion
The X-ray spectrum of 3C 391 is represented by two plasma models: a low temperature CIE and a high temperature RP. The CIE plasma is probably emitted by the ISM heated by the blast waves, because it has 1 solar abundances. The abundances of the RP are given in figure 6, together with some theoretical model of Ia (Iwamoto et al. 1999) and core-collapse supernova (CC SN; Woosely and Weaver 1995). Although the error is large, the abundance pattern except Fe is similar to a CC SN of progenitor mass of 15 \Mo. Thus we regard that the RP has an ejecta origin from a CC SN of a 15 \Mo progenitor star. In Section 4.1, we discuss consistency of the observed data with this assumption.
The abundance of Fe in ejecta largely depends on the mass cut of the CC SN. If a major fraction of Fe would be captured into a collapsed object (neutron star or black hole) in the case of 3C 391, a small abundance of Fe in the ejecta would be reasonable, unless the explosion is highly asymmetric as is demonstrated by Yasumi et al. 2014. Another possibility is that only a small fraction of the Fe-rich ejecta has been shocked by the reverse shock (Fe-rich ejecta are expected to be located at the very inner part of the remnant). Since the Fe abundance estimated using the Fe-L lines only has a large uncertainty due to their incompleteness, we can not conclude why the abundance of Fe is lower than expected.
The recombination parameter ( cm-3 s) is the largest among any RP discovered so far in MM-SNRs (Yamaguchi et al. 2009, 2012, Ozawa et al. 2009, Ohnishi et al. 2011, Sawada & Koyama 2012, Uchida et al. 2012, Yamauchi et al. 2013).

The spectra of the SE and NW also show the RP. Since the extended OH emission reported in the NW region suggests the interaction with molecular clouds, the slightly higher than the SE would be reasonable. On the other hand, and show no significant difference between the two regions.
We found a hint of line emission at 6.4 keV, Fe\emissiontypeI K line at level from the SE region, and not from the NW region where the SNR interacts with molecular clouds. However the SE region is coincident with OH masers. One possibility is that the Fe\emissiontypeI K line is due to low energy cosmic-ray electrons, which are preferentially made in the SE region. The gyro radius of the lower energy electrons is extremely small, and hence diffusion length is far smaller than the SNR size. The absence of the Fe \emissiontypeI K line at the NW, where cool gas is denser than the SE, would be due to this limited diffusion length. Deeper observations of hard X-ray will probably detect bremsstrahlung by low energy cosmic-rays interacting with molecular clouds. In any case, the detection of Fe\emissiontypeI K line is marginal, thus we need more detailed observations in the future.
4.1 The abundances and mass of the Recombining Plasma
The abundances and emission measure of RP given in table 3 are based on the H dominant plasma. We assume that the RP originates from an ejecta of 15\Mo progenitor (figure 6), which indicates super-solar abundances even for the light elements such as He, O and Ne. The estimations of emission measure and abundances of heavy elements largely depend on the abundances of He, O and Ne; large abundances of these light elements enhance the continuum (mainly bremsstrahlung) flux, although the relative spectral shape is not affected because emission lines of He–Ne are absent in the relevant energy band of 1.2–7.0 keV. We thus re-estimate the emission measure and abundances of heavy element assuming the light element mass distribution is the same as the progenitor star of 15\Mo. The abundances of Mg–Ca relative to Si in the RP component do not change from the original H dominant plasma but the averaged abundance of Si–Fe relative to hydrogen becomes 15 solar, confirming its ejecta origin. The emission measure becomes cm-3, where and are a filling factor and the SNR distance in the unit of 8 kpc, respectively. The ratio of the electron to the atomic hydrogen densities is and the number ratio of all the elements to hydrogen is 2.0. Adopting the source radii of pc, the ejecta mass is estimated to be \Mo. As is seen in Figure 1 of Chen et al. 2004, filling factor would be very small, hence we assume is in the range of 0.3–0.1. Then the ejecta mass is 10–25 \Mo. This value is consistent with the initial assumption that 3C 391 is a remnant of CC SN with a progenitor mass of 15\Mo.
The ionization age of the RP is estimated using . The electron density is cm-3. Then the elapsed time is () years, which place this SNR as a rather old SNR. If we assume a small filing factor, the age of yr estimated by Chen & Slane (2001) has a very similar value.
4.2 Origin of the Recombining Plasma
Several scenarios are proposed to explain the formation of RPs in SNRs. One is the rapid electron cooling by the thermal conduction from cold matters around SNRs (Kawasaki et al. 2002) or the adiabatic rarefaction (Itoh and Masai 1989, Shimizu et al. 2012). The other is the ionization by the suprathermal or non-thermal particles (Masai et al. 2002, Ohnishi et al. 2011) or the high energy photons (Kawasaki et al. 2002). Therefore, the presence of RP in 3C 391 means that the plasma experienced the rapid electron cooling or extra-ionization.
We first discuss the electron cooling scenario. If the electron cooling is due to thermal conduction, a timescale of the thermal conduction is
| (2) |
where is the temperature gradient scale length (Kawasaki et al. 2002). This timescale is much longer than the estimated age of 3C 391, therefore the thermal conductivity is unlikely to produce the whole RP in 3C 391 of which the radius is about 7 pc.
Next scenario is rarefaction, which is the possible origin of the RP in W28 (Sawada & Koyama 2012). If the progenitor of 3C 391 was a massive star with a strong stellar wind activity, there can be a dense circumstellar media (CSM) surrounding the ejecta. The blastwave breaking out of the shell can lead to rarefaction of the PI or near CIE plasma. Thereafter the electron temperature can drop rapidly due to adiabatic expansion but the ionization states can stay more or less the same. This scenario is supported by the fact that the recombination timescale is close to the putative age of 3C 391. While Reynolds and Moffett (1993) estimated that the shell “break-out” occurred at about 1600 yr after the supernova, the blast wave breaks out of the CSM at only 100 yr (Itoh and Masai 1989, Shimizu et al. 2012). Since no significant spectral differences except the possible presence of a 6.4 keV line in the NW and a slightly larger in the SE, we argue that the rarefaction of ejecta plasma was roughly symmetrical, unlike W49B as suggested by some models (e.g. Miceli et al 2010). Our results show that the RP of 3C 391 was produced by the “break-out” from the CSM and evolved independently from the interstellar environment. For 3C 391, we apply a model of an early phase break-out (Shimizu et al. 2012), while Zhou et al. 2011 proposed a later phase break-out for W49B. This difference is due to their different circumstellar environments; 3C 391 would have a denser and more compact CSM compared to that of W49B. Although the extra-ionization process could be an alternative interpretation, it is still impossible to identify the origin of RP with the present data alone. We hence encourage deeper observation of 3C 391.
5 Conclusions
We observed the middle-aged SNR 3C 391 with Suzaku for 100 ks. We generated a background model for the GRXE and analyzed the X-ray spectrum of 3C 391. Our conclusions are summarized below:
-
•
The X-ray spectrum of 3C 391 is well described by a CIE+RP model. 3C 391 has the highest value among the RP SNRs ever discovered. This means the RP of 3C 391 approaches ionization equilibrium the most.
-
•
Estimated progenitor mass of 15 \Mo roughly agrees with the X-ray emitting mass of the RP derived from the corrected emission measure. This means only the ejecta plasma is overionized.
-
•
The parameters of RP have no significant difference between the NW and SE regions. Thermal conduction is unlikely to be the origin of the RP at 3C 391. The symmetrical evolution of RP is consistent with a rarefaction of the plasma in the early phase. In order to draw a more conclusive picture we need deeper observations with more sensitive instruments, such as those to be onboard the ASTRO-H mission (Takahashi et al. 2010).
-
•
Our detailed analysis of the spectra of 3C 391 suggests a hint of Fe\emissiontypeI K emission at 6.4 keV (), which can be explained by the interaction with a molecular cloud.
The authors express sincere thanks to all the Suzaku team members. This work is supported by JSPS Scientific Research grant number 24540229 (K.K.). et al.
References
- [Abdo et al.(2010a)] Abdo, A. A., et al. 2010a, ApJ, 712, 459
- [Abdo et al.(2010b)] Abdo, A. A., et al. 2010b, ApJ, 718, 348
- [Abdo et al.(2010c)] Abdo, A. A., et al. 2010c, ApJ, 722, 1303
- [Abdo et al.(2010d)] Abdo, A. A., et al. 2010d, Science, 327, 1103
- [Aharonian et al.(2004)] Aharonian, F. A., et al. 2004, Nature, 432, 75
- [Anders & Grevesse(1989)] Anders, E., & Grevesse, N. 1989, Geochim. Cosmochim. Acta, 53, 197
- [Arnaud(1996)] Arnaud, K. A. 1996, Astronomical Data Analysis Software and Systems V, 101, 17
- [Brickhouse et al.(2000)] Brickhouse, N. S., Dupree, A. K., Edgar, R. J., Liedahl, D. A., Drake, S. A., White, N. E., & Singh, K. P. 2000, ApJ, 530, 387
- [Castro & Slane(2010)] Castro, D., & Slane, P. 2010, ApJ, 717, 372
- [Chen & Slane(2001)] Chen, Y., & Slane, P. O. 2001, ApJ, 563, 202
- [Chen et al.(2004)] Chen, Y., Su, Y., Slane, P. O., & Wang, Q. D. 2004, ApJ, 616, 885
- [Condon et al.(1998)] Condon, J. J., Cotton, W. D., Greisen, E. W., Yin, Q. F., Perley, R. A., Taylor, G. B., Broderick, J. J. 1998, AJ, 115, 1693
- [Frail et al.(1996)] Frail, D. A., Goss, W. M., Reynoso, E. M., Giacani, E. B., Green, A. J., & Otrupcek, R. 1996, AJ, 111, 1651
- [Ishisaki et al.(2007)] Ishisaki, Y., et al. 2007, PASJ, 59, 113
- [Itoh & Masai(1989)] Itoh, H., & Masai, K. 1989, MNRAS, 236, 885
- [Iwamoto et al.(1999)] Iwamoto, K., Brachwitz, F., Nomoto, K., Kishimoto, N., Umeda, H., Hix, W. R., & Thielemann, F., 1999, ApJS, 125, 439
- [Kaastra et al.(1996)] Kaastra, J. S., Mewe, R., & Nieuwenhuijzen, H. 1996, UV and X-ray Spectroscopy of Astrophysical and Laboratory Plasmas, 411
- [Kawasaki et al.(2002)] Kawasaki, M. T., Ozaki, M., Nagase, F., Masai, K., Ishida, M., & Petre, R. 2002, ApJ, 572, 897
- [Kinugasa & Tsunemi(1999)] Kinugasa, K., & Tsunemi, H. 1999, PASJ, 51, 239
- [Koyama et al.(2007)] Koyama, K., et al. 2007, PASJ, 59, 23
- [Kushino et al.(2002)] Kushino, A., Ishisaki, Y., Morita, U., Yamasaki, N. Y., Ishida, M., Ohashi, T., & Ueda, Y. 2002, PASJ, 54, 327
- [Masai et al.(2002)] Masai, K., Dogiel, V. A., Inoue, H., Schönfelder, V., & Strong, A. W. 2002, ApJ, 581, 1071
- [Miceli et al.(2010)] Miceli, M., Bocchino, F., Decourchelle, A., Ballet, J., & Reale, F. 2010, A&A, 514, L2
- [Mitsuda et al.(2007)] Mitsuda, K., et al. 2007, PASJ, 59, 1
- [Morrison & McCammon(1983)] Morrison, R., & McCammon, D. 1983, ApJ, 270, 119
- [Ohnishi et al.(2011)] Ohnishi, T., Koyama, K., Tsuru, T. G., Masai, K., Yamaguchi, Hiroya., & Ozawa, M., 2011, PASJ, 63, 527
- [Ozawa et al.(2009)] Ozawa, M., Koyama, K., Yamaguchi, H., Masai, K., & Tamagawa, T. 2009, ApJ, 706, L71
- [Radhakrishnan et al.(1972)] Radhakrishnan, V., Goss, W. M., Murray, J. D., & Brooks, J. W. 1972, ApJS, 24, 49
- [Reynolds & Moffett(1993)] Reynolds, S. P., & Moffett, D. A. 1993, AJ, 105, 2226
- [Sawada & Koyama(2012)] Sawada, M., & Koyama, K. 2012, PASJ, 64, 81
- [Serlemitsos et al.(2007)] Serlemitsos, P. J., et al. 2007, PASJ, 59, 9
- [Shimizu et al.(2012)] Shimizu, T., Masai, K., & Koyama, K. 2012, PASJ, 64, 24
- [Smith et al.(2001)] Smith, R. K., Brickhouse, N. S., Liedahl, D. A., & Raymond, J. C. 2001, ApJ, 556, L91
- [Takahashi et al.(2010)] Takahashi, T., et al. 2010, Proc. SPIE, 7732,
- [Tawa et al.(2008)] Tawa, N., et al. 2008, PASJ, 60, 11
- [Uchida et al.(2012)] Uchida, H., et al. 2012, PASJ, 64, 141
- [Uchiyama et al.(2011)] Uchiyama, H., Nobukawa, M., Tsuru, T., Koyama, K., & Matsumoto, H. 2011, PASJ, 63, 903
- [Uchiyama et al.(2013)] Uchiyama, H., Nobukawa, M., Tsuru, T. G., & Koyama, K. 2013, PASJ, 65, 19
- [Wilner et al.(1998)] Wilner, D. J., Reynolds, S. P., & Moffett, D. A. 1998, AJ, 115, 247
- [Woosley & Weaver(1995)] Woosley, S. E., & Weaver, T. A. 1995, ApJS, 101, 181
- [Yamaguchi et al.(2009)] Yamaguchi, H., Ozawa, M., Koyama, K., Masai, K., Hiraga, J. S., Ozaki, M., & Yonetoku, D. 2009, ApJ, 705, L6
- [Yamaguchi et al.(2009)] Yamaguchi, H., Bamba, A., & Koyama, K. 2009, PASJ, 61, 175
- [Yamaguchi et al.(2012)] Yamaguchi, H., Ozawa, M., & Ohnishi, T. 2012, Advances in Space Research, 49, 451
- [Yamauchi et al.(2013)] Yamauchi, S., Nobukawa, M., Koyama, K., & Yonemori, M. 2013, PASJ, 65, 6
- [Yasumi et al.(2014)] Yasumi, M., Nobukawa, M., Nakashima, S., Uchida, H., Sugawara, R., Tsuru, T. G., Tanaka, T., Koyama, K. 2014, PASJ, 59
- [Zhou et al.(2011)] Zhou, X., Miceli, M., Bocchino, F., Orlando, S., & Chen, Y. 2011, MNRAS, 415, 244