A 100 mHz QPO in the X-ray emission from IGR J17361-4441
IGR J17361-4441 was discovered by INTEGRAL undergoing its first detectable X-ray outburst in 2011 and initially classified as an accreting X-ray binary in the globular cluster NGC 6388. A reanalysis of the outburst data collected with INTEGRAL and Swift suggested that the enhanced X-ray emission from IGR J17361-4441 could have been due to a rare tidal disruption event of a terrestrial-icy planet by a white dwarf. In this letter we report on the analysis of XMM–Newton data collected in 2011 during the outburst from IGR J17361-4441. Our analysis revealed the presence of a 100 mHz quasi-periodic oscillation in the X-ray emission from the source and confirmed the presence of a soft thermal component (kT0.08 keV) in its spectrum. We discuss these findings in the context of the different possibilities proposed to explain the nature of IGR J17361-4441.
Key Words.:
x-rays: binaries – X-rays: individuals: IGR J17361-44411 Introduction
IGR J17361-4441 (hereafter J17361) is a hard X-ray transient discovered by INTEGRAL (Winkler et al., 2003) in the globular cluster NGC 6388 (Gibaud et al., 2011). The first INTEGRAL detection of the source was reported on 2011 August 11, but the off-line analysis of Swift /BAT data revealed that the outburst might have started about 14 days before (Del Santo et al., 2014, hereafter S14). The total duration of the event was estimated to be 200 days (Bozzo et al., 2012). A Chandra observation performed on 2011 August 29 revealed that the source was located outside the dynamic center of the globular cluster and thus ruled out the hypothesis that the dormant intermediate mass blackhole (IMBH) suspected to be hosted in NGC 6388 could have experienced an episode of enhanced accretion (Lanzoni et al., 2007; Pooley et al., 2011).
The duration of the X-ray outburst from J17361 was reminiscent of what is typically observed from BH X-ray binaries. However, the stringent upper-limit obtained on the source radio emission seriously challenged this interpretation (Ferrigno et al., 2011). More controversial was the attempt to classify the source as a neutron star (NS) X-ray binary. On one hand, the localization of J17361 within the globular cluster NGC 6388 ruled out the possibility of J17361 being a high mass X-ray binary. On the other hand, NS low mass X-ray binaries (LMXBs) often display during outbursts pulsations down to millisecond periods and/or thermonuclear explosions. Neither of these phenomena were observed from J17361 (Bozzo et al., 2011), thus leaving margins for alternative possibilities.
An interesting interpretation of the nature of J17361 was proposed by S14. These authors showed that the source X-ray luminosity decayed during the last 70 days of the outburst following a profile that is typical of tidal disruption events (TDEs). Given the lack of any extended Galaxy in the HST observations performed in the direction of J17361, they proposed that the TDE was of Galactic origin and was caused by the disruption of a terrestrial-icy planet by a white dwarf (WD). As the latter has a typical accretion efficiency around 10-4, the accreted mass during the entire outburst was estimated to be 21027 g. The authors also suggested that the soft thermal component with a temperature kT0.08 keV and a radius 12600 km detected in the broad-band spectrum of the source (0.4-100 keV) was originated from the fall-back disk formed around the WD during the TDE.
In this letter we report on the timing and spectral analysis of an XMM–Newton observation that was performed about 42 days after the onset of the outburst from J17361.
2 Data analysis
The XMM–Newton (Jansen et al., 2001) observation of J17361 was carried out on 2011 September 23 for about 42.3 ks. The EPIC-pn was operated in timing mode, while the two MOS cameras were in full frame. We reduced these data by using the SAS version 13.5 and the latest calibrations files available on the XMM–Newton repository111http://xmm2.esac.esa.int/external/ xmm_sw_cal/calib/index.shtml. The observation was not affected by intervals of high flaring background, and thus we retained the entire exposure time available for the following analysis. For the EPIC-pn the source lightcurve and spectra were extracted in the energy range 0.6-12 keV222Data below 0.6 keV were discarded in order to avoid residual calibration uncertainties, see http://xmm2.esac.esa.int/ docs/documents/CAL-TN-0018.pdf by selecting CCD columns comprised between 34 and 42. The background was extracted by using columns comprised between 3 and 14. We verified a posteriori that different reasonable choices of the source and background extraction regions did not affect significantly our final results. Two lightcurves of the source were extracted in the 0.6-1 keV and 1-12 keV energy bands. The lightcurves, background-subtracted and corrected for all relevant instrumental effects with the epiclccorr task, were rebinned adaptively in order to achieve in each time bin a signal-to-noise ratio S/N10 and calculate the corresponding hardness ratio (HR; for the adaptive rebinning technique see Bozzo et al., 2013). No significant HR variations were measured during the observation; we thus extracted a single EPIC-pn spectrum by using all the exposure time available.
EPIC-MOS1 and MOS2 data were extracted in the energy range 0.5-10 keV. Given the relatively high flux of the source, we found that the two MOS were significantly affected by pile-up333http://xmm.esac.esa.int/external/ xmm_user_support/documentation/ uhb/epicmode.html. We used the tool epaplot to estimate this effect and removed the pile-up by using for both cameras an annular extraction region centered around the source position with an external radius of 800 pixels (i.e. ) and an inner radius of 280 pixels (i.e. ). We also analyzed RGS data and extracted the source spectra by following standard procedures444http://xmm.esac.esa.int/sas/current/documentation/ threads/rgs_thread.shtml. Throughout this paper, uncertainties are given at 90% c.l., if not stated otherwise.
On the MOS images we noticed the presence of stray-light photons due to a bright source located outside the field-of-view. The stray-light features extended down to the boundary of the source point-spread-function. The above mentioned external radius of the MOS annular extraction region was chosen in order to avoid the largest contamination from the stray-light features. For the EPIC-pn data in timing mode, no stray-light correction is possible, as the camera provide limited spatial information in this operating mode. We note, however, that for a source as bright as J17361 the stray-light photons are usually considered to cause a negligible contamination in the EPIC and RGS data. The collecting area of these photons is indeed only a few cm2 (Stockman et al., 1998), corresponding to about 0.2% of the on-axis collecting area555See http://xmm.esac.esa.int/external/xmm_user_support/ documentation/uhb_2.1/node23.html. In order to verify that no significant contamination of the data took place, we performed both simultaneous fits with all EPIC and RGS spectra and with the MOS spectra alone, as the latter could be reasonably well corrected for the stray-light issue. The EPIC spectra were rebinned to have at least 25 photons per bin and prevent an oversampling of the energy resolution of the instruments by more than a factor of three. The RGS spectra were endowed with a relatively low statistics and no significant emission or absorption line could be revealed. We thus grouped these spectra in order to have at least 100 photons per bin and improve the S/N.
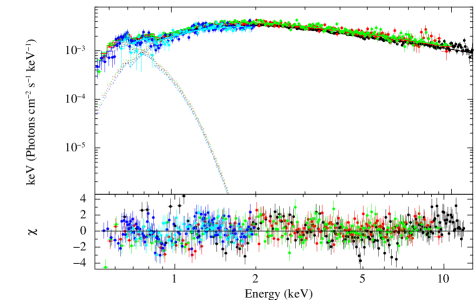
We performed first a simultaneous fit of all XMM–Newton spectra by using a simple absorbed (phabs in Xspec) power-law model (see Fig. 1). This fit gave an unacceptable result with /d.o.f.=4.1/633. We thus used the same spectral model proposed by S14 and added a diskBB component with temperature 0.08 keV and substituted the simple power-law with a cutoffpl. This model provided a reasonably good description of the data (=1.44/631). Forcing a higher diskBB temperature and lower normalization significantly worsened the fit (2). We fixed in the fit the value of the cut-off energy to that determined by S14 (=41 keV) and note that leaving this parameter free to vary in the fit does not significantly affect the final results. We measured an average absorption column density of =(0.530.14)1022 cm-2, a power-law photon index of =1.730.01, an inner disk temperature of 0.0820.002 keV, and a radius of (1320)-1/2 km, where is the inclination angle of the disk. We also included in the fit the normalization constants between different instruments. The normalization constant of the EPIC-pn was fixed at unity and we obtained =1.080.01, =1.130.01, =0.920.02, and =0.920.03 for the normalization constants of the MOS1, MOS2, and the sum of the RGS first and second order spectra, respectively. Given the relatively limited energy band of the EPIC cameras, an equivalently good fit (=1.45/630) could be obtained by using a compTT component instead of the cut-off power law (as suggested by S14). We did not measure significant changes in the properties of the diskBB component within this model; the soft seed photons temperature of the compTT component turned out to be compatible with the reported above. The averaged unabsorbed (absorbed) 0.6-10 keV flux estimated from the spectral fit was 5.010-11 erg cm2 s-1 (3.010-11 erg cm2 s-1). This corresponds to a luminosity of 1036 erg s-1 at a distance of 13.2 kpc (see S14 and references therein). We verified that the relatively large of the fit was due to noisy spectral bins and no systematic trend appeared that could suggest the need for additional spectral components. Compatible results (to within larger uncertainties) are obtained by fitting only spectra from the two MOS cameras, proving that stray-light photons are not significantly contaminating the pn data.
We also performed a timing analysis of all EPIC data. The source photons arrival times recorded by the three EPIC cameras were preliminary converted to the Solar system barycentre using the source position determined by Chandra (Pooley et al., 2011). As the EPIC-pn was the only instrument giving a time resolution high enough ( s) to search for periodic signals up to high frequencies, we made use of the data from this camera to investigate the presence of coherent signals. No significant detection (3) was found in the frequency range 10-3-150 Hz. In order to account for the possibility that J17361 was part of a binary system, we also searched for coherent signals by using shorter integration times for the power density spectra (PDS) of 3.96 ks. Even in this case, no significant detection was found and we estimated a 3 c.l. upper limit of 5.7% on the amplitude of any coherent signal in the spanned frequency range.
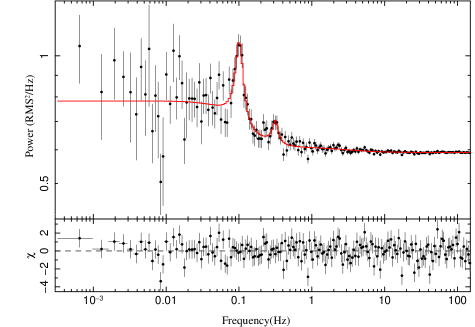
The EPIC-pn events (0.6-12 keV) were later binned every 2.952 ms in order to compute a PDS in each stretch of bins (corresponding to roughly 1.55 ks). All PDSs were then averaged to obtain the result shown in Fig. 2. The averaged PDS displayed a clear broad peak around 100 mHz. We tried to fit this PDS by using a model comprising a white noise component, a flat-top noise component and a quasi-periodic oscillation (QPO). As significant residuals were left from this fit, a second flat-top component was added to the model (all noise components were modelled through Lorentian functions; Belloni et al., 2002). The best fit results are summarized in Table 1.
In order to search for possible energy dependence of source PDS, we also extracted the latter by dividing the EPIC-pn data in the two energy bands 0.6-1.83 and 1.83-12 keV (the energy bands were chosen in order to have roughly the same number of photons in each band). The QPO at 100 mHz was clearly visible in both PDSs. The PDS extracted in the softer energy band did not require the addition of the higher frequency flat-top noise component in the fit; the other PDS displayed the presence of a second QPO at 300 Hz, consistent with being the third harmonic of the QPO at 100 mHz (see Fig. 3). All the results obtained from the fits to the different PDSs are summarized in Table 1. The energy dependence of the RMS for the QPO at 100 mHz is displayed in Fig. 4. The four energy bands were chosen to have a similar number of photons in each of them.
We verified that the QPO at 100 mHz is also detectable when the event files from the two MOS cameras are merged together (see Fig. 2). A fit to the PDS extracted from the combined MOS data gave results compatible with those reported in Table 1 (in this case a model comprising a single flat-top noise component and a QPO at 100 mHz gave an acceptable fit, as the time resolution of the MOS in full frame is 2.6 s and the high frequency part of the PDS is limited to 0.2 Hz).
3 Discussion
The nature of the hard X-ray transient J17361 remained so far elusive due to the lack of clear features in its X-ray emission that could help associating the source with one of the previously known class of objects displaying months-long X-ray outbursts reaching luminosities of 1037 erg s-1.

The XMM–Newton data of J17361 that we analyzed in this letter provide further elements to investigate its nature.
The XMM–Newton observation was carried out about 42 days after the first INTEGRAL detection of the source, and took place during the decay phase of the event as reported by S14. The combined fit of all EPIC and RGS spectra confirmed the emission model proposed by these authors, including a soft spectral component with a temperature of 0.08 keV. The radius of the thermal emission estimated by XMM–Newton is significantly lower than that reported by S14; however, we note that their value was obtained from the spectral fit to the data extracted to within the first 8 days from the beginning of the outburst and no information is provided on the evolution of the diskBB radius during the outburst. Furthermore, the absorption column density was fixed in their fit to 0.81022 cm-2, a value that is not fully consistent with that measured by XMM–Newton. Even though such spectral model does not permit to fully establish the nature of J17361, we note that the parameters of the diskBB component reported in Sect. 2 would still be consistent with the suggestion that such emission is originated from the inner boundary of a WD fall-back disk, if the system is observed at a high inclination (85 deg for a WD radius in the range 5-8108 cm).
Our analysis also revealed the presence of a 100 mHz QPO in the X-ray emission from J17361. Similar features are commonly detected in several different classes of Galactic and extra-Galactic X-ray sources (see, e.g., van der Klis, 2006, and references therein). LMXBs hosting accreting NSs so far displayed a wide variety of QPOs, spanning frequencies from a few up to 1300 Hz. These are associated to the motion of material within the NS accretion disk (Alpar & Shaham, 1985; Lamb et al., 1985; Titarchuk et al., 1999; Lamb & Miller, 2003), and in some cases have been suggested to provide an efficient probe of general-relativistic effects (Stella & Vietri, 1998). NS LMXBs hardly show QPOs at lower frequencies, the only exception being the case of mHz QPOs (Revnivtsev et al., 2001). However, these features appear around 7-9 mHz and are associated to thermonuclear explosions (Strohmayer & Mushotzky, 2003; Altamirano et al., 2008; Linares et al., 2012), a phenomenon not observed from J17361. Accreting WD in binary systems have long been known to display QPOs similar to those of NS LMXBs, and the frequency range spanned by these features includes the range of interest for the present analysis (Warner & Woudt, 2004). QPOs from accreting WD are detected both in soft X-rays (1 keV) and UV domain with periods either in the range 0.02-0.2 Hz or a factor of 10-20 larger666Longer-period DNOs were also observed in some cases (Warner & Woudt, 2004). The former features are usually called “Dwarf Novae Oscillations” (DNOs), as they are observed in the lightcurves of dwarf novae outbursts and have quality factors 103Q107; the latter have instead quality factors closer to those of QPOs in LMXBs (Q5-20). It has been proposed that DNOs are the equivalent of the kHz QPOs in LMXBs, and thus such features are interpreted as being due to the motion of material close to the inner boundary of the accretion disk surrounding the WD (see Warner & Woudt, 2002; Wheatley et al., 2003, and references therein). Indeed, as the Keplerian frequency of material orbiting in a disk is =1/2(/3)1/2 ( and are the compact object mass and radius), QPOs are expected at kilohertz for a NS system (106 cm) and at 100 mHz in the WD case (5-8108 cm).
Even though DNOs would have frequencies comparable with that of the QPO observed from J17361, the latter is detected up to much higher energies than those typical of DNOs. In particular, the QPO RMS fractional amplitude peaks at 1.2-1.8 keV and it is still significantly larger than zero up to 12 keV. As the thermal component with 1 keV detected from J17361 was interpreted as being originated from the inner boundary of the accretion disk around the WD, it seems unlikely that such hard QPO can be formed in this region. As noticed by S14, the hard X-ray luminosity emitted during the event recorded from J17361 would require anyway the presence of a hot corona in which hot electrons are able to up-scatter to higher energies the soft photons emitted from the disk through inverse-Compton. One could argue that, if the corona is located around the accretion flow and close to the disk inner boundary, it might provide the required environment where the soft QPO photons are up-scattered to higher energies.
| Range | 0.6-12 keV | 0.6-1.83 keV | 1.83–12 keV |
|---|---|---|---|
| WN | 2.055(1) | 2.008(1) | 2.00(1) |
| RMSN1 (%) | 15.4(7) | 20.5(8) | 12(2) |
| (Hz) | 0.078(9) | 0.060(7) | 0.09(4) |
| RMSQ1 (%) | 14.8(9) | 20(1) | 13(2) |
| 6(1) | 6(1) | 4(1) | |
| (Hz) | 0.102(1) | 0.103(1) | 0.101(2) |
| (%) | 20(2) | - | 20(3) |
| (Hz) | 4(1) | - | 4(2) |
| RMSQ2 (%) | - | - | 9(2) |
| - | - | 5(3) | |
| - | - | 0.31(1) | |
| /d.o.f. | 1.23/186 | 1.36/188 | 1.02/183 |
It is worth noticing that the QPO revealed from J17361 looks remarkably similar to other timing features observed from Ultra-Luminous X-ray sources (ULXs; Strohmayer & Mushotzky, 2003; Dewangan et al., 2006). The nature of QPOs in these objects is still a matter of debate (Pasham & Strohmayer, 2013), but it has been proposed that they could be related to the motion of material close to the last stable orbit around a central BH. ULX QPOs have thus been used to weight the total mass contained in these systems and could provide support in favor of the IMBH model proposed to interpret the ULX nature. A similar interpretation holds for the 5 mHz QPO detected from the TDE around the supermassive BH Swift J164449.3+573451 (Reis et al., 2012). The possibility of J17361 being an extra-galactic source has been considered unlikely by S14 due to its inclusion in the globular cluster NGC 6388 and the lack of extended sources detected by HST in that direction.
We thus conclude that, although it is difficult to completely rule out different possibilities for the nature of J17361, the results obtained from the analysis of the XMM–Newton data are compatible with the TDE suggestion proposed by S14. Further observations of similar events with the next generation of large area X-ray instruments (e.g., those on-board LOFT; Feroci et al., 2014) will help understanding the nature of puzzling timing features, as that observed from J17361.
Acknowledgments
TMB acknowledges support from PRIN INAF 2012-6 “Accreting X-ray binaries: understanding physics through periodic and aperiodic variability”. AP is supported by a Juan de la Cierva fellowship, and acknowledges grants AYA2012-39303, SGR2009- 811, and iLINK2011-0303.
References
- Alpar & Shaham (1985) Alpar, M. A. & Shaham, J. 1985, Nature, 316, 239
- Altamirano et al. (2008) Altamirano, D., van der Klis, M., Wijnands, R., & Cumming, A. 2008, ApJL, 673, L35
- Belloni et al. (2002) Belloni, T., Psaltis, D., & van der Klis, M. 2002, ApJ, 572, 392
- Bozzo et al. (2012) Bozzo, E., Ferrigno, C., Gibaud, L., et al. 2012, The Astronomer’s Telegram, 3958, 1
- Bozzo et al. (2011) Bozzo, E., Ferrigno, C., Stevens, J., et al. 2011, A&A, 535, L1
- Bozzo et al. (2013) Bozzo, E., Romano, P., Ferrigno, C., et al. 2013, A&A, 556, A30
- Del Santo et al. (2014) Del Santo, M., Nucita, A. A., Lodato, G., et al. 2014, ArXiv e-prints
- Dewangan et al. (2006) Dewangan, G. C., Griffiths, R. E., & Rao, A. R. 2006, ApJL, 641, L125
- Feroci et al. (2014) Feroci, M., den Herder, J. W., Bozzo, E., et al. 2014, ArXiv e-prints
- Ferrigno et al. (2011) Ferrigno, C., Bozzo, E., Falanga, M., et al. 2011, A&A, 525, A48+
- Gibaud et al. (2011) Gibaud, L., Bazzano, A., Bozzo, E., et al. 2011, The Astronomer’s Telegram, 3565, 1
- Jansen et al. (2001) Jansen, F., Lumb, D., Altieri, B., et al. 2001, A&A, 365, L1
- Lamb & Miller (2003) Lamb, F. K. & Miller, M. C. 2003, ArXiv Astrophysics e-prints
- Lamb et al. (1985) Lamb, F. K., Shibazaki, N., Alpar, M. A., & Shaham, J. 1985, Nature, 317, 681
- Lanzoni et al. (2007) Lanzoni, B., Dalessandro, E., Ferraro, F. R., et al. 2007, ApJL, 668, L139
- Linares et al. (2012) Linares, M., Altamirano, D., Chakrabarty, D., Cumming, A., & Keek, L. 2012, ApJ, 748, 82
- Pasham & Strohmayer (2013) Pasham, D. R. & Strohmayer, T. E. 2013, ApJ, 771, 101
- Pooley et al. (2011) Pooley, D., Homan, J., Heinke, C. O., et al. 2011, The Astronomer’s Telegram, 3627, 1
- Reis et al. (2012) Reis, R. C., Miller, J. M., Reynolds, M. T., et al. 2012, Science, 337, 949
- Revnivtsev et al. (2001) Revnivtsev, M., Churazov, E., Gilfanov, M., & Sunyaev, R. 2001, A&A, 372, 138
- Stella & Vietri (1998) Stella, L. & Vietri, M. 1998, ApJL, 492, L59
- Stockman et al. (1998) Stockman, Y., Domken, I., Hansen, H., et al. 1998, in Society of Photo-Optical Instrumentation Engineers (SPIE) Conference Series, Vol. 3445, EUV, X-Ray, and Gamma-Ray Instrumentation for Astronomy IX, ed. O. H. Siegmund & M. A. Gummin, 62–72
- Strohmayer & Mushotzky (2003) Strohmayer, T. E. & Mushotzky, R. F. 2003, ApJL, 586, L61
- Titarchuk et al. (1999) Titarchuk, L., Osherovich, V., & Kuznetsov, S. 1999, ApJL, 525, L129
- van der Klis (2006) van der Klis, M. 2006, Rapid X-ray Variability, ed. W. H. G. Lewin & M. van der Klis, 39–112
- Warner & Woudt (2002) Warner, B. & Woudt, P. A. 2002, in Astronomical Society of the Pacific Conference Series, Vol. 261, The Physics of Cataclysmic Variables and Related Objects, ed. B. T. Gänsicke, K. Beuermann, & K. Reinsch, 406
- Warner & Woudt (2004) Warner, B. & Woudt, P. A. 2004, in Astronomical Society of the Pacific Conference Series, Vol. 315, IAU Colloq. 190: Magnetic Cataclysmic Variables, ed. S. Vrielmann & M. Cropper, 85
- Wheatley et al. (2003) Wheatley, P. J., Mauche, C. W., & Mattei, J. A. 2003, MNRAS, 345, 49
- Winkler et al. (2003) Winkler, C., Courvoisier, T., Di Cocco, G., et al. 2003, A&A, 411, L1